Hist. Geo Space Sci., 2, 1–28, 2011 www.hist-geo-space-sci.net/2/1/2011/ doi:10.5194/hgss-2-1-2011
©Author(s) 2011. CC Attribution 3.0 License.
History
ofGeo- and Space
Sciences
Open
Access
Advances
inScience & Research
Open Access Proceedings
Open
Access
Earth System
Science
Data
OpenAccess
Earth System
Science
Data
D
iscussions
Drinking Water
Engineering and ScienceOpen Access
Drinking Water
Engineering and ScienceDiscussions
O
pen
Acc
es
s
Social
Geography
Open
Access
D
iscussions
Social
Geography
Open
Access
Danish auroral science history
P. Stauning
Senior Scientist (Emeritus) at the Danish Meteorological Institute, Lyngbyvej 100, 2100 Copenhagen, Denmark
Received: 11 August 2010 – Revised: 15 November 2010 – Accepted: 16 November 2010 – Published: 4 January 2011
Abstract. Danish auroral science history begins with the early auroral observations made by the Danish as-tronomer Tycho Brahe during the years from 1582 to 1601 preceding the Maunder minimum in solar activity. Included are also the brilliant observations made by another astronomer, Ole Rømer, from Copenhagen in 1707, as well as the early auroral observations made from Greenland by missionaries during the 18th and 19th centuries. The relations between auroras and geomagnetic variations were analysed by H. C. Ørsted, who also played a vital role in the development of Danish meteorology that came to include comprehensive auroral observations from Denmark, Iceland and Greenland as well as auroral and geomagnetic research. The very important auroral investigations made by Sophus Tromholt are outlined. His analysis from 1880 of auroral ob-servations from Greenland prepared for the significant contributions from the Danish Meteorological Institute, DMI, (founded in 1872) to the first International Polar Year 1882/83, where an expedition headed by Adam Paulsen was sent to Greenland to conduct auroral and geomagnetic observations. Paulsen’s analyses of the collected data gave many important results but also raised many new questions that gave rise to auroral expe-ditions to Iceland in 1899 to 1900 and to Finland in 1900 to 1901. Among the results from these expeexpe-ditions were 26 unique paintings of the auroras made by the artist painter, Harald Moltke. The expedition to Finland was headed by Dan la Cour, who later as director of the DMI came to be in charge of the comprehensive inter-national geomagnetic and auroral observations made during the Second Interinter-national Polar Year in 1932/33. Finally, the article describes the important investigations made by Knud Lassen during, among others, the In-ternational Geophysical Year 1957/58 and during the International Quiet Sun Year (IQSY) in 1964/65. With his leadership the auroral and geomagnetic research at DMI reached a high international level that came to be the background for the first Danish satellite, Ørsted, successfully launched in 1999 and still in operation.
1 Introduction
Over the auroral history interval from 1582 to present in-cluded in the paper, the extent of the Kingdom of Denmark has changed considerably. Hence it is not a simple task to define precisely, which part of the international auroral sci-ence history to classify as Danish. At the beginning of the epoch, the Kingdom in addition to present Danish main-land included Norway, Icemain-land, the Faeroe Ismain-lands, Green-land, southern Sweden, and northern Germany (Schleswig-Holsten) in different associations with Denmark. Norway, Iceland and the Faroe Islands were in union with Denmark but had local governments. Greenland was a Colony gov-erned from Copenhagen. Schleswig was a Danish Duchy and Holsten a German Duchy under the Danish King.
Correspondence to: P. Stauning
(pst@dmi.dk)
By the peace treaties following a series of unfortunate wars, the Danish Kingdom surrendered southern Sweden and a major part of Norway to Sweden in 1659–1660; the union with Norway was dissolved in 1814; Schleswig-Holsten was surrendered to Germany in 1864 (the northern part of Schleswig returned to Denmark in 1920). Furthermore, Ice-land became a sovereign state in 1918 and a fully indepen-dent nation in 1943. Greenland was given home-rule in 1979 and almost full independence in 2009. The Faeroe Islands gained home-rule in 1948.
2 The first Danish scientific observations and analyses of auroras
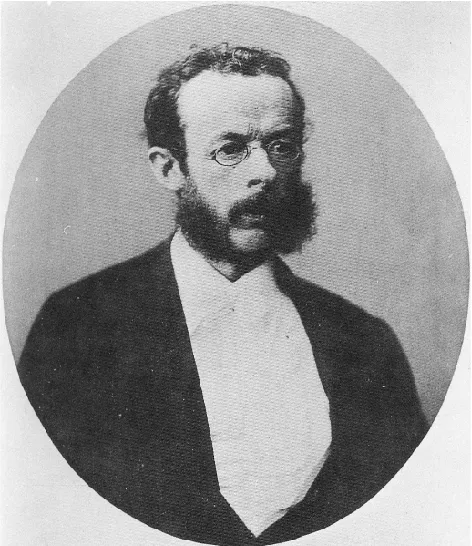
The first scientific recordings of auroras in Denmark were made by the astronomer (Fig. 1) Tycho (or Tyge) Brahe (1546–1601) from his observatory “Uranienborg” (Fig. 2) at the small island, Hven, situated in the belt between Denmark and Sweden a little north of Copenhagen. Tycho Brahe made numerous precise observations of stars, planets and comets but he also noted the occurrences of auroras. During the years from 1582 to 1592 he and his staff observed nearly hundred occurrences of auroras (Brahe, notes), which were later recovered by P. la Cour (1846–1908) and published in “Meteorologiske Journalen” (la Cour, 1876). However, dur-ing the last decade of his observations from 1593 until his unfortunate death after a dinner with his noble friends in Prag in October 1601, he only observed a few occurrences of au-roras in Denmark, possibly due to the declining sunspot ac-tivity which came to remain low for almost a century during the so-called “Maunder Sunspot minimum” named after the English scientist E. W. Maunder (1851–1928).
The steep rise in sunspot activity in the beginning of the 18th century marked the end of the Maunder sunspot min-imum during which magnetic storms and auroras were rare occurrences in Denmark. Then, as a number of large geo-magnetic storms occurred in 1705–1707 during the first large sunspot maximum following the Maunder minimum, the ac-companying auroras were observed and given a consider-able amount of attention not only in Scandinavia but also as far south in Europe as Paris in France and the ¨ Osterreich-Ungarisches (Austrian-Hungarian) Empire.
One example was the large geomagnetic storm occur-ring in the beginning of February 1707 (Gregorian calendar) where magnificent auroras were observed in Copenhagen. These auroras were observed by the Danish astronomer Ole Rømer (1644–1710) from Copenhagen Observatory located at the top of “Rundetårn” in the middle of the city. Ole Rømer is famous for having derived the finite velocity of light from the delay across the Earth’s orbit around the Sun in the ap-pearance of the moon orbiting Jupiter. He was deeply fas-cinated by the auroras and had drawings made of the dis-plays (Fig. 3, probably after his verbal description) to illus-trate an epistle: “Descriptio – Luminis Borealis quod Nocte inter 1 & 2 Febr. 1707 Hafnia visum est” to be published (Roemer, 1710) in the highly reputed book on scientific progress: “Miscellanea Berolinensia ad incrementum scien-tiarum”. In my translation to English from the German tran-script “Oluf R¨oemer: Beschreibung eines Nordlichtes das in Koppenhagen in der Nacht zwischen den 1ten und 2ten Febr. 1707 gesehen wurde.“ (Roemer, 1781) his description of the auroras reads:
“The beginning of the vision was at 11 o’clock. The arcs spanned from the west-north-west to the north-north-east; the largest distance from the horizon, the height, amounted to 3 degrees or 6 solar cross sections. Hereafter the phenomenon
Figure 1.Tycho Brahe (1546–1601).
Figure 2. Tycho Brahe’s astronomical Observatory at Hven:
Uranienborg (from J. Ottosen, Nordens Historie, 1902).
upper arc amounted to 4 degrees. At half past two bright rays were seen everywhere and the air-vision had its greatest per-fection. At two o’clock it was most intense and expanded by and large over the entire sky. At last, a dense streaky cloud covered the sky and the vision disappeared. In the recent years similar visions have been seen from the observatory between evening and morning; however, the vision has never been observed as bright and so perfect as this time.”
[“Der Anfang den Erscheinung war um 11 Uhr, und der
Bogen erstreckte sich von West Nord West gegen Nord Nord Ost. Seine gr¨oßte Entfernung vom Horizonte oder H¨ohe be-trug drei Grad oder 6 Sonnendurchmesser. Hieraus stieg das Ph¨anomen h¨oher, und wurde oben seiner ganzen L¨ange nach immer mehr erleuchtet, und diese Erleuchtung war st¨arker, als wenn der Mond sich hinter einer Wolke zu ver-bergen pflegt. Um halb zw¨olf Uhr erzeugte sich ¨uber dem vorigen noch ein neuer erleuchteter Bogen, doch waren beide noch ohne Strahlen. Um ein Uhr schossen zuerst von dem obern Bogen, und nicht lange nachher auch von dem untern einige helle Strahlen in die H¨ohe. Dieses Strahlenschiessen dauert einige Zeit, allein die Strahlen ver¨anderten sich ver-schiedentlich und mit großer Geschwindigkeit. Die meisten stiegen nach einer geraden Linie in die H¨ohe, einige neigten sich auf diese, einige auf die andere Seite. Wenn sie eben verschwinden wollen, wurden sie kurzer und breiter, und ihre gr¨osseste H¨ohe ¨uber dem obern Bogen betrug 4 Grad. Um halb drei Uhr konnte man an allen Orten helle Strahlen se-hen, und die Lufterscheinung hatte die gr¨osseste Vollkom-menheit. Um zwei Uhr stand es am h¨ochsten, und verbreit-ete sich nach und nach ¨uber den ganzen Himmel. Endlich verh¨ullte ein dichter reifartiger Nebel den Himmel, und die Erscheinung verschwand. In den letzern Jahren hat man auf dem Observatorium eine ¨ahnliche Erscheinung beobachtet, und zwar allemal in der Gegend zwischen Abend und Mor-gen, allein niemals hat man dieses Ph¨anomen so erleuchtet und so vollkommen gesehen, als diesesmal.“]
This is the first Danish published scientific (and quite pre-cise) description of auroras and an auroral substorm (auro-ral break-up). Ole Rømer continues in this epistle to outline similar observations made on 1 March from 10 p.m. to 1 a.m. The auroral display observed in that event is illustrated in Fig. 15 of the book. Further, he describes the event occurring on 6 March 1707, which is the day before he starts to write this epistle. Ole Rømer concludes his epistle (Rømer, 1710b) with the following scientific considerations where he rejects the common beliefs on the cause of auroras being associated with extreme warm or cold weather:
“Such air-visions are seen almost every year in Norway and Iceland. The just described phenomenon must be very low and close to us; otherwise, it would have been seen much more clear and large from Pilenburg two miles (∼14 km) from Copenhagen where it should, in addition, have been more vertical. It demonstrates the present rather than the future characteristics of the air, hence it does not indicate, as some people believe, warmer weather during summer
and colder during winter.” [“Fast alle Jahre siehet man
solche Lufterscheinungen in Norwegen und Island. Das jetzt beschriebene Ph¨anomen mußte sehr niedrich, und uns nahe sein, denn man hat es zu Pilenburg, zwo Meilen von Koppenhagen, viel deutlicher und gr¨oßer gesehen, und es mußte daher daselbst mehr vertikal sein. Es zeigt mehr die gegenw¨artige als zuk¨unftige Beschaffenheit der Luft an, denn es folgt nicht allemal, wie einige glauben, im Sommer heit-eres Wetter, im Winter Kalte auf dasselbe.“]
The Norwegian vicar Jonas Ramus (1649–1718) also re-ports on the large auroras seen over Copenhagen in 1707 in his book, ”Norrigets Beskrivelse”, from 1715 (Ramus, 1715). His description resembles that given by Ole Rømer and he dwells on the assumption that auroras were related to gaseous vapours escaping from hot sources located in the po-lar regions. An extract of this book and also reproductions of Rømer’s drawings are available in the review work by pro-fessor Joachim Friderich Ramus (1686–1769) on the history and physics of auroras (Ramus, 1745, 1747).
In spite of Rømer’s rejection of the idea of auroras be-ing caused by extreme temperatures, elements of this the-ory were brought forward, among others, by the Norwegian Johan Heitman (1664–1740) in his book (Heitman, 1741). Heitman considered the auroras to be the result of hefty mo-tions in nitrogen or sulphur vapours at great heights in the polar atmosphere and he associated the variability in the oc-currences of auroras to the varying temperature levels. An-other philosophical treatise based on earlier descriptions of the aurora was published in 1760 by the Norwegian philoso-pher G. Schøning (Schøning, 1760).
Vikings from Norway and Iceland have inhabited the southern part of Greenland since 985. Communications between the Nordic settlements in Greenland and Ice-land/Norway/Denmark continued until the beginning of the 15th century and were then lost for around 200 years. Dur-ing the 17th century the relations between Denmark and the northernmost regions suffered, among other reasons, from the difficult national conditions related to the long-lasting European wars, in particular the wars between Denmark and Sweden. Recovering from these conditions and building a strong international position with large Danish battle and merchant fleets, the interest in Greenland returned.
In 1721 the Danish-Norwegian vicar Hans Egede (1686– 1758) was sent to Greenland by the Danish King Frederik 4 to evangelize the descendents from the Vikings believed to be Catholics. To his surprise, Egede (Fig. 4) found the Inuit peo-ple instead of the Nordic and started to do missionary work among them. He also started trade with Greenland on behalf of the Danish King. Thus the relations between Denmark and Greenland were developing strongly during the 18th century and the frequent occurrence of auroras in Greenland became widely known and was mentioned in many publications deal-ing with Greenland (e.g., Egede, 1729).
Figure 3.a.a.a: two bright transparent arcs through which the stars are visible; b.b.b: a dark space between the two arcs; c.c.c: a dark space where a dense rain cloud appeared. [“a.a.a. Zwo helle durchsichtige Bogen, durch welche man die Sterne sehen konnte. b.b.b. Ein dunkler Zwischenraum zwischen den beiden Bogen. c.c.c. Ein dunkler Raum, der einer dichten Regenwolke hnlich war.”] (Ramus, 1745).
auroras and geomagnetic disturbances. Thus the important relation between auroras and geomagnetic disturbances was established through his publication in 1747 (Hiorter, 1747). One of the Danish missionaries in Greenland, Andreas Ginge (1755–1812) observed in Godthaab during the winter 1786– 1787 the movements of a compass needle during auroral ac-tivity. His observations were published in 1788 by Thomas Bugge (1740–1815) (Bugge, 1788).
The relations between auroras and magnetic variations had now been established but still not explained. One theory ex-plained the relation through the assumption that auroras were caused by magnetized cosmic dust entering the Earths atmo-sphere like miniature comets. It was not explained until the discovery of the magnetic properties of an electric current by Hans Christian Ørsted (1777–1851) who observed in 1820 the magnetic effect of an electric current. Ørsted published his discovery in the paper ”Experimenta circa effectum con-flictus electrici in acum magneticam.” (Hafniæ, 1820) and sent his article (Ørsted, 1820) to prominent scientists all over Europe.
H. C. Ørsted was strongly interested in auroras and well aware of their intriguing magnetic properties. He proposed in 1823 at one of the meetings for national and international members of the “Royal Danish Academy for Science and Letters” (Kgl. Danske Videnskabernes Selskab) in his re-marks on aurora theories (“Bemærkninger over Nordlysets
Theorie”, Ørsted, 1826) that “the luminous arc in large au-roras has precisely the same orientation as that of an elec-trical discharge with corresponding magnetic effects.” [”at
den lysende Bue af de store Nordlys netop har samme Ret-ning som en elektrisk UdladRet-ning maatte have, der skulde staae i samme Forhold til Magnetismen”]. The connection
between auroras and geomagnetic variations was confirmed by other investigations, among others in the publication is-sued in 1827 (Hansteen, 1827) reporting the observations conducted by the Norwegian scientist Christopher Hansteen (1784–1873), professor at the University in Christiania (now Oslo), Norway.
Figure 4.Hans Egede (1686–1758) (Frederiksborg Museum).
Institute (MI, now DMI) founded in 1872, which then took over the observational activities and data archives.
Secondly, H. C. Ørsted initiated scientific geomagnetic ob-servations first, in 1833–1834, at the Technical University (Polyteknisk Læreanstalt), for which he was founder and for some years acting headmaster. Later, in 1842, the obser-vations were located at the “Gyldenløve Fortress of Copen-hagen”. After 20 years of routine observations reported to the Royal Academy, the observatory was in 1862 relocated first to Rosenborg Fortress and later, in 1891, the magnetic obser-vations were resumed by the Meteorological Institute from an observatory installed in the Botanical Garden in Copen-hagen.
3 Preparations for the First International Polar Year
These activities initiated by H. C. Ørsted contributed to the combination of Meteorology, Geomagnetism and Auroral Research in Denmark for which the Meteorological Insti-tute has been the dominant platform for more than a century. The Institute was since its start in April 1872 a member of the international meteorological organisation (“Organisation M´et´eorologique Internationale”, OMI) headed by the perma-nent committee (CMI).
The first director for MI, Niels H. C. Hoffmeyer (1835– 1884), was a prominent member of “Polar Commission” of OMI. The interests for polar meteorological and geophysi-cal research were at that time very high among the mem-ber countries that had territories located in the northern
re-Figure 5.Hans Christian Ørsted (1777–1651) (Frederiksborg
Mu-seum).
gions. Following a proposal from the Austrian scientist Carl Weyprecht (1838–1881) on international comprehensive me-teorological and geophysical observations in the Arctic Re-gions, the Organisation at its second meeting held in Rome 1870 agreed to establish an International Polar Year to be held during 1882–1883 close to anticipated sunspot max-imum in 1883–1884. The idea was further substantiated by CMI during the meeting in Bern, Switzerland, in 1880 and endorsed by the final meeting in Copenhagen in 1882 presided over by Niels Hoffmeyer (Fig. 6).
Figure 6.Niels H. C. Hoffmeyer (1835–1884) (MI, 1972).
Furthermore, Hoffmeyer employed Sophus Tromholt (1851–1896) to analyze auroral data collected in Greenland. Born in Husum in Schleswig, Sophus Tromholt (Fig. 7) was Danish. He was a college-educated school teacher, inter-ested in natural sciences, like astronomy and meteorology, and mathematics and strongly devoted to studies of the au-rora. At the time of his association with the Danish Meteo-rological Institute he worked as a school teacher in Bergen. In the introduction to his work on auroral observations from Norway, Sweden, and Denmark (Tromholt, 1880) he writes (in English translation): ”Among the problems reserved for future research in natural sciences to solve, the explanation of the mysterious aurora comes among the foremost. Con-nected with secret ties to the movements at the Sun’s surface and to the Earth’s magnetic power, this splendid light phe-nomenon defies every attempt from Science to provide an-swers to the questions earnestly addressed to the observer.” [“Blandt de Opgaver, som det er Fremtidens
Naturforskn-ing forbeholdt at løse, indtager ForklarNaturforskn-ingen af Nordlysets gaadefulde Væsen en af de første Pladser. Knyttet med hem-melighedsfulde Baand til Bevægelserne paa Solens Over-flade og til Jordens magnetiske Kræfter, trodser dette herlige Lysfænomen endnu stadig ethvert Forsøg fra Videnskabens Side paa at besvare de Spørgsmål, som det saa indtrængende retter til Iagttageren.”]
Figure 7.Sophus Tromholt (1851–1896).
To provide a basis for this work he circulated 600 let-ters to vicarages all over Norway and to many Norwegian sea captains with a request to report on occurrences of au-roras and with an enclosed schematic form to shape a ho-mogeneous collection of material. In addition he collected notes on auroral observations from Norwegian, Swedish, and Danish meteorological stations provided through the Nordic Meteorological Institutes (Prof. Mohn in Christiania, Prof. Rubenson in Stockholm, Prof. Hildebranson in Upsala, and Capt. Hoffmeyer in Copenhagen) (excellent Nordic col-laboration) and he also made his own comprehensive auroral observations mainly from Bergen. Altogether, he collected 839 simultaneous observations from 132 stations in the three Nordic countries over 154 nights with auroras occurring dur-ing 1878–1879. These observations are described and ana-lyzed in his report published in 1880 (Tromholt, 1880). The instrument used to observe the parallaxes to auroras from two observing sites is shown in Fig. 8 and represents a consid-erable improvement over previous methods (e.g., Fearnley, 1859).
Figure 8. Tromholt’s Instrument for sighting auroras (Tromholt, 1880).
Danish scientists, primarily Adam Paulsen, with whom he worked up to the Polar Year Expedition. Thus his observa-tions and conclusions shall be briefly outlined here.
On the relations between auroras and weather, Tromholt notes (Tromholt, 1880, p. 115) that the auroras could have condensing or dissolving effects on the humidity of underly-ing air masses and claims havunderly-ing strikunderly-ingly proven the re-lations between auroras and clouds. From the differences in simultaneous observations of auroras from neighbouring places Tromholt further concludes (pp. 130–131) “that au-roras in many cases are quite localized and appear close to the Earth’s surface.” [“at Nordlyset i mange Tilfælde er et
temmelig lokalt Fænomen, og at det ofte optræder i ringe Høide over Jordoverfladen.”]. Tromholt reports a number of
cases of what he considers to be reliable information on auro-ras observed below mountain peaks, below low nimbus-like clouds, or even extending from trees at the ground.
Through the full interval of auroral observations from 1 September 1878 to 30 April 1879, Tromholt examines their relations to geomagnetic observations made twice a day, at 09 and 14 hours, from Christiania (Oslo) by Professor F. Fearnley. He found (pp. 138–139) “no evident relation be-tween the levels or changes in the magnetic instruments and the occurrences of auroras”. [”har det dog ikke lykkedes mig
at finde nogen paafaldende Sammenhæng mellem de mag-netiske Instrumenters Stand eller Forandringer og Nordlysets Optræden.”]
Tromholt has apparently not himself observed sounds from the aurora, but he faithfully refers (Tromholt, 1880, pp. 140–141) to trustworthy observations made by, among others, Professor Hansteen (1784–1873), and also his own father, J. P. Tromholdt, who reported to have heard sounds from auroras (Tromholdt, 1860). Sophus Tromholt (1880, p. 140) concludes that “one can not possibly deny the ex-istence of this mysterious sound.” [“at man umuligt kan
benægte Tilværelsen af denne gaadefulde Lyd.”]. In a later
publication (Tromholt, 1885c), he refers to various reported observations of auroral sounds.
One conclusion in his work (Tromholt, 1880) is quite cor-rect. Tromholt states (p. 138) that even in a solar minimum year, and in a limited region like the three Nordic countries, there will hardly be a single night without the occurrence of aurora somewhere within the region. And he claims this dis-covery to be one of the most important results of the compre-hensive auroral observations made during the winter 1878– 1879. In his further auroral studies he collected reports of ob-servations of auroras prior to 1878. This material (Tromholt, 1902) was edited by J. Fr. Schoeter and published in 1902 after Tromholt’s death in 1896.
The comprehensive work (Tromholt, 1880) and his con-tact with director Niels Hoffmeyer probably paved the way for his involvement with the Danish Meteorological Insti-tute to conduct analyses of auroral recordings from Green-land in preparation of the Polar Year Expedition. Among the observational activities and data archives taken over in 1872 by the Meteorological Institute from the Meteorolog-ical Commission established by H. C. Ørsted were vari-ous auroral observations. Observations of auroras were made from Stykkisholm in Iceland (1846–1873) and from Greenland by Bloch from Godthaab (1841–1846) (Bloch, 1856), by Rudolph from Jacobshavn (1840–1851) (Rudolph, 1856), by Fritz from Ivigtut (1875–1880) (S. Fritz, 1881), Upernavik (1874–1880), and Sukkertoppen (1875–1876 and 1878–1879). Most important are the observations made from Godthaab by Samuel Petrus Kleinschmidt (1814–1886) dur-ing the years from 1865 to 1882.
Figure 9.Samuel Petrus Kleinschmidt (1814–1886) (from Wikipedia).
auroras. Almost every day during the years from 1865 to 1882 he observed and reported on the weather three times a day, in the morning at 04–05, at noon around 12–13, and in the evening at around 21 hours local time. Among other parameters he reported on the cloud coverage – an impor-tant parameter in relation to auroral observations. During the morning and evening hours he also observed and reported on occurrences of auroras. In addition to reporting on the loca-tion and orientaloca-tion of the aurora he meticulously reported on the characteristics of the observed auroras. He formed his own methodical system composed of letters and numbers to characterize the location in the sky, the orientation, the shape, and the dynamics of the observed auroras.
Sophus Tromholt immediately recognized that observa-tions with these characteristics would form an exceptionally stringent description of the occurrences of auroras. Adding to the systematic characterization of auroras the extended in-terval (1865–1880) of very regular observations in the morn-ing (∼05) and evening (∼21) of almost every day and the careful simultaneous and co-located meteorological observa-tions (e.g. of cloud cover), makes this series of observaobserva-tions a unique resource for analyses of auroras.
Tromholt’s analysis of Kleinschmidts extensive observa-tions from Godthaab supplemented by shorter series of
au-roral observations from Stykkisholm, Upernavik, Sukkertop-pen, and Ivigtut was published in Danish and in French (for the international community) in the Annual Report for 1880 (issued in 1882) from the Meteorological Institute, and also as a separate extract in Danish and French with the title “Om Nordlysets Perioder efter Iagttagelser fra Godthaab i Grønland” (Sur les p´eriodes de l’aurore bor´eale) (Tromholt, 1882a). In the introduction (p. V) to his analyses Tromholt notes that “the investigations have given me, in several re-spects, the peculiar result, briefly spoken of, that everything regarding the varying frequency of auroras in Godthaab is in contrast to occurrences at more southerly latitudes”.
[“Un-dersøgelsen af de Godthaab’ske Nordlys har ført mig til et i flere Henseender mærkeligt Resultat, der kort kan ud-tales saaledes, at alt, hvad der henhører under Nordlysets vexlende Hyppighed, i Godthaab udviser et Modsætnings-forhold, til hvad der finder Sted paa sydligere Breder.”]
In his statistical analyses Tromholt utilized the precise lo-cal reports on cloud coverage to correct the numbers of ob-servations of auroras thus making the material more repre-sentative of the real number of occurrences. He had noticed (p. IX) that “the number of observed auroras is nearly in-versely proportional to the level of cloudiness.” [“det
ob-serverede Nordlysantal er næsten nøjagtig omvendt propor-tionalt med Skymængden.”] (cloudiness on the
meteorologi-cal smeteorologi-cale from 0 to 4 or, since 1877, on the smeteorologi-cale from 0 to 10). This relation, he notes, contradicts the results published by Weyprecht (1878, pp. 35–36) that months with large amounts of clouds have disproportionally large numbers of auroras and his conclusion that “the clouds have a definite associa-tion with the auroras; it appears, as if the cloudiness favours the development of auroras.” [“die Wolken doch in einem
gewissen Zusammenhange mit den Nordlichtern stehen, und zwar w¨urde es erscheinen, als beg¨unstige die Bew¨olkung die Entwicklung der Nordlichter.”]
With the comprehensive and homogeneous data mate-rial collected by Kleinschmidt, Tromholt analyses the daily and seasonal variations in the geographical distribution and the occurrence frequency of auroras and the variations with sunspot activity expressed through the sunspot numbers (e.g., Wolf, 1858; Lovering, 1860, 1868). He obtained these data by direct correspondence with R. Wolf. His most important result, illustrated in Fig. 10, was (p. XII) that there “not only is no direct parallelism, but on the contrary an almost com-plete contrast between aurora and sunspot occurrence fre-quencies.” [“at der her ikke alene ikke er nogen Parallelisme,
men tværtimod en næsten fuldstændig Modsætning mellem Nordlys- og Solplethyppighedens Gang.”]. Tromholt divides
Figure 10.Relations between Wolf’s sunspot number (dotted line) and no. of auroral nights (heavy line). Thin line indicates equivalent values of auroras (Tromholt, 1882a).
(Tromholt, 1882a, p. XVII) that “the auroral observations in our possession from Polar Regions can only contribute to strongly substantiate the law derived with high certainty from the observations from Godthaab.” [“at de
Nordlysi-agttagelser, vi besidde fra Polaregnene, kun kunne bidrage til i høj Grad at styrke den Lov, som de Godthaab’ske Iagt-tagelser med saa stor Bestemthed antyde.”].
For the seasonal variation Tromholt concludes in agree-ment with Weyprecht (1878, p. 35) that the auroras in arc-tic regions have their maximum occurrence close to sol-stice, which is contrary to the distribution at middle latitudes where the occurrence frequency is maximum at equinoxes. Tromholt accepts the explanation given by Weyprecht (p. 35) that “the region of highest occurrences of auroras rises to-wards the North at winter solstice and retreats to the South at equinoxes” [“das sich der G¨urtel gr¨osster H¨aufigkeit
des Nordlichtes gegen das Wintersolstitium gegen Norden hebt und sich gegen die ¨Aquinoctien gegen S¨uden senkt.”].
Tromholt extends the theory to also comprise the solar cycle variation such that the region of highest occurrences moves southward (equatorward) at sunspot maximum and retreats northward at minimum. With present-day knowledge, both trends in the location of the auroral zone are correct but not the complete story.
Tromholt took the theory of a moving belt of maximum auroral occurrence one step further to include the daily vari-ations. Since he was aware that Godthaab is located in the northern outskirt of the auroral belt such that auroras in the northern sky are rare occurrences (contrary to the situation for the observations made by Weyprecht close to Franz Joseph Land north of Russia), he divides the south-ern auroras in two groups, one far south and another closer to zenith and considers for the two groups the relation be-tween evening and morning auroras. Statistically, he finds that the frequency of occurrences within the two groups is the same for evening auroras whereas the occurrences for morn-ing auroras are much more frequent close to zenith than fur-ther south. From these observations he concludes (Tromholt, 1882a, p. XXXVII) that “This important and with great cer-tainty derived result gives evidence that the auroral zone in its daily walk travels northward during the night.” [“Dette
vigtige og med stor Bestemthed fremtrædende Resultat vid-ner om, at Nordlyszonen ogsaa i Døgnets Løb foretager en Vandring, saaledes at den i Løbet af Natten bevæger sig mod Nord.”]. In Tromholt’s view this regularity also explains
the daily variations observed by Fritz (1874, 1881) for au-roras at lower latitudes where the occurrences maximize a few hours before midnight and then decrease during the fol-lowing hours. This conclusion is clearly an indication that the region of maximum occurrence of auroras has a daily variation in latitude. However, it was not until 1963 that the concept of an instantaneous auroral oval, where the region of maximum occurrence of auroras in the day is located 8–10◦ further poleward than at night, was suggested by the Rus-sian scientist Y. I. Feldstein (Feldstein, 1963) and now agreed and confirmed through auroral observations from ground and space.
Figure 11.Polar Year Observatory in Godthaab (1882–1883) (drawing, Paulsen, 1893).
aldrig nogensinde har bemærket nogen Lyd forbundet med Nordlyset, uagtet min Hørelse i Almindelighed har været ret god.”]
4 The Danish Polar Year Expedition to Godthaab 1882–1883
In the foregoing chapter the analyses of auroral observations from Greenland by S. Tromholt have been discussed exten-sively since this work was probably most valuable for the planning of the expedition and definition of its tasks. Most likely, the leader of the expedition, Adam Paulsen, as well as C. Ryder, and the other four members of the expedition team (Paulsen, 1893a, Introduction, p. 4) had little previous experience with auroral observations and handling of auroral data. Much of their knowledge of polar auroras was based on the observations reported by Weyprecht (1878). The instru-mentation and the later reports from the expedition (Paulsen, 1884, 1886, 1889, 1890, 1893a, b, 1894) indicate that its pri-mary objectives related to auroras were observations of the relations between aurora and geomagnetic variations as well as possible relations between the aurora and the atmosphere including the heights of auroras.
The Danish Polar Year Expedition left for Godthaab by ship on 17 May 1882. They brought materials to construct 5 buildings to house the instruments and the 6 members of the expedition at selected places in Godthaab (Fig. 11). The building for the magnetic observatory was placed on a small mound of pure gneiss with little content of iron. Other build-ings to house the meteorological instruments and living quar-ters were placed at safe distances in order not to disturb the magnetic observations. The geographical coordinates for the station were (64◦1004800N, 51◦400000W). (Today this
loca-tion is called “Kirkebakken” (Church Hill) and a statue of the missionary Hans Egede is placed on its top).
For the magnetic observations the expedition brought an Edelmann-Munich theodolite, a Kew inclinometer, an Edel-mann variometer, and an J¨urgensen-Copenhagen variometer. The basic magnetic elements for the station were estimated to be: H=0.968 Gauss, I=80◦150, D=57◦450. The season-ally varying regular daily changes in the elements were also determined. On the possible relations between auroras and magnetism, Paulsen notes (Paulsen, 1884, pp. 24–25) that the quiet or weak auroras in general gave no effects on the magnetic deflection while strong and variable auroras would give strong oscillations in the magnetic component.
Figure 12.Aurora (folded bands) observed from Godthaab to the South on 15 November 1882 at 00 h 10 m (drawing, Paulsen, 1893a).
i. “B¨ogen” (arc) shaped like a rainbow; when fully devel-oped it would reach the horizon at both ends.
ii. “B¨ander” (bands) arcs or curtains with folds and often strong motions.
iii. “F¨aden” (rays) elongated long rays often combined in bundles.
iv. “Krone” (crown) overhead bundle of rays all pointing towards a common point in the sky.
v. “Dunst” (haze or fog) brightenings without specific con-tours.
A preliminary report on the expedition was issued in 1884 (Paulsen, 1884). Later, the observations were meticulously reported by Paulsen in 1893 (Paulsen, 1893a, b). Totally, during the Polar Year expedition to Godthaab, the auroral observations during 14 August 1882 to 31 August 1883 com-prised 261 cases of arcs, 37 draperies, 160 rays, 284 bright auroral clouds, and 36 cases of auroral crowns. A r´esum´e of the description given in Paulsen (1890, pp. 312–314) illus-trates the typical development of auroral activity: Most often a steady arc appears in the south-eastern direction with its top in the magnetic meridian and both ends reaching the horizon. Then, one arc after the other moves northward, past zenith and eventually retreats in the opposite direction. Sometimes
the arcs are “incomplete” as their “feet” appear to be de-tached from the horizon. They now have the shape of freely “flying curtains” often with strong motions and formations of folds and rays. When the rays are interconnected they con-verge at the top and may form a giant fan. The curtains often appear to be flapping as if the wind produces wavy motions in the folds. The brightness is always strongest at the folds. With strong motions the lower border could display red and green colours. Otherwise the colours of the arctic auroras are white sometimes with a pale greenish tone.
Paulsen, in his description of auroras (Paulsen, 1890), dwells on the zenith arc described by Kleinschmidt in his classification. This type of arc, he notes, starts in the north-east, passes through or close to the zenith, and ends in south-west. Often the zenith arc is not “complete” (reaching ground at both ends) but detached at the ends to form vivid curtains or bands of rays. Sometimes strong whirls are formed in the middle of which no auroras are seen. A crown may now ap-pear due to the perspective effect of the bundle of rays aligned with the magnetic inclination needle. Hence the crown, he concludes (Paulsen, 1890, p. 314) correctly, is not a separate auroral form.
Figure 13.Auroras (multiple rayed bands) observed to South-West from Godthaab on 15 November 1882 at 00 h 30 m (drawing, Paulsen, 1893a).
whose azimuth and inclination could be read on angular scales. In addition, a shade was mounted on the pointer such that the auroral light would disappear when the pointer was aiming below the auroral curtains. Many of the greatest au-roras were carefully plotted on charts. For that purpose, star maps to display the sky visible over the horizon of Godthaab had been prepared in advance on transparent sheets. Adjust-ing for the sidereal time made it possible to map the auroras from their positions relative to the stars. One such example observed on 5 November 1882 at 06 h is displayed in Fig. 14. For the auroral height observations the expedition con-structed an additional shelter at the opposite coast of Godthaab fiord at a distance of 5.8 km in the direction of the magnetic meridian. Between the main station and the shelter, communications were made by light signals. The aiming devices were mounted at both the sighting stations and the pointers allowed to turn only in the magnetic merid-ian plane. Thus, from reading the angles to the lower bor-der of an aurora simultaneously at both places, the height could, in principle, be calculated by simple triangulation. The lowermost heights of 31 auroral arcs were determined. For 9 of these, the results were rejected since the parallax was too small considering the uncertainty in the observations (the heights would exceed 68 km). Of the rest, 8 cases gave heights between 19 and 68 km, while the remaining 14 cases gave heights between 0.6 and 9.8 km.
Figure 14.Plot of auroral forms observed on 5 November 1882 at
06h from Godthaab (drawing, Paulsen, 1893a).
Part I, p. 8) mentions that he has observed several auroras below cirrus clouds and draws attention to the observations on 17 October 1882 of a bright “auroral cloud” seen at altitudes of 0.6–1.4 km. The sighting instruments were later used in similar observations made by Garde and Eberlein from Nanortalik in 1885 with a base distance of 1249 m. Their observations gave heights between 1.8 and 15.5 km for the lower border of auroras (Garde, 1889). In his conclusions Paulsen (1893b, Part I, p. 14) states that within a region of width at least 4◦ extended across Greenland auroras could appear in all heights all the way down to the Earth’s surface. In his description of the auroral observation, Paulsen (1889, 1890, 1893a, b, 1894, 1895c, 1896) notes in sev-eral places (e.g., 1990, p. 313), that the auroral activity often ends in a giant bright cloud usually hovering at great heights, but sometimes appears like a wisp of smoke extending from the ground. Combined with the recordings of the low auro-ral heights these observations have substantially influenced Paulsen’s views on the origin and cause of the auroras. In his view, which was possibly influenced by similar thoughts in the early works of Tromholt (1880), the high arctic regions were the “home of the auroras” where they would extend all the way from the greatest heights to the ground, while at lower latitudes they would only occur at great heights. He considered like the Swedish scientist Edlund (1878) au-roras to be an electrical phenomenon in contrast to theories of “cosmic dust meteors” or “luminescent clouds” (Loomis, 1868).
In order to explore this aspect, the expedition also con-ducted observations of atmospheric electricity. A Thom-son, model Mascart, electrometer whose deflection was cali-brated by the voltages from batteries of Zinc-Glycerine gal-vanic elements was connected to a wire antenna carefully isolated from the surroundings. Such observations are heav-ily influenced by the humidity of the air, and the results from Godthaab are largely inconclusive since they only in-dicate the seasonal variations in the atmospheric conditions. Paulsen was aware of the problems and carefully watched the electrometer during auroral activity without observing deflections that could be related directly to the auroras. How-ever, he states as a general rule that in periods of strong au-roral activity the electrical field near ground weakens.
The electrical discharges could also conveniently explain the magnetic effects associated with auroras. During the Po-lar Year expedition to Godthaab direct observations of mag-netic deflections during auroras were rather sparse, since the auroral observations and the magnetic observations were made from different buildings. However, Paulsen (1893a, Part IV) states that the Polar Year observations are in agree-ment with later observations made by Vedel on Ryder’s expedition in 1891–1892 to Ile de Danemark (70◦270N, 26◦100W) near Scoresbysund at the East coast of Green-land. From observations of the magnetic deflections during approaching auroras, Vedel (1895) reports that the deflec-tion is constantly westward when the auroral arc is moving
from the South towards the station. When the aurora reached the zenith the magnetic deflection would oscillate strongly around the position it had before the aurora appeared. When the aurora then moved further North away from the station the deflection would be eastward. Paulsen (1893a, Part IV) notes that this variation is in agreement with his suggestion of an upward current from ground to great heights associated with auroral rays.
5 Dispute between Paulsen and Tromholt
Tromholt was not directly involved in the Danish Polar Year Expedition. He was at that time preparing auroral observa-tions from North Norway and Finland and he also wrote a number of popular articles in the monthly magazine “Na-turen” (1882b, No. 6, 7, 8, and 9) and (1883, No. 6) issued in Christiania. Here, he repeats his former theories on the daily, seasonal and sunspot-related periodicity in the loca-tion of the region of maximum auroral occurrences. He also reports on auroral height estimates based on triangulation of the strong aurora observed on 17 March 1880 from which he determines an average height of 147 km. Furthermore, he reports on the establishment of a new auroral observatory in Kautokeino in Finnmarken 100 km south of the Norwe-gian observatory in Bossekop for simultaneous observations of cloud coverage, and auroral form, position, azimuth, in-tensity, and motion. It seems (Tromholt, 1883) that Tromholt now casts doubt on previously reported observations of auro-ras in low altitudes.
Having analyzed the auroral observations from the Polar Year expedition, Paulsen starts to develop his own view on the aurora and its cause. As mentioned above he firmly believed that arctic auroras were related to electrical cur-rents reaching to ground at high latitudes. He also exam-ines Tromholt’s theories on the periodic motions of the re-gion of maximum auroral occurrences. In his bulletin to the Royal Danish Academy from 1889 (Paulsen, 1889), he com-pletely rejects the hypothesis on the daily oscillation in the latitude of maximum auroral occurrences and casts doubt on Tromholt’s theories on the seasonal and sunspot related peri-odic variation in the latitude of maximum auroral frequency. Born from considerations of auroras caused by discharg-ing of a surplus of negative electrical charge at high altitudes, the main argument (Paulsen, 1889, p. 26) for his new con-cept is the suggested rule that “a more active development of auroras in temperate regions reduces the auroral activity in the proper auroral zone).” [“Une evolution plus active des
ph´enom`enes de l’aurore bor´eale dans les r´egions temp´er´ees ralentit l’activit´e aurorale dans la zone propre des aurores”].
by Kleinschmidt from Godthaab and the observations from Nanortalik, Ivigtut and Jacobshavn, also used by Tromholt. In both data sets he finds a daily variation in the absolute intensity and occurrence frequency of auroras with a maxi-mum in the evening hours (around 9–10 p.m.). In his opinion, when the auroral activity in general decreases in the morn-ing hours then the more northerly auroras are no longer sup-pressed by the more southerly activity. Paulsen also argues the other way around: if the variation was just a daily os-cillation in latitude of the auroral region then the intensities and occurrence frequencies should be the same for morning auroras at high latitudes as those of the midnight auroras at lower latitudes.
For the seasonal variations Paulsen (1889) argues that the absolute intensity and occurrence frequency of auroras gen-erally maximize close to winter solstice at most latitudes. Again, from high activity during midwinter follows a reduc-tion in the occurrences and intensities of the arctic auroras at that time which could in his view at least partly explain the apparent motion of the latitude of the auroral belt. For the variation in the auroral frequency with number of sunspots, he acknowledges the minimum in the occurrence frequency of arctic auroras at high sunspot numbers without specifically attributing the variation to a motion in the latitude of the belt of maximum auroral activity (maximum zone).
These arguments and the fairly strong criticism of Tromholt’s theories, which he explicitly mentions quite of-ten, are repeated and further sustained in several of Paulsen’s publications in the following years (e.g., Paulsen, 1893c, 1894, 1896). Tromholt (1892), in an article in Petermanns Mittheilungen, argues against Paulsen’s criticism and also mentions his new observations from Finnmarken, which have been reported in the book: Under the Rays of the Aurora Borealis, London (Tromholt, 1885b) (in a Danish Version: Under Nordlysets Straaler (1885a)). From this book it ap-pears that Tromholt, based on triangulation of synchronous sighting observations from Bossekop and Kautokeino, was the first to reliably deduce the heights of the lower border of aurora (long before the Norwegian scientist St¨ormer’s ex-cellent photographic technique took over). From a series of observations made during the winter 1882–1883 an average altitude of 113 km was found. A remarkably precise result consistent with much later height analyses, e.g., by Størmer.
6 Further development of Paulsen’s aurora theories – the auroral spectrum
Paulsen (Paulsen, 1893b, part IV, p. 14) was aware of the recent advances in laboratory spectroscopy and of the obser-vations in 1867 of the spectrum of auroral emissions made by the Swedish scientist Anders Jonas Ångstr¨om (1814–1874). Ångstr¨om had in 1867 identified in the auroral spectrum the strong green line (557.7 nm) and later the double red line (630.0 nm, 636.4 nm) (Ångstr¨om, 1869). Laboratory
exper-iments with electrical discharges in rarefied gases had con-vinced Paulsen that the auroral light was the result of elec-trical discharges in the atmosphere. With the simple spectro-scope used in Godthaab during the polar year the expedition only observed the dominant green auroral line (557.7 nm), which is also present in airglow. Hoping to detect further lines Paulsen even made efforts with very low auroras to di-rect the spectrometer towards the rays and shield the aper-ture against false light. But only the usual green line was observed.
In the succeeding publications, with his analyses of the Polar Year data and other auroral observations, Paulsen was troubled with the lack of laboratory verification of the green line. He was aware that the red line(s) from oxygen emis-sions and also the blue/violet line(s) from discharges in ni-trogen gas could be reproduced in experiments. But the green line could not be reproduced in laboratories (the vac-uum technique was not developed to produce the very low air pressure needed for the oxygen green line excitation). Thus Paulsen (Paulsen, 1893b, part IV, p. 15) considered the possi-bility of a hitherto unknown gas present in the highest atmo-sphere, but rejected this hypothesis and accepted Ångstr¨oms theory that the green line was produced by some fluorescence in the atmosphere caused by the effect of the radiation by an-other, probably ultra-violet, line in the auroral spectrum.
Thus, Paulsen (1896) had developed a comprehensive the-ory for the generation of auroras: Through the effects from solar illumination at the uppermost layers of the atmosphere, particularly in the equatorial regions, an amount of negative charge was formed in the daytime. The excess amount of negative charge would then drift towards the higher latitudes forming a current system at high altitudes. In the arctic re-gions the invisible “cathode rays” emitted from the negative charges would follow the magnetic field lines all the way down to the ground. During their descent the cathode rays in the discharge would cause the molecules of the atmosphere to glow, emitting light in the different lines of the auroral spectrum. The red and blue lines were directly related to the cathode rays whereas the green line was caused by fluores-cence related to some undetected radiation most likely in the ultra-violet part of the spectrum.
Figure 15.“Aurora”. Expedition base hut: Weather station, Painters studio, and Auroral observatory (Photo, DMI).
7 The Danish aurora expedition to Iceland 1889–1900
As Adam Paulsen had finished his works mainly based on the observations made on the Polar Year expedition to Godthaab he felt the need for further auroral observations for studies particularly of the auroral spectra and the electric and mag-netic effects related to auroras. An expedition headed by G. C. Amdrup was sent to East Greenland and made mag-netic observations during auroral activity (Holm, 1889; Am-drup, 1904; Hjort, 1904; Ravn, 1904). Another new auroral expedition to Greenland was planned. However, shortly be-fore departure on 30 July 1899 the destination was changed to Akureyri at the north coast of Iceland, which was located as favourably as Greenland for auroral studies and more eas-ily accessible.
Paulsen was now an elderly man, at an age of 66 years and visually impaired, but he took command of the expedi-tion, which included three young members: Dan Barfod la Cour (1876–1942), student in physics at Copenhagen Uni-versity, Ivar B. Jantzen (1875–1961), student at the Poly-technical University, and count Harald Moltke (1871–1960), an artist painter, who had been illustrator for the geologist K. V. J. Steenstrup (1842–1913) on a geological expedition to the Disko island in Greenland in the summer of 1898.
The expedition arrived by the ship “Botnia” to Iceland on 16 August 1899. Under supervision by Jantzen the expedi-tion brought materials for the construcexpedi-tion of buildings both
for a magnetic observatory and for a combined weather sta-tion and auroral observatory to house further instruments. The observatory building shown in Fig. 15 was constructed in the outskirt of the small Icelandic town, Akureyri, and (not surprisingly) named “Aurora”.
In addition to the main station a small shelter was con-structed at the top of the nearby mountain, “Sulur”. The photo in Fig. 16 presents the expedition team on top of Sulur: In the middle (standing) Adam Paulsen, to his right (sitting) Ivar Jantzen, behind him Harald Moltke, and to the left (sit-ting) Dan la Cour. The other persons are local (unknown) assistants.
The equipment deployed at the main station comprised standard instruments for meteorological observations of pressure, temperature, humidity and winds and magnetome-ters for the geomagnetic observations. Furthermore, special instruments were included for the observations of the spectra of auroras both in the visible and in the ultra-violet range, and for measurements of atmospheric electric fields and con-ductivities.
Figure 16. Iceland Expedition team at the top of Sulur mountain (Photo, DMI).
to improve the performance in the ultra-violet wavelength range. For the calibration of the spectrometers small Geissler discharge tubes manufactured by Frantz M¨uller, Bonn, filled with pure oxygen and nitrogen, respectively, were included along with electrical lamps with filaments of aluminium and copper. These light sources could be mounted in front of the spectrometers to produce reference spectral lines on the photographic strips mounted at the rear of the instrument. The tilt of the prism and the focal length were adjustable to adopt for the different wavelength ranges. A gunners sight-ing means was mounted at the rear of the instrument to allow an accurate aiming towards the auroras. The spectrometer observations were supervised by Dan la Cour.
For the geo-electrical observations two instruments were included. Both were based on the use of an “Exner” elec-trometer constructed by Franz Exner (1849–1926). The first one used the principle for measurements of atmospheric tricity devised by the French scientist Gouy. It used an elec-trode formed by a thin metal disk, 13 cm in diameter, with its top covered by filter paper powdered with a radioactive substance emitting alpha rays (Becquerel radiation) to im-prove air conductivity in the vicinity of the electrode. The powder was supplied by Pierre Curie (France). The disk was mounted on a ring of copper, which, in turn, was connected to the electrometer. For the observations the device could
Figure 17. Toepfer spectrometer with mount for calibration light
sources at the entrance (left) and sighting means mounted at the rear part (right) (Photo, DMI).
be mounted at the end of a rod and elevated to a convenient height from the top of the roof. Out of 53 days of electric field measurements only a dozen could be used. On the other days the observations were hampered either by bad weather or by snow drift.
The other geo-electric instrument was devised by the Ger-man scientists Julius Elster (1854–1920) and Hans Geitel (1855–1923) (Elster and Geitel, 1899). It used an elongated metallic cylinder mounted at the top of a well isolated mod-ified Exner electrometer. At the start of the measurement, the electrometer was charged from either the positive or the negative electrode of a pile of galvanic elements. Then the relaxation of the electrometer deflection was monitored in order to determine the time constant for the discharging of the cylinder. The time constant is related to the atmospheric conductivity, which was assumed to be proportional to the concentration of ions of the proper polarity in the air sur-rounding the cylinder. From similar measurements in the European Alpine mountains, Elster and Geitel reported sim-ilar time constants for discharging of positive and negative potentials. For the measurements made in Akureyri, both from the base station “Aurora” and from the small shelter lo-cated at the top of Sulur, there was a marked difference with consistently larger time constants for discharging the nega-tively charged compared to posinega-tively charged electrometer. Paulsen (1900c, p. 14) concluded that the air close to ground in Iceland is richer on positive ions than air in more southerly regions.
to the Royal Academy (Paulsen, 1900a, b). In the prelim-inary report from March 1900, Paulsen (1900a) reports on having observed 22 lines in the ultra-violet wavelength range not earlier found in the auroral spectra reported, among oth-ers, by the French scientist Angot in 1895 (Angot, 1895). A more comprehensive report (Paulsen, 1900c) was issued to the International Congress on Physics assembled in Paris un-der the auspices of the “Societ´e francaise de Physique”.
In the start of the data processing, the photographic strips used in the spectrographs were visually scanned by using magnifying glasses. Later an ocular mounted on an ad-justable micrometer slider was used for the scaling of the recorded lines for precise detection of wavelengths in the au-roral spectra. A complete list of observed emission lines is provided in the table published by Paulsen (1900c). The au-roral spectral lines were compared to reference lines gener-ated by the calibration light sources and to the lines reported by Angot (1895). There was good agreement between many of the auroral ultra-violet lines and the reference lines pro-duced by the discharges in nitrogen and oxygen gases. An example is displayed in Fig. 18 (from Paulsen, 1906).
In his report to the International Congress, Paulsen (1900c) also reports on the results from the electric and mag-netic observations made during the expedition to Iceland. The observations of atmospheric electric field indicate within the observational interval from 08 in the morning until 02 af-ter midnight a regular daily variation with the field increasing from 08 am until 1 or 2 p.m. and then decaying until 02 a.m. Paulsen (1900c) is more inconclusive concerning the rela-tions between auroras and the electric field. He menrela-tions the occurrences of small positive perturbations in the electric po-tentials during strong overhead auroras.
Further, Paulsen (1900c) reports to the Congress that the effects of the auroras on the geomagnetic field, generally, were fairly small. During quiet auroral arcs there were hardly any notable effects seen on the magnetic instruments. The largest perturbations in the declination were seen during ac-tive moving auroras, which also produced many distinct lines in the recorded spectra. However, the deflections observed during the winter 1899–1900 never exceeded 3 degrees even during the greatest auroras, which could be compared to de-flections of 10 to 11 degrees observed during strong auroral activity in Godthaab during the Polar Year expedition 1882– 1883.
The expedition also tried to estimate the heights of auro-ras in a simple way. From two not too distant locations they monitored the position of the auroral arcs or bands relative to selected stars. When at one of the locations the star was seen just at the edge of the aurora, the observer here would give a signal to the other observer who would then from his location observe the angular difference between the lines of sight to the selected star and to the lower border of the aurora in that direction. The results were consistently several hun-dreds of km, usually between 300 and 400 km, and thus, in
Figure 18.Spectra from Nitrogen gas (top) and from Aurora
(bot-tom). Inserts are magnified sections (Paulsen, 1906).
Paulsen’s view, they were rather disappointing. No cases of “local auroras” were observed.
In his own words (in English translation) quoted from the book, (Moltke, 1964, pp. 68–74), Moltke describes the chal-lenge he was facing when arriving in Iceland: “Although I had never seen an aurora, I was convinced, that I could teach myself to paint these heavenly phenomena, since I was profoundly interested in clouds and lighting effects in the air, nocturnal in particular. I was very excited to make ac-quaintance with the polar lights, which I believed should be painted in pastel shades. However, after having seen the first aurora, I realized that it had to be the oil paints that would best reproduce these fantastic phenomena.” [“Skønt
jeg aldrig havde set et nordlys, følte jeg mig overbevist om, at jeg kunne lære mig selv at male disse himmelske fænomener, da jeg interesserede mig meget for skyer og luftbelysninger, særlig natlige. Jeg var meget spændt på at gøre bekendtskab med polarlysene, som jeg på forhånd mente, bedst kunne males i pastel. Men efter at have set det første nordlys blev jeg klar over, at det måtte blive olie-farven, som nærmest kunne gengive disse fantastiske fænomener.”].
Harald Moltke was deeply fascinated by the auroras ob-served from Akureyri: “Auroras are not like anything else on our globe. They are mysterious. They go beyond the human fantasy to the degree that you instinctively resort to expressions such as “supernatural”, “divine”, “miraculous”. Only little by little did I learn to reproduce these hovering, dancing revelations; only little by little did I realize that in all the arbitrariness, there were still laws obeyed even by these wild, intemperate phenomena.” [“Nordlys ligner ikke
noget andet på vor klode. De er gådefulde! De overgår i den grad den menneskelige fantasi, at man uvilkårligt tyer til sådanne udtryk som ‘overnaturligt’, ‘guddommeligt’, ‘mi-rakuløst’! Først lidt efter lidt lærte jeg at kunne gengive disse svævende, dansende åbenbaringer, først lidt efter lidt lærte jeg, at der i al vilkårligheden var love, som selv disse vilde, ubeherskede fænomener lystrede!”].
Moltke describes his first attempt to reproduce the auro-ras in painting as “some confused daubing, which the sci-entists (and myself first of all) rejected as being completely useless.” [“noget forvirret smøreri, som
videnskabsmæn-dene (og jeg selv først og fremmest) kasserede som ganske ubrugelige.”]. However, he gradually improved his
tech-nique and succeeded to produce excellent reproductions of a diversity of auroral forms and colours.
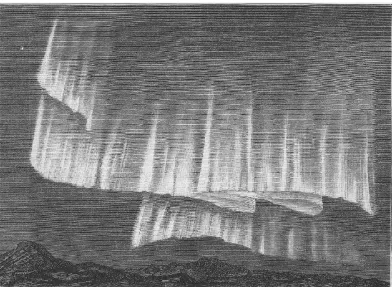
“The first fairly successful aurora was a drapery phe-nomenon observed on 1 September 1899 (Fig. 19) over the hill just behind our house. With a pencil I sketched the shape of the aurora, indicated the stars through which the veil draperies were moving, and memorized carefully the colours of the aurora and the sky. The next day I painted from memory, backed by the sketches and further studies of the landscape, a picture that was applauded by the scientists.” [“Det første nordlys som nogenlunde lykkedes, var et
draper-ifænomen, set 1. september 1899 over bakken lige bag vort hus. Med en blyant kradsede jeg formen af nordlyset op, an-gav stjernerne, hvorigennem slør-draperierne bevægede sig,
Figure 19.Aurora over Akureyri on 1 September 1899 at 17:45 h.
The first successful painting by Harald Moltke (Photo, DMI).
samt indprentede mig nøje farven på nordlyset og himme-len. Den næste dag malede jeg efter hukommelsen, støttende mig til disse streger og nogle landskabelige studier, et billede, som vandt videnskabsmændenes bifald.”]
“The most common shape of the aurora is the forming of draperies. Giant luminous curtains with folds waved by invisible hands and turned to cornet-like formations, now strongly glowing, now fading away to reappear somewhere else.” [“De almindeligste former for nordlys er
draperidan-nelser. Vældige, lysende tæpper med foldekast, som usynlige hænder vifter med og drejer rundt til kræmmerhuslignende formationer, snart lysende stærkt, snart svindende bort for at opstå et andet sted.”] (see example in Fig. 20).
The arcs span from horizon to horizon and are the steadiest of the phenomena. But suddenly bundles of rays congregate within these arcs like piano keys played by invisible hands, back and forth, back and forth, until they all disappear with a twitch.” [“Buerne spænder fra horisont til horisont og er
de roligste af fænomenerne. Men pludselig kan der samle sig strålebundter i disse buer, som tangenter, hvorpå usynlige hænder giver sig til at spille, frem og tilbage, frem og tilbage, indtil det hele forsvinder med et ryk! ”].
Figure 20.Auroral display observed over the base station “Aurora” in Akureyri on 13 January 1900, at 20:20 h by Moltke (Photo, DMI).
fascinated by the scientific efforts from the other members of the expedition to detect the emission lines in the auro-ral spectrum. “The aurora has its own spectrum. When we started our research, only one line was known, the “Aurora line”. Among our tasks was the photographic recording of the auroral spectrum in order to detect further lines in ad-dition to the dominant one. For this purpose Dan la Cour had a very expensive instrument, a spectrograph, resting on a concrete pillar erected from a small pile of soil just outside our observatory. He succeeded to make a photograph – of 3 lines, I think – within the ultra-violet part of the spectrum. La Cour showed me a small plate on which the auroral spectrum appeared indistinctly at the right end. In auroral research this was an epoch-making result and science-wise our finest achievement.” [”Nordlyset har sit eget spektrum. Dengang,
da vi begyndte vore forskninger, kendte man nærmest kun een linje, nordlyslinjen. Blandt vore opgaver var at fotografere nordlys-spektret og om muligt derigennem finde flere linjer foruden den udprægede. Til dette brug havde Dan la Cour et meget kostbart apparat, en spektograf, hvilende på en ce-mentsokkel, som ragede op af en lille jordhøj, anbragt lige udenfor vort observatorium. Det lykkedes ham også at fo-tografere - jeg tror tre linjer – i den ultra-violette del af spek-tret. La Cour viste mig da en lille plade, hvorpå
nordlysspek-tret tegnede sig utydeligt i højre side. Dette var indenfor nordlysforskningen epokegørende og videnskabelig set vort fineste resultat.”]
8 The Danish auroral expedition to Utsjoki 1900–1901
Strongly encouraged by the successful expedition to Ice-land, Paulsen organised another auroral expedition sent out from the Danish Meteorological Institute during the winter of 1900–1901 this time to Utsjoki in the northernmost region of Finland. Paulsen was too aged himself to take part in the ex-pedition, which this time was headed by Dan la Cour. Other members of the expedition team were the master of engi-neering Carl Edvard Thune Middelboe (1875–1924), univer-sity student Johannes K. Kofoed (1877–1939), and the artist painter, count Harald Moltke who like la Cour had been in Iceland with the former aurora expedition.
The main purpose of the expedition was to extend the ob-servations made in Iceland to another region and to look for possible differences. The instrumentation brought to Utsjoki was much the same as that used in Akureyri during the past winter season, that is, two spectrometers, electric field and conductivity instruments, magnetometers, and standard me-teorological instruments. The expedition took up quarter in a vacant house in Utsjoki named “England” (after its English owner, Mr. Stewart, who had been eaten by a tiger in India) and established a field station “Denmark” close to the church located 5 km south of Utsjoki. Between the two stations a wire telephone line was constructed in order to synchronize observations.
Paulsen reports in a short communiqu´e (Paulsen, 1901a) on the results from the expedition. The occurrence of auro-ras was less frequent than seen during the Iceland expedition, but those observed were more intense and colourful. During 7 weeks of observations from 26 December until 14 Febru-ary the expedition succeeded in observing a further aurora spectral line at 316 nm deep down in the ultra-violet range (Paulsen, 1901b). The electric field measurements were inconclusive while the conductivity measurements demon-strated a regular daily variation only perturbed during un-usual windy conditions. The expedition tried to estimate au-rora heights and derived altitudes of 60 to 70 km and above.
Like the case with the expedition to Iceland, a most re-markable outcome from the expedition to Finland was a se-ries of aurora paintings made by Harald Moltke. In his own words (Moltke, 1964, pp. 75–83) (in an English translation) he describes their routine activities:
Figure 21.Aurora over Utsjoki on 22 February 1901 at 18:35 h by Moltke (Photo, DMI).
sparser here than in Iceland, but on the other hand they were stronger, faster, and more colourful, red and green. When there were auroras and we, therefore, were very busy with the instruments, then the Lapps would surround us, a wondering crowd, laughing and having fun as if it was a theatre per-formance. Since the auroras were increasing it was decided to prolong our expedition. The last weeks had particularly strong auroras.”
[“Da vi først havde indrettet os i den lille bjælkehytte, førte
vi et meget regelmæssigt liv. Til klokkeslet skulle vi aflæse in-strumenterne og gøre vore iagttagelser. Min tid var ligeligt fordelt mellem forsøg til bestemte tider og maling af nordlys. Også her fik jeg gengivet mange karakteristiske fænomener. Gennemgående var nordlysene sparsommere her end i Is-land, men til gengæld var de stærkere, hurtigere og mere farvede, røde og grønne. Var der nordlys, og vi derfor var i fuld aktivitet ved instrumenterne, omringede lapperne os; en undrende skare, som lo og morede sig, som om de var til en teaterforestilling. På grund af nordlysenes stadige tiltagen blev det bestemt, at vor ekspedition skulle forlænges noget. De sidste uger havde særlig stærke nordlys.”] (see example
in Fig. 21).
“Director Adam Paulsen who was most pleased with the results, including those of the painter, planned to collect the material in a great publication on the two aurora expedi-tions where my paintings – or a selection – should be re-produced in colour. But alas! Adam Paulsen died before the dream of his life, the decisive book on auroras, was written.” [“Direktør Adam Paulsen, som var meget tilfreds med
resul-taterne, også malerens, ville samle stoffet i et større værk om de to nordlysekspeditioner, hvor mine billeder – eller et
udvalg – skulle gengives i farver. Men desværre! Adam Paulsen døde, før hans livs store drøm, den afgørende bog om nordlys, blev skrevet.”].
9 End of the Paulsen era in Danish auroral research
After the successful wintering expeditions to Iceland in 1899–1900 and to Finland in 1900–1901, the subsequent analysis of the collected data continued onward to 1906 end-ing with a review publication (Paulsen, 1906). In this work, Paulsen examines other recent theories for the aurora and expresses several relevant objections. First, discussing the aurora theories published by the Norwegian scientist Kris-tian Birkeland in 1896 (Birkeland, 1896), Paulsen demon-strates several shortcomings of the theory. At that time Birke-land had already proposed a modified theory in 1901 (Birke-land, 1901). In Paulsen’s view, even Birkeland’s new theory, which was also based on the guiding of cathode rays emitted from the Sun into the polar atmosphere along lines of force in the Earth’s magnetic field, could not possibly explain the di-versity of auroral displays and the great temporal and spatial variability in the intensities and shapes of observed auroras.
Similarly the theory issued by the Swedish scientist Ar-rhenius (1900) was found by Paulsen to be inadequate. Ac-cording to this theory, negatively charged particles were “chased away” from the Sun by the pressure of the emitted light thereby producing a continuous “rain” of these parti-cles throughout the Universe. At the Earth this rain would produce electrified clouds, which could only be discharged at high latitudes where the lines of force were vertical. Thus the theory failed to allow for auroras at middle and low lati-tudes. Furthermore, according to Paulsen (1906) the diurnal and seasonal variations would come out in the wrong way.