Drink. Water Eng. Sci., 5, 67–72, 2012 www.drink-water-eng-sci.net/5/67/2012/ doi:10.5194/dwes-5-67-2012
©Author(s) 2012. CC Attribution 3.0 License.
History
of
Geo- and Space
Sciences
Open
Access
Advances
in
Science & Research
Open Access ProceedingsDrinking Water
Engineering and ScienceOpen Access
Open
Access
Earth System
Science
Data
Drinking Water
Engineering and ScienceDiscussions
O
pen
Acc
es
s
Open
Access
Earth System
Science
Data
D
iscussions
Abnormal quality detection and isolation in water
distribution networks using simulation models
F. Nejjari1, R. P´erez1, V. Puig1, J. Quevedo1, R. Sarrate1, M. A. Cuguer´o1, G. Sanz1, and J. M. Mirats2
1Technical University of Catalonia (UPC), 10 Rambla Sant Nebridi, 08222 Terrassa, Spain
2CETaqua Water Technology Centre, Crta. d’Esplugues n.75, 08940 Cornell`a de Llobregat, Spain
Correspondence to: F. Nejjari ([email protected])
Received: 29 June 2012 – Published in Drink. Water Eng. Sci. Discuss.: 10 August 2012 Revised: 11 October 2012 – Accepted: 16 October 2012 – Published: 16 November 2012
Abstract. This paper proposes a model based detection and localisation method to deal with abnormal quality levels based on the chlorine measurements and chlorine sensitivity analysis in a water distribution network. A fault isolation algorithm which correlates on line the residuals (generated by comparing the available chlorine measurements with their estimations using a model) with the fault sensitivity matrix is used. The proposed methodology has been applied to a District Metered Area (DMA) in the Barcelona network.
1 Introduction
Drinking water distribution networks are complex large-scale systems that are designed to supply clean water to consumers at any time based on demand. To guarantee the high quality of water, chlorine is certainly the most common disinfectant used in these systems. The maintenance of chlorine residual is needed at all the points in the network. Its propagation and
level are affected by both bulk and pipe wall reactions.
Wa-ter quality fault will result in reduction of residual oxidant and can be manifested in added variability and lower chlo-rine concentrations at sensor locations in the network. This variability of chlorine concentration in the network would
allow differentiating normal from anomalous water quality
conditions.
The water distribution network can be perceived as a com-plex chemical reactor in which various processes occur si-multaneously (Sadiq et al., 2003). Some of these processes take place in the bulk phase and others on the pipe’s wall, and all of them can degrade water quality. Water quality faults can be caused directly or indirectly by an internal corrosion
due to an oxidation/reduction reaction, by detachment and
leaching of pipe material or biofilm formation (LeChevallier et al., 1987), by regrowth of microorganisms on the
inter-nal surface and/or by a loss of disinfectant and formation of
byproducts (DBPs), or an intrusion of contaminants (Lindley, 2001).
This paper proposes a detection and localisation method for abnormal water quality levels based on chlorine mea-surements and chlorine sensitivity analysis of the nodes in a network. Simulations of the water quality of the network per-formed both for realistic and abnormal bulk decay at a certain time in each pipe segment (link) provides an approximation of this sensitivity. A fault isolation algorithm that correlates the residuals (generated by comparing the available chlorine concentration measurements with their estimated values us-ing a model) with the fault sensitivity matrix is used. The correlation between the observed residual fault signature and each column of the sensitivity matrix is a measure of the
sim-ilarity of the residual effect concerning pipe bulk decay fault
due to pipe material detachment. The proposed approach is illustrated by a simulation example, based on a real wa-ter distribution network. Wawa-ter quality data were obtained by simulation using EPANET 2.0 software, which can track the chlorine decay evolution through the water distribution system. The same methodology has been applied to detect and isolate leakages in nodes of the same network (Quevedo et al., 2011). In addition, a comparative study of this tech-nique based on correlation analysis and the one based on a binary matrix has been done in P´erez et al. (2011). Corre-lation analysis is also an important tool for data validation. Further good results, using the same methodology to deter-mine flow demand patterns given some metered data from
Barcelona water distribution network, are shown in Quevedo et al. (2010). Nevertheless, the application to abnormal water quality detection introduces irrelevant dynamics in leakage detection achieved using quasi-static models.
This paper is organised as follows: in Sect. 2, the method-ology used for water quality diagnosis is presented. In Sect. 3, the proposed approach is demonstrated by its appli-cation on a DMA of the Barcelona water distribution net-work. Finally, in Sect. 4 some conclusions are given.
2 Water quality fault diagnosis
2.1 Fault diagnosis procedure
Model based fault diagnosis consists in the process of detect-ing and isolatdetect-ing a fault by usdetect-ing analytical redundancy tech-niques to monitor the changes in the dynamics of a system (Gertler, 1998). The consistency check is based on residu-als r(k) computation, obtained from measured input u(k) and output y(k) signals and the analytical relationships which are obtained by system modelling that provide an estimated out-put ˆy(k):
r(k)=y(k)−ˆy(k) (1)
At each time step k, the residual is compared with a thresh-old value (zero in the ideal case and almost zero in a real case). The threshold value is typically determined using
sta-tistical or set-based methods that take into account the effect
of noise and model uncertainty (Blanke et al., 2006). When a residual is bigger than the threshold, it is determined that there is a fault in the system; otherwise, it is considered that the system is working properly. In practice, because of
in-put/output noise, nuisance inputs and modelling errors aff
ect-ing the model considered, robust residual generators must be used. Robustness can be achieved at the residual generation phase (active) or at the evaluation phase (passive). Robust residual evaluation allows obtaining a set of observed fault signatures
Φ(k)=hφ1(k), φ2(k), ...φnφ(k)
i
(2)
where each fault indicator is obtained as follows:
φi(k)=
(
0 if |ri(k)| ≤τi(k)
1 if |ri(k)|> τi(k)
and where τi(k) is the threshold associated to the residual
ri(k).
2.2 Fault localisation using the correlation method
Fault isolation is carried out on the basis of observed
fault signatures, φi(k), generated by the detection
mod-ule and its relation with all the considered faults, f (k)=
h
f1(k), f2(k), ...fn f(k)
i
, which are compared with the theo-retical fault signature matrix.
The use of the information associated with the relation-ship between the residuals and faults, by means of the resid-ual fault sensitivity, allows improving the isolation results. Sensitivity Matrix S (Eq. 3) provides the sensitivity of the
chlorine sensor residuals for each different fault fjaffecting
the system:
f1 f2 · · · fm
S= r1 r2
.. .
rn
s11 s12 · · · s1m s21 s22 · · · s2m
..
. ... ... ...
sn1 sn2 · · · snm
(3)
where si j=
C1 f j−C1n f
fj with C1 f jand C1n f being the mean
val-ues of the chlorine concentration C1 in node j at a certain
time, when the bulk decay is abnormal or normal, respec-tively.
The main idea of correlation-based fault diagnosis consists in comparing the columns (faults) of the sensitivity matrix
S (Eq. 3) with the corresponding residual vector at time k
by using the correlation function. The correlation coefficient
ρr,Sf j(k) between r(k) and each column j of S (i.e. Sf j(k))
is computed as the Pearson’s correlation coefficient, that is
defined as:
ρr,Sf j=
cov(r,Sf j)
p
cov(r,r)cov(Sf j,Sf j)
(4)
where cov(r,Sf j)=E
h
(r−r)Sf j−Sf j
i
is the covariance
function between r and Sf jbeing r=E (r) and Sf j=E(Sf j),
respectively.
The columns of S having higher correlation values with the residual vector at time k are the most probable elements to have a fault. The correlation between the observed resid-ual fault signature (i.e. r(k)) and each column of the matrix S is a measure of the similarity between the real fault residual
effect (with unknown magnitude) and the faults considered
in matrix S (Eq. 3) (with known magnitude) that allows dis-covering which is the column of this matrix (fault) having the same behaviour. For faults with similar size to those used to obtain the sensitivity matrix S, the correlation function
ob-tains the maximum similarity (shape and form), i.e.ρ=1 in
the element having the fault, for any magnitude of the real fault. Because of the non-linearity of the water network sys-tem, if the real magnitude of the fault is far from the fault size used to compute matrix S, the similarity of the correlation function decreases but a high correlation between the residu-als corresponding to a particular fault and the corresponding column of the sensitivity matrix still exists.
The vector obtained is the decision vector that will be used to figure out which is the fault occurring in the system. More concretely, the maximum correlation value in this vector will point out the corresponding S column (fault) as the most probable element to be faulty:
max j
ρr,Sf j(k) (5)
RM0006075 8
XX00029794
E
XX00232057
E
Figure 1.The layout of Nova Ic`aria Network with the 3 installed
chlorine sensor.
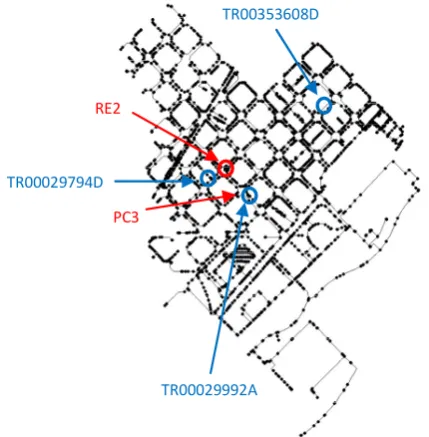
TR00353608D
TR00029992A TR00029794D
RE2
PC3
Figure 2.Location of chlorine injectors (red) and links with
chlo-rine decay fault (blue).
3 Application
A DMA of a real water distribution network (Fig. 1) was used to verify the proposed method for abnormal water quality de-tection and location. This DMA, located in Barcelona’s Nova Ic`aria area, is included in the 55th pressure level within the city network and has 1996 nodes and 3442 pipes. The DMA
Figure 3. Number of bulk chlorine decay faults using 3
pre-installed sensors.
3.22 3.24 3.26 3.28 3.3 3.32 3.34 3.36 3.38 x 10⁴
8.15 8.2 8.25 8.3 8.35 8.4 8.45x 10
4
X coordinate [m]
Y
c
o
o
rd
in
a
te
[
m
]
Nova Icaria Network
Network Nodes Selected Nodes Links
Figure 4. Geographic distribution of faults using 3 pre-installed
sensors.
has two inputs, called Alaba and Llull, and three chlorine sensors, which are also shown in Fig. 1.
Scenarios have been generated using EPANET simulation software, considering these three sensors already installed in the network (see Fig. 1). The events have been generated set-ting the Initial Quality and Source Quality parameters of the injectors Alaba (RE) and Llull (PC3) in Fig. 2. The
scenar-ios have been generated changing the Kbulk parameter at the
corresponding links of the network at 08:00 a.m of day 2
(32nd hour of the episode). The values of faulty/non-faulty
behaviours on these links are Kbulk=−2.306415 1/d for the
non-faulty mode and Kbulk=−50 1/d for the faulty mode.
1 2 3 4 5 6 7 8 9 10 0
50 100 150 200 250 300 350 400
Time [h]
D
is
ta
n
c
e
[
m
]
Error distance
Mean Minimum Maximum
3.29 3.3 3.31 3.32 3.33 3.34
x 104 8.31
8.32 8.33 8.34 8.35 8.36 8.37 8.38
x 104
X coordinate [m]
Y
c
o
o
rd
in
a
te
[
m
]
Fault Isolation, 10 hour data
Nodes Unfaulty (c<0.8) c>=0.8 c>=0.98 c>=0.99 Potential Fault (c=1) Real Fault
Figure 5.Error distance and geographic detail of chlorine bulk
de-cay fault detection for the link TR00353608D at hour 48.
The scenario has been run for 48 h and data sets have been created according to these scenarios.
Figure 3 shows the number of bulk chlorine decay faults that may be detected using sensors located in Fig. 1 after 96 h of simulation. It may be seen how, with the sensors already installed, the number of faults that may be detected is about 500. These links are distributed geographically as shown in Fig. 4.
Three different links of the network, included in the set
of detectable faults in Fig. 3, are considered to generate the faulty scenarios. These links labelled “TR00353608D”,
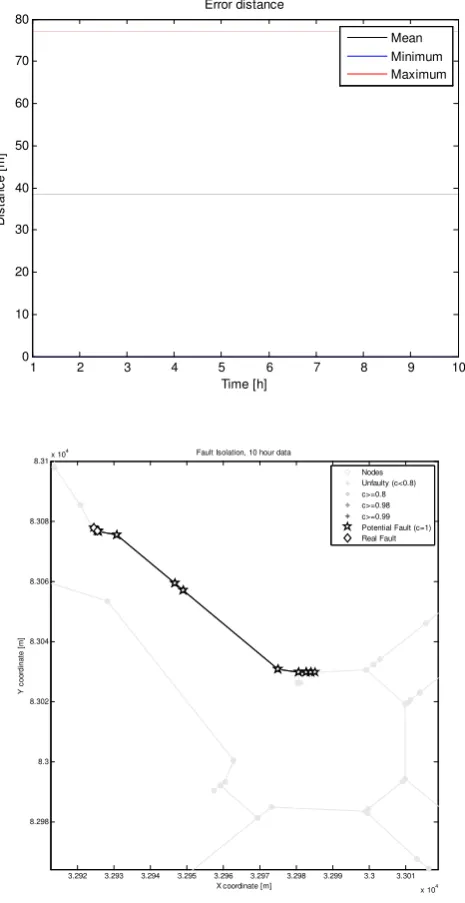
1 2 3 4 5 6 7 8 9 10
0 10 20 30 40 50 60 70 80
Time [h]
D
is
ta
n
c
e
[
m
]
Error distance
Mean Minimum Maximum
3.292 3.293 3.294 3.295 3.296 3.297 3.298 3.299 3.3 3.301 x 10⁴
8.298 8.3 8.302 8.304 8.306 8.308
8.31x 10
4
X coordinate [m]
Y
c
o
o
rd
in
a
te
[
m
]
Fault Isolation, 10 hour data
Nodes Unfaulty (c<0.8) c>=0.8 c>=0.98 c>=0.99 Potential Fault (c=1) Real Fault
Figure 6.Error distance and geographic detail of chlorine bulk
de-cay fault detection for the link TR00029992A at hour 48.
“TR00029992A” and “TR00029794D”, respectively are shown in Fig. 2. The simulated data are obtained using the methodology presented. Figures 8–10 show the fault detec-tion results obtained at hour 48 for every chlorine bulk decay fault. In these figures, the link with the actual fault is repre-sented with a diamond, and the starred nodes are the poten-tial faulty nodes suggested by the correlation method. The rest of the nodes are divided in grey-scaled areas, depending on the correlation value they have: the most correlated with the fault signature, the darkest the area they are located. The evolution of the error distance through the period of results generation (15 to 24 h) and a detail of the detection for each
1 2 3 4 5 6 7 8 9 10 0
20 40 60 80 100 120
Time [h]
D
is
ta
n
c
e
[
m
]
Error distance
Mean Minimum Maximum
3.265 3.27 3.275 3.28 3.285
x 104 8.305
8.31 8.315 8.32 8.325 8.33
x 104
X coordinate [m]
Y
c
o
o
rd
in
a
te
[
m
]
Fault Isolation, 10 hour data
Nodes Unfaulty (c<0.8) c>=0.8 c>=0.98 c>=0.99 Potential Fault (c=1) Real Fault
Figure 7.Error distance and geographic detail of chlorine bulk
de-cay fault detection for the link TR00029794D at hour 48.
fault are depicted in Figs. 5–7. In the latters, the distance be-tween the potential faulty links (starred in Figs. 5–7) and the actual faulty link (diamonds in Figs. 5–7) is represented. If more than one potential faulty link is obtained at a particular time, minimum, maximum and mean distances among poten-tial faulty links set and actual faulty link are represented. For all cases, a good match between the actual and the identified fault has been achieved.
3.22 3.24 3.26 3.28 3.3 3.32 3.34 3.36 3.38
x 104 8.15
8.2 8.25 8.3 8.35 8.4 8.45x 10
4
X coordinate [m]
Y
c
o
o
rd
in
a
te
[
m
]
Fault Isolation, 10 hour data
Error distance: Min =0m; Average = 0m; Maximum = 0m
Nodes Unfaulty (c<0.8) c>=0.8 c>=0.98 c>=0.99 Potential Fault (c=1) Real Fault
Figure 8.Chlorine bulk decay fault detection in link TR00353608D
at hour 48.
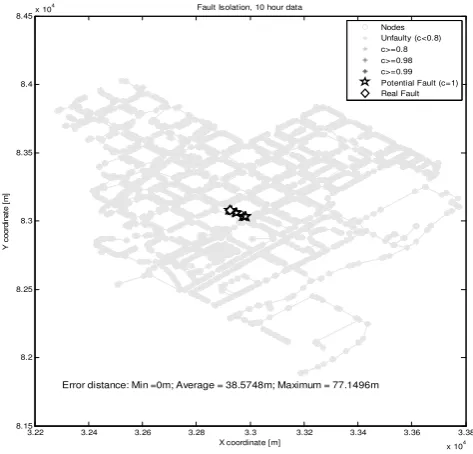
3.22 3.24 3.26 3.28 3.3 3.32 3.34 3.36 3.38 x 10⁴
8.15 8.2 8.25 8.3 8.35 8.4 8.45x 10
4
X coordinate [m]
Y
c
o
o
rd
in
a
te
[
m
]
Fault Isolation, 10 hour data
Error distance: Min =0m; Average = 38.5748m; Maximum = 77.1496m Nodes Unfaulty (c<0.8) c>=0.8 c>=0.98 c>=0.99 Potential Fault (c=1) Real Fault
Figure 9.Chlorine bulk decay fault detection in link TR00029992A
at hour 48.
4 Conclusions
In this work, the problem of detection and localisation of ter quality anomalies has been addressed. The abnormal wa-ter quality localisation method is based on the chlorine mea-surements and chlorine sensitivity analysis of nodes in a wa-ter distribution network. A fault localisation algorithm which correlates on line the residuals (generated by comparing the
3.22 3.24 3.26 3.28 3.3 3.32 3.34 3.36 3.38 x 10⁴ 8.15
8.2 8.25 8.3 8.35 8.4 8.45x 10
4
X coordinate [m]
Y
c
o
o
rd
in
a
te
[
m
]
Fault Isolation, 10 hour data
Error distance: Min =0m; Average = 0m; Maximum = 0m
Nodes Unfaulty (c<0.8) c>=0.8 c>=0.98 c>=0.99 Potential Fault (c=1) Real Fault
Figure 10. Chlorine bulk decay fault detection in link
TR00029794D at hour 48.
available chlorine measurement with their estimation using a model) with the fault sensitivity matrix is used. The pro-posed algorithm has been applied in simulation to a DMA (Nova Ic`aria) in the Barcelona network using EPANET
soft-ware. The effectiveness of the method ensures the ability
for a rapid-response to an abnormal event and, consequently, minimizes exposure risks to water consumers. The solution should help water companies to estimate the presence and the location of a bad chlorine concentration through a simple field data analysis.
Acknowledgements. This work was supported in part by the
project RTNM AM0901 of Alliance, by the European Commission through contract i-Sense (ref. FP7-ICT-2009-6-270428) and the projects DPI2011-26243 (SHERECS) and DPI2009-13744 (WAT-MAN) of the Spanish Ministry of Economy and Competitiveness (MINECO).
Edited by: G. Fu
References
Blanke, M., Kinnaert, M., Lunze, J., and Staroswiecki, M.: Diagno-sis and Fault-tolerant Control, 2nd Edn., Springer, 2006. Gertler, J. J.: Fault Detection and Diagnosis in Engineering
Sys-tems, Marcel Dekker, 1998.
LeChevallier, M. W., Babcock, T. M., and Lee, R. G.: Examination and characterization of distribution system biofilms, Appl. Envi-ron. Microbiol., 53, 2714–2724, 1987.
Lindley, T. R.: A framework to protect water distribution systems against potential intrusions, MS thesis, University of Cincinnati, Cincinnati, 2001.
Sadiq, R., Kleiner, Y., and Rajani, B.: Forensics of water quality failure in distribution system – a conceptual framework, Journal of Indian Water Works Association, 35, 267–278, 2003. P´erez, R., Quevedo, J., Puig, V., Nejjar, F., Cuguer´o, M. A., Sanz,
G., and Mirats, J. M.: Leakage Isolation in Water Distribution Networks: a Comparative Study of Two Methodologies on a Real Case Study, The 19th Mediterranean Conference on Control and Automation, 138–143, Corfu, Greece, 20–23 June 2011. Quevedo, J., Puig, V., Cembrano, G., Blanch, J., Aguilar, J., Saporta,
D., Benito, G., Hedo, M., and Molina, A.: Validation and recon-struction of flow meter data in the Barcelona water distribution network, Control Eng. Pract., 18, 640–651, 2010.
Quevedo, J., Cuguero, M. A., P´erez, R., Nejjari, F., Puig, V., and Mirats, J. M.: Leakage Location in Water Distribution Networks based on Correlation Measurement of Pressure Sensors, 8th IWA Symposium on Systems Analysis and Integrated Assessment, Watermatex 2011, San Sebasti´an, Spain, 20–22 June 2011.