www.drink-water-eng-sci.net/7/73/2014/ doi:10.5194/dwes-7-73-2014
© Author(s) 2014. CC Attribution 3.0 License.
Optimization of coagulation-flocculation parameters
using a photometric dispersion analyser
S. R. Ramphal and M. S. Sibiya
Rand Water, Process Technology Department, Glen Vista, South Africa
Correspondence to: S. R. Ramphal ([email protected])
Received: 30 December 2013 – Published in Drink. Water Eng. Sci. Discuss.: 6 February 2014 Revised: 19 May 2014 – Accepted: 25 June 2014 – Published: 23 July 2014
Abstract. The size and structural characteristics of floc particles are important design and control parameters in water treatment and should be rapidly monitored with a reasonable amount of accuracy. In this study, a pho-tometric dispersion analyser (PDA) coupled to standard jar test experiments was used to optimize coagulation-flocculation parameters while monitoring floc size and structure as well as the rate of floc formation during co-agulation using alum. The optimal coco-agulation conditions were as follows: sample pH 8; alum dosage, 3 mg L−1 as Al3+;Gvalue, 172 s−1; rapid mixing time, 20 s. These conditions resulted in unstable treated water having a calcium carbonate precipitation potential (CCPP) of−15 mg L−1as CaCO3and required a slaked lime dosage of 17 mg L−1as CaCO3to equilibrate CCPP to acceptable levels. PDA data revealed that aggregation rate and steady-state variance are primary parameters as both have substantial influence on coagulation-flocculation ef-ficiency. However, the average steady state ratio, although an important parameter, had a lessened impact on coagulation-flocculation efficiency. The results of this study showed that the PDA instrument is an important tool in coagulation kinetic studies and can be employed as an additional tool in the optimization of coagulation conditions.
1 Introduction
The treatability of a water source, including the determi-nation of optimal conditions for specific parameters (most effective coagulant, dosage rates, pH, velocity gradient and mixing time), is conventionally performed at bench-scale us-ing standard jar test experiments. The performance of these experiments is generally determined through measuring tur-bidity and/or colour removal. Although this method of formance measure can provide sufficient information to per-mit pilot- or full-scale implementation, it does possess inher-ent limitations as it provides no information on floc particle size and structure.
The size distribution of floc particles is an important de-sign and control parameter during coagulation-flocculation (Spicer et al., 1996). In combination with floc particle struc-ture and density, the size distribution of floc particles is of great significance in solid-liquid separation processes such as sedimentation (Selomulya et al., 2001). Floc size and struc-ture are influenced by several operational parameters and
di-rectly impacts floc density which controls solid removal effi-ciency during sedimentation (Spicer and Pratsinis, 1996).
During coagulation-flocculation, both floc particle size and structure undergo transitional phases. Initially, upon co-agulant dosage, there is a period of rapid floc growth in which the size and structure of the floc aggregates are dy-namic in nature. This is followed by a steady- state region or equilibrium between particle growth and fragmentation for a specific period, during which, the floc particle size does not change. The shape of the particle size distribution curve is critical as it influences coagulation-flocculation kinetics, the rate of floc growth, floc characteristics and solid removal processes (Selomulya et al., 2001; Spicer et al., 1996). It is therefore very important to rapidly quantify both size and structure of aggregates to generate a particle size distribu-tion curve with a reasonable amount of accuracy (Selomulya et al., 2001).
Table 1.Raw water characteristics.
Parameter pH Turbidity UV300 Temperature (NTU) (cm−1) (◦C)
Average 7.93 55.57 0.4223 20
they offer an estimation of a wide range of particle sizes in a rapid and non-destructive manner (Selomulya et al., 2001). A photometric dispersion analyser (PDA) has become an im-portant instrument that has been widely used in monitoring coagulation-flocculation kinetics (Mixon et al., 2013; Ball et al., 2011; Staaks et al., 2011; Zoubolis and Tzoupanos, 2009, 2010; Xiao et al., 2009; Huang and Liu, 1996).
A PDA is a fibre-optical monitor which measures the fluc-tuation in the intensity of light transmitted through a flowing suspension (Huang and Liu; 1996). More specifically, it mea-sures the root mean square of the fluctuating signal (Vrms) and the average transmitted light intensity (dc). The ratio of Vrms todc is a valuable tool in coagulation-flocculation studies as it permits quantification of aggregation or dis-aggregation of the suspension to be monitored (Huang and Liu; 1996). This ratio can be derived as follows (Xiao et al., 2009):
Ratio=
L A
1/2 X
NiCi2 1/2
(1)
whereL is the optical path length,Ais the effective cross sectional area of the light beam, Ni is the number and con-centration class of size class iand Ci is particle scattering cross-section of size classi respectively. The ratio values
ob-tained from the PDA is affected only by P
NiCi2
1/2 , and is almost entirely unaffected by contamination of the tube walls in the flow cell and by drift in electrical components (Xiao et al., 2009). This study is an extension of the one presented at the 12th edition of the International Conference on “Comput-ing and Control for the Water Industry – CCWI 2013” (Ram-phal and Sibiya, 2014). Similar to the CCWI 2013 study, this study used a PDA instrument to optimize coagulation condi-tions and monitor floc size and structure as well as the rate of floc formation using alum as a coagulant. Standard jar test experiments were performed concurrently with PDA experi-ments to determine the degree of particle destabilization. In addition, this study applied operational guidelines used at a large water utility in Africa for dosage optimization and as-sessed its impact on floc size and structure as well as the rate of aggregation. Further, the impact of alum dosage on the stability of treated water was also evaluated.
Jar stirrer
Tubing
PDA 2000
Peristaltic pump
Waste
PDA interface Computer
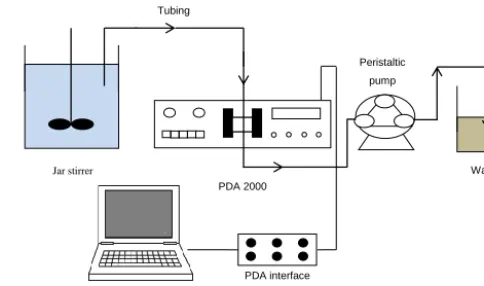
Figure 1.Experimental set up.
2 Methodology
2.1 Jar tests
Jar test experiments were performed on raw water obtained from the Vaal Dam (South Africa) (Table 1). Jar tests were carried out using a variable speed ZR 4–6 Jar tester (Zhon-grun Water Industry Technology Development Co. Ltd, China) fitted with six flat paddle impellors. For each jar test the following procedure was performed: one litre of raw wa-ter was added to each Perspex jar; the pH of samples were adjusted to the relevant pH using either 0.1 M hydrochloric acid or 0.1 M sodium hydroxide; appropriate dosages of alum were dosed into each jar using plastic syringes; various ve-locity gradients were applied to the sample using electroni-cally controlled programmes; upon completion of electron-ically controlled programme samples were left to settle for 15.5 min.
2.2 Instrumentation
2.2.1 Photometric dispersion analyser
Coagulation-flocculation kinetics was determined using the PDA 2000 (Rank Brothers, England). Clear plastic tubing of 3 mm in diameter was used to transport samples from the jar to the fibre optic probes at a flow rate of 22 mL min−1. Sample flow rate was controlled by a peristaltic pump which was placed after the PDA instrument to prevent floc breakage prior to analysis (Fig. 1). To ensure comparison of PDA ex-periments, the direct current (DC) output of source water was maintained at a constant voltage by adjusting the DC gains on the instrument. For all experiments, the limit and filter modes were used as this reduced the effects of large particles and air bubbles and increased the averaging time to obtain smoother output values, respectively. All data was recorded using an ADC-20 data-logger coupled to the Picolog Software.
Mixing intensity
R
atio
valu
e
s
Time
Initial growth phase Steady state region
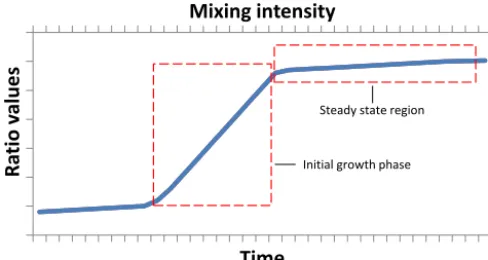
Figure 2.Time dependent ratio curve.
2.2.2 Other instrumentation
A HACH 2100Q turbidimeter and a Cary 50-Conc Varian UV-Vis Spectrophotometer was used to measure turbidity and UV300 values respectively. UV300 was used a measure of non-visible colour and is hereby referred to as colour. The temperature and pH were measured using a Metrohm 692 pH/ion meter. All titrations were performed using a Schott Titronic 96 auto-titrator while the conductivity was measured using a Labotec 197i conductivity meter.
2.3 Analysis of PDA data
The time dependent ratio values collected during each coagulation-flocculation experiment generated a ratio curve of similar pattern (Fig. 2). Figure 2 shows that there are two distinct regions with each indicating the evolution of aggre-gate size with time at various shear rates (Selomulya et al., 2001). In the initial growth region, fluid shear promotes par-ticle collision which results in aggregate growth. As these aggregates grow, breakage becomes a more significant factor as the size range of the aggregate is more susceptible to frag-mentation by turbulent eddies. This results in the attainment of steady-state region. During this phase, due to the attain-ment of a dynamic equilibrium between aggregate growth and aggregate fragmentation, aggregates are of equal size, since ratio values remain constant over time (Hopkins and Ducoste, 2003; Spicer and Pratsinis, 1996; Oles, 1992).
In this study, three calculations were used to analyse the data obtained during the coagulation-flocculation ex-periments. These calculations included the aggregation rate during rapid mixing, time-weighted average steady-state ra-tio and time-weighted steady-state variance as described by Mixon et al. (2013); Staaks et al. (2011); Xiao et al. (2009) and Hopkins and Ducoste (2003). The aggregation rate (AR) during coagulation was calculated by:
AR=Ratioi−Ratio0 timei
(2)
where Ratio0is the initial ratio value att0, timei is the when the PDA output reaches its maximum value of Ratioi. In
accordance to work performed by Staaks et al. (2011), ini-tial calculations determined the aggregation rate of the first minute, first to fifth minute and the entire first five minutes. It was found that the aggregation rate for the first minute yielded the best results; hence, this parameter was used for the rest of the study. The time-weighted average steady-state ratio was determined by:
ratio= N P
i=1
(ratioi×timei) N
P
i=1 timei
(3)
Equation (3) represents the state of aggregation during the steady state period of coagulation-flocculation. The final cal-culation used in this study was the time-weighted steady-state variance, which was also computed using the data from the steady state period during coagulation-flocculation as fol-lows:
variance= N P
i=1
(ratioi−average. . .ratio)2×timei N
P
i=1 timei
(4)
Equation (4) was used as a measure of floc size and struc-tural differences. According to Hopkins and Ducoste (2003), smaller variance is indicative of a tighter floc size distribution and a more homogenous, dense and less porous floc struc-ture.
2.4 Assessment of calcium carbonate precipitation potential
The stability of treated water was determined by measuring the calcium carbonate precipitation potential (CCPP) of spe-cific samples. The CCPP was determined using the Stasoft4© software (version 4) which is a tool for designing, modelling and controlling water treatment processes that involve cal-cium carbonate chemistry. To measure the CCPP, specific water quality parameters, inclusive of temperature, conduc-tivity, dissolved calcium, pH and total alkalinity were deter-mined.
3 Results and discussion
3.1 Optimization of pH
0.00 0.01 0.02 0.03 0.04 0.05
2.00 2.50 3.00 3.50 4.00 4.50 5.00 5.50
6 7 8 9
Re
si
dual
col
our (cm
-1)
Re
si
dual
tur
bi
di
ty
(NT
U
)
pH before dosage
NTU Colour
0 1 2 3 4 5 6 7
5 6 7 8 9
Av
er
age
st
eady
st
at
e
rat
io
pH
0.000 0.002 0.004 0.006 0.008 0.010 0.012 0.014 0.016 0.018
5 6 7 8 9
Rat
io val
ue
s pe
r s
econd
pH
0.00 0.05 0.10 0.15 0.20 0.25
5 6 7 8 9
Vari
ance
pH (a)
(c)
(b)
(d)
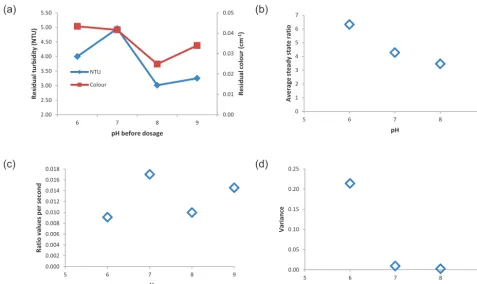
Figure 3.Optimization of pH – (a) residual turbidity and colour; (b) average steady-state ratio; (c) aggregation rate; (d) steady-state variance.
a pH of 6–7. Figure 3a indicates that the lowest residual tur-bidity and colour was observed at an initial sample pH of 8; corresponding to a coagulation pH of 6.29.
The optimal pH also coincided with the minimal solubil-ity of alum, indicating that sweep flocculation is the primary coagulation mechanism through the formation of aluminium hydroxide precipitates (Pernitsky and Edzwald, 2006; Gre-gor et al., 1997). One would expect that the largest floc size would correspond to highest coagulation efficiency; in other words, the largest floc size and floc growth rate should re-sult in the lowest residual turbidity and colour. However, this was not observed as the lowest residual turbidity and colour (Fig. 3a) corresponded to the lowest average steady state ra-tio and aggregara-tion rate (Fig. 3b and c). Further, from Fig. 4b, one can see that at the optimal coagulation pH of 6.29, sweep flocculation should be the primary coagulation mechanism; hence, one can expect the largest floc sizes to form under these conditions. However, from Fig. 3b, a trend of increas-ing ratio values was observed with decreasincreas-ing pH, which according to Fig. 4a should shift the aluminium hydrolysis species to ionic forms. This strongly suggests the presence of interfering contaminants within the source water.
Figure 3d shows that the lowest steady-state variance was obtained at a pH of 8. According to Mixon et al. (2013) and Hopkins and Ducoste (2003), low steady-state variance val-ues indicates the existence of a narrow range of floc sizes and stronger flocs at a particular location. This can be expected as
the coagulation pH corresponds to the minimum solubility, indicating the presence of solid aluminium hydroxide pre-cipitates. In contrast, an initial sample pH of 6 displayed the highest steady-state variance, indicating the occurrence of a wide range of floc sizes and placing further significance on the existence of interfering contaminants within the source water. Although there was a lack of correspondence between residual and PDA data, the residual data provided sufficient evidence to indicate that an initial sample pH of 8 was opti-mal. This sample pH was used for the rest of the study.
3.2 Optimization of dosage
The optimization of alum dosage was performed by adjust-ing sample pH to 8 while varyadjust-ing the alum dosage from 2–12 mg L−1 as Al3+. Figure 5a indicates that an alum dosage of 6 mg L−1 as Al3+ resulted in the lowest residual turbidity and colour. This dosage reduced the pH from 8 to 6.69 which favoured sweep flocculation through the for-mation of aluminium hydroxide precipitates (Srinivasan et al., 1999). Further, the isoelectric point of alum occurs at pH 8 indicating that pH values less than 8 yield positively charged precipitates, which are able to neutralize the neg-atively charged particles in the water sample (Gregory and Duan, 2001).
Figure 4.Distribution of aluminium hydrolysis products; (a) dissolved species; (b) amorphous precipitate (adapted from Pernitsky and Edzwald, 2006).
2
3
4
5
6
8
9
10
11
12
13
Figure 5. Optimization of dosage - (a) Residual turbidity and colour; (b)
Average
steady-state ratio
; (c)
Aggregation rate
; (d)
Steady-state variance
0 0.01 0.02 0.03 0.04 0.05 0.06 0.07
1.00 1.50 2.00 2.50 3.00 3.50 4.00 4.50 5.00 5.50 6.00
2 3 4 6 8 10 12
R
e
si
dual
col
our (cm
-1)
R
e
si
dual
t
ir
bi
di
ty
(NT
U
)
Dosage (mg/l)
NTU Colour
0 1 2 3 4 5 6 7
1 2 3 4 5 6 7 8 9 10 11 12
A
ve
rage
s
te
ady
st
at
e
r
at
io
Dosage (mg/l)
0.000 0.002 0.004 0.006 0.008 0.010 0.012 0.014 0.016 0.018 0.020
1 2 3 4 5 6 7 8 9 10 11 12
R
at
io val
ue
pe
r
se
cond
Dosage (mg/l)
0.00 0.01 0.02 0.03 0.04 0.05 0.06 0.07 0.08 0.09 0.10
1 2 3 4 5 6 7 8 9 10 11 12
V
ari
ance
Dosage (mg/l)
(c) (d)
(a) (b)
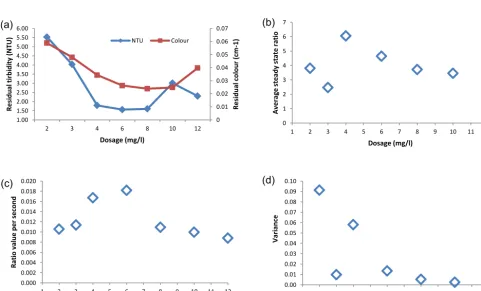
Figure 5.Optimization of dosage – (a) residual turbidity and colour; (b) average steady-state ratio; (c) aggregation rate; (d) steady-state variance.
0.000 0.020 0.040 0.060 0.080 0.100 0.120
0 2 4 6 8 10 12 14 16 18
37 65 115 147 172 214
Re
si
dual
col
our (cm
-1)
Re
si
dual
tur
bi
di
ty
(NT
U
)
Velocity gradient (s-1) Turbidity UV300
37 65 115 147 172 214 0
1 2 3 4 5 6
Av
er
age
st
eady
st
at
e
rat
io
Velocity gradient (s-1)
37 65 115 147 172 214 0.000
0.002 0.004 0.006 0.008 0.010 0.012
Rat
io per
se
cond
Velocity gradient (s-1)
37 65 115 147 172 214 0.0
0.1 0.2 0.3 0.4 0.5 0.6 0.7 0.8 0.9 1.0
Vari
ance
Velocity gradient (s-1)
(a)
(c)
(b)
(d)
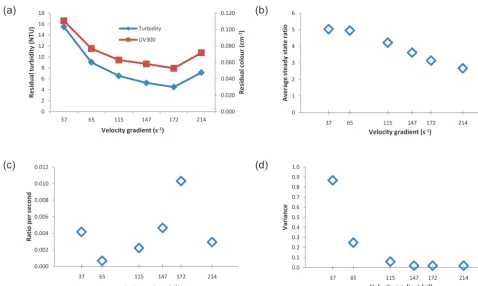
Figure 6.Optimization of velocity gradient – (a) residual turbidity and colour; (b) Average steady-state ratio; (c) aggregation rate; (d) steady-state variance.
Figure 5b shows that the largest average steady-state ra-tios were obtained for alum dosages of 4 and 6 mg L−1as Al3+. Although an alum dosage of 6 mg L−1as Al3+did not represent the largest average steady-state ratio value, it dis-played the highest efficiency in terms of turbidity and colour removal. This indicates that floc size, although important in coagulation-flocculation processes, is not the most impor-tant parameter. Figure 5c and d show that an alum dosage of 6 mg L−1 as Al3+ displayed a higher aggregation rate and lower steady-state variance to that of 4 mg L−1as Al3+ dosage. This indicates that an alum dosage of 6 mg L−1as Al3+resulted in a higher floc growth rate and that the flocs size displayed greater degree of strength and floc size homo-geneity. Based on these results, it is possible that these two parameters contributed to the enhanced performance of the 6 mg L−1as Al3+alum dosage and may possibly be primary parameters for consideration in coagulation-flocculation ki-netic studies.
However, at a large water utility in Africa, to reduce chem-ical costs, an operational guideline using the lowest coagu-lant dosage which yielded a post-sedimentation turbidity of less than 5 NTU is applied. Under these circumstances, an alum dosage of 3 mg L−1of Al3+was optimal. This dosage displayed inferior PDA data to that of the 6 mg L−1as Al3+ dosage as it presented the lowest average-steady ratio and ag-gregation rate values signifying the presence of smaller floc
particles formed at moderate rate. However, it did exhibit a lower steady-state variance value, indicating that floc particle sizes were more homogenous, denser and less porous in na-ture. A dosage of 3 mg L−1of Al3+was used for subsequent experiments.
3.3 Optimization of velocity gradient
In this experiment, the rapid mixing intensity was varied while applying the optimal alum dosage of 3 mg L−1as Al3+ and initial sample pH of 8. Figure 6a shows that the lowest residual turbidity and colour was obtained during application of aGvalue of 172 s−1. At this velocity gradient, an opti-mal level of energy was dissipated which warranted efficient coagulation through the instantaneous and even distribution of alum (Degremont, 2007). It may seem appropriate to use highGvalues during rapid mixing to maximise efficient use of a coagulant; however, each application has an upper limit (Bratby, 2006). OnceGvalues exceed this limit, there is a delay in floc formation and size.
This trend can be observed in Fig. 6b and c in which the average steady state ratio and aggregation rate peaked at a specificG value; with further increases inGvalues result-ing in lower values. This occurred as higher energy dissipa-tion increases the shear rate and the number of particle colli-sions; hence, increasing the rate of floc break-up (Selomulya
0 0.02 0.04 0.06 0.08 0.1
4 5 6 7 8 9 10
5 10 15 20 25 30 40
Re
si
dual
tur
bi
di
ty
(NT
U
)
Rapid mixing time (s) NTU
UV300
5 10 15 20 25 30 40
2.20 2.30 2.40 2.50 2.60 2.70 2.80 2.90 3.00 3.10
Av
er
age
st
eady
st
at
e
rat
io
Rapid mixing time (s)
5 10 15 20 25 30 40
0 0.001 0.002 0.003 0.004 0.005 0.006 0.007 0.008 0.009
Rat
io per
se
cond
Rapid mixing time (s)
5 10 15 20 25 30 40
0.010 0.011 0.012 0.013 0.014 0.015 0.016 0.017 0.018 0.019 0.020
Vari
ance
Rapid mixing time (s) (a)
(c)
(b)
(d)
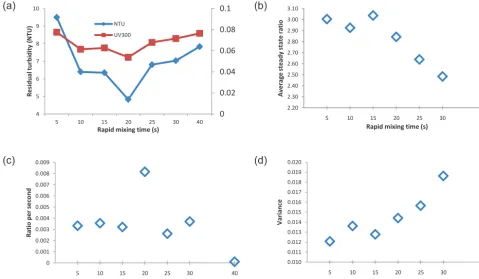
Figure 7.Optimization of rapid mixing time – (a) residual turbidity and colour; (b) average steady-state ratio; (c) aggregation rate; (d) steady-state variance.
et al., 2001). This resulted in the formation of smaller; denser and less porous aggregates which are structurally tolerant to higher shear forces, leading to a lower steady state mean floc size attained in a shorter period of time (Hopkins and Ducoste, 2003; Spicer and Pratsinis, 2001, Oles, 1992). This trend has been observed by various researchers (Hopkins and Ducoste, 2003; Selomulya et al., 2001; Spicer and Pratsinis, 1996).
Figure 6d shows that the steady-state variance was sub-stantially higher at lower velocity gradients (≤115 s−1). Mixon et al. (2013) and Hopkins and Ducoste (2003) ex-plained that high steady-state variance at lowerGvalues was due to larger aggregates being sheared due to settling into the impellor region. Further, in this study, it was observed that as the Gvalue increased, the steady-state variance de-creased. This indicates that at higher shear rates, the forma-tion of a more homogenous floc suspension was favoured (Mixon et al., 2013). As observed in prior experiments, the largest average steady-state ratio obtained at a velocity gradi-ent of 37 s−1did not result in the highest efficiency in terms of turbidity and colour removal. Rather, a velocity gradient of 172 s−1 displayed the highest efficiency as it exhibited the highest aggregation rate and lowest steady-state variance when compared to other velocity gradients. A velocity gradi-ent of 172 s−1was used for the rest of the study.
3.4 Optimization of rapid mixing time
For this phase of the study, rapid mixing time was varied while applying the optimal alum dosage of 3 mg L−1as Al3+, sample pH of 8 and aGvalue 172 s−1. Figure 7a shows that the lowest residual turbidity and colour was obtained when a rapid mixing time of 20 s was applied. This signifies that a velocity gradient of 172 s−1was applied for an optimal pe-riod to ensure efficient coagulation through the instantaneous and even distribution of alum.
Similar to rapid mixing intensity, it may be desirable to apply an optimal velocity gradient for an extended period of time to maximise efficient use of coagulants. However, according to Bratby (2006), extended periods of rapid mix-ing may give rise to deleterious effects in the coagulation-flocculation process. As such, each application will have an optimal rapid mixing time which is dependent on the rapid mixing intensity and coagulant concentration. The negative effect of prolonged rapid mixing time can be seen in Fig. 7a as higher residual turbidity and colour values were obtained during longer rapid mixing times.
80 S. R. Ramphal and M. S. Sibiya: Optimization of coagulation-flocculation parameters
24 -40
-35 -30 -25 -20 -15 -10 -5 0
0 1 2 3 4 5 6 8 10 12
CCPP
(m
g/
l as
CaCO
3
)
Alum dosage (mg/l)
(c) (d)
Figure 8.Impact of alum dosage on CCPP of treated water.
Selomulya et al. (2001) explained that higher circulation times reduces the time aggregates have to form larger sizes due to high shear stress, hence, a decrease in average steady-state ratio was observed.
In line with observations from previous experiments, the highest average steady-state ratio value, obtained from a rapid mixing time of 15 s, did not result in the highest coagulation-flocculation performance in terms of turbidity and colour removal. Rather, a rapid mixing time of 20 s dis-played the highest removal efficiency. PDA data represented in Fig. 7c and d indicate that a rapid mixing time of 20 s pro-duced a higher aggregation rate and lower steady-state vari-ance than that of 15 s. This places further significvari-ance on the importance of the aggregation rate and steady-state variance in coagulation-flocculation studies. A rapid mixing time of 20 s was used for subsequent experiments.
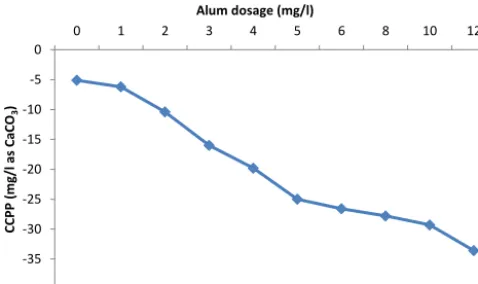
3.5 Impact of alum dosage on CCPP
The impact of alum dosage on CCPP was investigated at an alum dosage range of 2–4 mg L−1 as Al3+, sample pH of 8; Gvalue of 172 s−1 and rapid mixing time of 20 s. Fig-ure 8 shows that the CCPP of treated water decreased with increasing alum dosage. To ensure stability of treated water, the production specification for CCPP at a large water util-ity is−2 to+3 mg L−1as CaCO3. However, Fig. 9 indicates that at an alum dosage range of 2–4 mg L−1 as Al3+ and a sample pH of 8, the coagulation, flocculation and sedimenta-tion process reduces the CCPP to−10.4 to−19.8 as mg L−1 as CaCO3, respectively. These values demonstrate the corro-sive nature of treated water and a high probability of damage to infrastructure occurring. As a result, it is imperative that water treated with alum is stabilized using appropriate pro-cesses.
Lime is used widely during potable water treatment as a coagulant, to adjust coagulation pH or for stabilization of treated water. As a result, this study used slaked lime to equilibrate the CCPP of treated water. Figure 9 illustrates that three experiments were performed to optimise the slaked
-30 -20 -10 0 10 20 30 40 50
2 3 4
CCPP
(m
g/
l as
CaCO
3
)
Alum dosage (mg/l)
After settling Experiment 1 Experiment 2 Experiment 3
Target range
Figure 9.Equilibration of CCPP.
lime dosage required to increase the CCPP of treated water to+3.0 mg L−1as CaCO3. Experiment 3 demonstrates that for alum dosages of 2, 3 and 4 mg L−1as Al3+, the CCPP was adjusted to 3, 2.5 and 2.9 mg L−1 as CaCO3, respec-tively. This corresponded to slaked lime dosages of 13, 17 and 23 mg L−1for alum dosages of 2, 3 and 4 mg L−1, re-spectively.
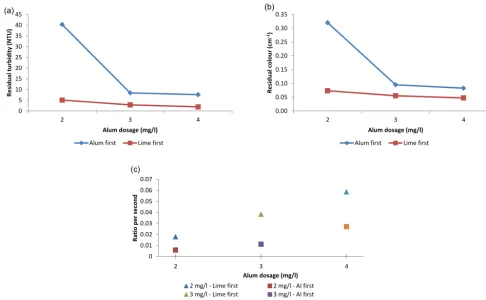
3.6 Impact of dosage sequence
This experiment was performed to assess the effect of dos-ing slaked lime on water quality durdos-ing coagulation, as well as the sequence of chemical dosage on the turbidity of set-tled water. It should be reiterated that slaked lime was used primarily for pH/CCPP adjustment in this study. Two exper-imental scenarios were performed:
1. Alum dosed first, followed by slaked lime
2. Slaked lime dosed first, followed by alum
Figure 10a and b show that lower residual turbidity and colour levels were obtained when slaked lime was dosed before alum. Additionally, one should note that under both experimental scenarios, both turbidity and colour removals were enhanced at higher slaked lime dosages. As such, it ap-pears that slaked lime functions as a coagulant chemical in addition to a pH adjustment chemical.
To gain further understanding on the coagulation-flocculation kinetics, samples from both experimental sce-narios were passed through the PDA monitor. When alum was dosed first, the ratio output values were very low and did not produce a ratio profile as shown in Fig. 2. As a result, the root mean square (RMS) gain on the instrument was ad-justed accordingly to amplify the signal. These instrumental settings were kept constant for both experimental scenarios to allow for data comparison. However, in the case of ex-perimental scenario two (lime addition first); the amplified instrumental settings resulted in a ratio overload during the steady-state growth region. A ratio overload occurs when the
0 5 10 15 20 25 30 35 40 45
2 3 4
R
e
si
d
u
al
t
u
rb
id
ity (N
TU
)
Alum dosage (mg/l)
Alum first Lime first
2 3 4
0 0.01 0.02 0.03 0.04 0.05 0.06 0.07
R
atio
p
e
r
sec
o
n
d
Alum dosage (mg/l)
2 mg/l - Lime first 2 mg/l - Al first 3 mg/l - Lime first 3 mg/l - Al first 4 mg/l - Lime first 4 mg/l - Al first
0.00 0.05 0.10 0.15 0.20 0.25 0.30 0.35
2 3 4
R
e
si
d
u
al
c
o
lo
u
r
(c
m
-1)
Alum dosage (mg/l)
Alum first Lime first
(a) (b)
(c)
Figure 10.Impact of dosage sequence; (a) residual turbidity; (b) residual colour; (c) aggregation rate.
RMS output is greater than the DC output and can be cor-rected by reducing the RMS gain. However, this was not pos-sible as any decrease in the RMS gain would have resulted in a loss of the ratio profile of experimental scenario one (alum addition first). As a consequence, this prevented the compar-ison of PDA data obtained during the steady-state, namely the average steady-state ratio and the steady-state variance. However, it did permit the comparison of the aggregation rates, as during this time the RMS output was less than DC output; hence, the ratio overload signal was not activated.
Figure 10c indicates that the addition of lime first resulted in a higher aggregation rate at the dosage levels investigated. These superior aggregation rates may have been contributing factors to the improved coagulation-flocculation efficiency of adding slaked lime first as shown by the lower residual tur-bidity and colour levels in Fig. 10a and b.
4 Conclusions
This study used a PDA to optimize coagulation conditions and monitor floc size and structure as well as floc growth rate during coagulation-flocculation using alum. The results of this study indicate that optimal coagulation-flocculation conditions were as follows: sample pH of 8, alum dosage of 3 mg L−1 as Al3+, rapid mixing intensity of 172 s−1 and rapid mixing time of 20 s. Additional PDA parameters,
namely, the aggregation rate, average steady-state ratio and steady-state variance were generated using PDA ratio data to gain further understanding of the coagulation-flocculation process.
Acknowledgements. The authors would like to express gratitude towards both the Experimental Facility at the Process Technology Department as well as the Analytical Services Department at Rand Water for their role in this project.
Edited by: S. Meniconi
References
Ball, T., Carriere, A., and Barbeau, B.: Comparison of two online flocculation monitoring techniques for predicting turbidity re-moval by granular media filtration, Environ. Technol., 32, 1095– 1105, 2011.
Bratby, J.: Coagulation and flocculation in water and wastewater treatment, 2nd Edn., IWA Publishing, London, United Kingdom, 2006.
Degremont: Water treatment handbook, 7th Edn., Lavoisier SAS, France, 2007.
Gregor, J. E., Nokes, C. J., and Fenton, E.: Optimizing natural or-ganic matter removal from low turbidity waters by controlled pH adjustment of aluminium coagulation, Water Res., 31, 2949– 2958, 1997.
Gregory, J. and Duan, J.: Coagulation by hydrolyzing metal salts, Pure Appl. Chem., 73, 2017–2026, 2001.
Hopkins, D. C. and Ducoste, J. J.: Characterizing flocculation under heterogeneous turbulence, J. Colloid Interf. Sci., 264, 184–194, 2003.
Huang, C. and Liu, C.: Automatic control for chemical dosing in laboratory scale coagulation process by using an optical monitor, Water Res., 30, 1924–1929, 1996.
Mixon, M., Staak, C., Fabris, R., Vimonses, V., Chow, C. W. K., Panglisch, S., van Leeuwen, J., and Drikas, M.: The impact of optimized coagulation on fouling for coagulation/ultrafiltration process, Desalin. Water Treat., 51, 2718–2725, 2013.
Oles, V.: Shear induced aggregation and break up of polystyrene latex particles, J. Colloid Interf. Sci., 154, 351–358, 1992.
Pernitsky, D. J. and Edzwald, J. K.: Selection of alum and polyalu-minium coagulants: principles and applications, J. Water Supply Res. T., 55, 121–141, 2006.
Ramphal, S. and Sibiya, S. M.: Optimization of time requirement for rapid mixing during coagulation using a photometric disper-sion analyzer, Proc., 12th Int. Conf. on “Computing and Control for the Water Industry – CCWI2013”, Perugia, Elsevier, Proc. Engin., 70, 1401–1410, 2014.
Selomulya, C., Amal, R., Bushell, G., and Waite, T. D.: Evidence of shear rate dependence on restructuring and breakup of latex aggregates, J. Colloid Interf. Sci., 236, 67–77, 2001.
Spicer, P. T. and Pratsinis, S. E.: Shear induced flocculation: The Evolution of Floc Structure and Size Distribution during Shear-Induced Flocculation, Water Res, 30, 1049–1056, 1996. Spicer, P. T., Pratsinis, S. E., and Trennepohl, M. D.: Coagulation
and fragmentation: The variation of shear rate and the time lag for attainment of steady state, Ind. Eng. Chem. Res., 35, 3074– 3080, 1996.
Srinivasan, P. T., Viraraghavan, T., and Subramanian, K. S.: Alu-minium in drinking water: An overview, Water SA, 25, 47–55, 1999.
Staaks, C., Fabris, R., Lowe, T., Chow, C. W. K., van Leeuwen, J. A., and Drikas, M.: Coagulation assessment and optimization with a photometric dispersion analyzer and organic characteriza-tion for natural organic matter removal performance, Chem. Eng. J., 168, 629–634, 2011.
Xiao, F., Huang, J. C. H., Zhang B. J., and Cui, C. W.: Effects of low temperature on coagulation kinetics and floc surface morphology using alum, Desalination, 237, 201–213, 2009.
Zoubolis, A. I. and Tzoupanos, N. D.: Polyaluminium silicate chlo-ride – A systematic study for the preparation and application of an efficient coagulant for water and wastewater treatment, J. Haz-ard. Mater., 162, 1379–1389, 2009.
Zoubolis, A. I. and Tzoupanos, N. D.: Alternative cost-effective preparation methods of polyaluminium chloride (PAC) coagula-tion agent: Characterizacoagula-tion and comparative applicacoagula-tion for wa-ter/wastewater, Desalination, 250, 339–344, 2010.