R E S E A R C H
Open Access
Effect of reduced energy density of close-up diets
on dry matter intake, lactation performance and
energy balance in multiparous Holstein cows
Wenming Huang
†, Yujia Tian
†, Yajing Wang, Aminamu Simayi, Amingguli Yasheng, Zhaohai Wu, Shengli Li
*and Zhijun Cao
*Abstract
Energy intake prepartum is critically important to health, milk performance, and profitability of dairy cows. The objective of this study was to determine the effect of reduced energy density of close-up diets on dry matter intake (DMI), lactation performance and energy balance (EB) in multiparous Holstein cows which were housed in a free-stall barn and fed for ad libitum intake. Thirty-nine dry cows were blocked and assigned randomly to three groups fed a high energy density diet [HD, n = 13; 6.8 MJ of net energy for lactation (NEL)/kg; 14.0% crude protein
(CP) ], or a middle energy density diet (MD, n = 13; 6.2 MJ NEL/kg; 14.0% CP), or a low energy density diet (LD,
n = 13; 5.4 MJ NEL/kg; 14.0% CP) from d 21 before expected day of calving. After parturition, all cows were fed
the same lactation diet to d 70 in milk (DIM). The DMI and NELintake prepartum were decreased by the reduced
energy density diets (P< 0.05). The LD group consumed 1.3 kg/d (DM) more diet compared with HD group in the last 24 h before calving. The milk yield and the postpartum DMI were increased by the reduced energy density diet prepartum (P< 0.05). The changes in BCS and BW prepartum and postpartum were not affected by prepartum diets. HD group had higher milk fat content and lower lactose content compared with LD group during the first 3 wk of lactation (P< 0.05). The energy consumption for HD, MD and LD groups were 149.8%, 126.2% and 101.1% of their calculated energy requirements prepartum (P< 0.05), and 72.7%, 73.1% and 75.2% during the first 4 wk postpartum, respectively. In conclusion, the low energy density prepartum diet was effective in controlling NELintake prepartum,
and was beneficial in increasing DMI and milk yield, and alleviating negative EB postpartum.
Keywords:Dietary energy density, Dry matter intake, Energy balance, Lactation performance, Transition cow
Introduction
The transition period is the most challenging time in the production cycle of dairy cows because of depressed dry matter intake (DMI) and marked changes in metabolism that support late gestation, parturition and the onset of milk synthesis. The abrupt increase in energy demands after parturition results in a negative energy balance (NEB) which can be met by mobilization of body fat reserves and by a decrease in insulin-dependent glu-cose utilization in non-mammary tissues [1]. Extensive mobilization of body fat reserves is associated with metabolic disorders such as fatty liver and ketosis.
DMI rather than milk yield is the major driver of NEB [2]. Therefore, nutritional management during the transition period designed to increase postpartum DMI might be a potential strategy to alleviate the nega-tive effect of NEB on performance as well as related metabolic disorders.
Approximately 3 wk before parturition, DMI starts to decline and further reduces dramatically in the last week before parturition [3-5]. On the other hand, in the last month of pregnancy the energy requirement of the dairy cow increases by about 20% to support gravid uterus growth [6]. As DMI decline in late gestation is practic-ally unavoidable, increasing the energy density of the close-up dry period diet should help to maintain energy intake [7]. NRC (2001) recommended an approximately 5.2 MJ NEL/kg of DM diet for far-off dry period cows,
* Correspondence:[email protected];[email protected]
†Equal contributors
State Key Laboratory of Animal Nutrition, College of Animal Science and Technology, China Agricultural University, Beijing 100193, China
and a 6.4 to 6.8 MJ NEL/kg of DM diet for close-up cows, so as to allow the rumen and its microbes to adapt to the freshly calved diet [8]. Some researchers have suggested that prepartum DMI was positively correlated with postpartum DMI and prepartum DMI should be maximized to improve postpartum performance and health [4,9]. In contrast to this viewpoint, most of the last decade’s research has shown that over consumption of energy prepartum often resulted in a slower increase in DMI postpartum compared with cows on a restricted intake [5,10,11] or fed on a low energy density diet containing wheat straw [11,12] and this was detrimental to cow health and liver function postpartum [11,13,14]. Lower DMI postpartum intensifies NEB and the mo-bilization of body fat results in more triacylglycerol and ketone deposition in the liver. Fatty liver has been linked to an increased incidence of metabolic disorders and poor milk yield [15]. Most of the above studies used moderate or high energy density diets with re-stricted DMI to control energy intake or cows were housed in a tie-stall barn, and the cows may be in a hungry condition and eager to consume more. These experimental results do not reflect the true energy in-take and metabolism of transition cows housed in a free-stall barn on commercial farms, however, because transition cows normally have bunk space with free ac-cess to feed and water. Further study is needed to ad-dress this issue which is critical for dairy management.
It is very common to use moderate or even high en-ergy density transition diets in Chinese dairy farms and the incidence of metabolic diseases is sometimes very high. However, China is short of high quality forage and abundant in low quality forage (Leymus chinensis hay, corn stover and wheat straw). Our hypothesis was that: low energy density diets containing more Leymus chinensis hay could control energy intake prepartum, having the same or better effect on EB postpartum com-pared to high energy density diets with restricted DMI. The objective of this study was to determine a suitable close-up dietary energy density for multiparous Holstein cows with ad libitum access to feed and housed in a free-stall barn.
Materials and methods Animals and design
Animal care and use were approved and conducted in accordance with the practices outlined in the Guide for the Care and Use of Agriculture Animals in Agriculture Research and Teaching [16]. Thirty-nine New Zealand multiparous Holstein cows (average contents of milk fat, protein, and lactose were 5.49 ± 0.99%, 3.59 ± 0.38% and 4.98 ± 0.29%, respectively) were enrolled in the study. Cows were dried off at 60 d and moved into an experi-mental barn 35 d before expected parturition which has
48 free stalls with length × width = 230 cm × 110 cm, and the feed bunk space was 110 cm. The stocking density was about 81% (39 cows/48 free stalls). Cows were grouped according to milk production in the first 3 mo of the previous parity, body weight (BW), body condition score (BCS) and expected calving date and assigned randomly into 1 of 3 dietary treatments. All cows were enrolled in experiment at the same time. The average date before expected parturition for the 3 groups were 21.4 ± 2.5 d, 21.2 ± 2.7 d, and 21.1 ± 2.5 d when the experiment was started. The experiment was conducted from November, 2012 to February, 2013, and the average temperature and humidity during the prepartum and postpartum phases were −3.7 ± 6.3°C, −7.4 ± 4.9°C, and 46.3 ± 7.2%, 43.6 ± 6.3%, respectively.
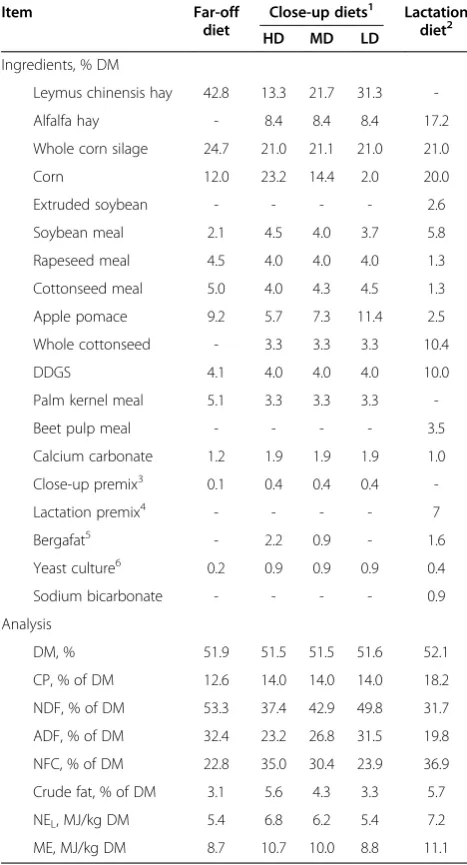
From dry off to d 22 before expected parturition, all cows were fed the same far-off dry period diet (NEL5.4 MJ/kg; Table 1). From d 21 before expected day of calving until parturition, cows were blocked and assigned randomly to three groups fed a high energy density diet [HD treatment, n = 13; 6.8 MJ of net en-ergy for lactation (NEL)/kg; 14.0% crude protein (CP)], or a middle energy density diet (MD treatment, n = 13; 6.2 MJ NEL/kg; 14.0% CP), or a low energy density diet (LD treatment, n = 13; 5.4 MJ NEL/kg; 14.0% CP; Table 1). The Leymus chinensis hay was the first batch of materials loaded into TMR mixer and being chopped into small particles, and then mixed with corn silage and concentrate. Different amounts of water were added to each of the three diets to adjust DM content within 51%-52%. After parturition, all the cows were provided with the same lactation diet to 70 DIM (Table 1).
Cows were housed in a free-stall barn with delivery room, and were fed the diets as a TMR ad libitum throughout the experiment, which was offered once (at 1600 h) daily prepartum and twice (at 0730 and 1430 h) postpartum. Orts were controlled less than 8%. Cows were milked 3 times daily (at 0070, 1400, and 2030 h) in a double-48 parallel milking parlor.
particle size distribution of diets and orts were compared to determine if sorting occurred (≥15 percentage unit change on the19-mm screen) [18, 19].
BW was measured at d −21, −14, −7 d relative to ex-pected parturition and at 1, 7, 14, 21, 28, 35 DIM
(WOW, XR3000, Tru-Test, New Zealand). Dry cows were weighed at 1430 h, and lactating cows were also weighed at 1430 h after milking and before diets deliver. BCS was assessed independently by two individuals on a 1 to 5 scale [20].
Cows were milked three times daily, and individual milk production except colostrum was recorded at each milking (Bou-Matic, United States). The quantity of milk was adjusted to an equal energy basis using the formula: four-percent FCM yield = (0.4 × milk yield) + [15 × (% fat/100) × milk yield]. Milk samples were obtained using milk meters at the afternoon milking on 7, 14, 21, 28, 35 and 42 DIM. Milk components (protein, fat, lactose) were determined at Beijing Dairy Cattle Center using a near-infrared reflectance spectroscopy analyzer (Seris300 CombiFOSS; Foss Electric, Hillerød, Denmark).
Energy balance (EB) was calculated individually for each cow according to NRC (2001) [8]. All equations used units of megajoules per kilogram. NEL intake (NEI) was determined by multiplying DMI by the mean NELdensity of the diet. Net energy required for main-tenance (NEM) was calculated as BW0.75× 0.08 × 120% prepartum and BW0.75× 0.08 × 110% postpartum. Net energy required for pregnancy (NEP) was calculated as [(0.00318 × day of gestation – 0.0352) × (calf birth weight/45)]/ 0.218. Net energy required for lactation (NEL) was calculated as (0.0929 × fat% + 0.0563 × pro-tein% + 0.0395 × lactose%) × milk. The equation used to calculate prepartum EB was EBPRE = NEI– (NEM+ NEP). The equation used to calculate postpartum EB was EBPOST = NEI–(NEM+ NEL).
Statistical analysis
Five cows did not complete the study: 1 cow had a dead fetus, 3 cows had mastitis and 1 cow had a displaced abomasum. Thus, 34 cows (HD, n = 11; MD, n = 11; LD, n = 12) completed the experiment and were used in the analysis.
Individual daily DMI, NEI, NDF intake and milk yield values were condensed to weekly means before analysis; the yields and contents of milk fat, protein, lactose and EB were calculated using the weekly mean. To avoid problems with fitting covariance structure, data for DMI, NEI, NDF intake, and EB were analyzed separately for the prepartum and postpartum periods. The DMI, NEI, NDF intake, milk yield, milk components and EB were evaluated using the MIXED procedure of SPSS 16.0 (SPSS Inc.) for repeated measures with the following model: Yikn=μ+ Wi+ Tk+ WTik+ C(ik)n, where Yikn= an observation from the ith week relative to calving, kth treatment, and nthcow;μ= the grand mean; Wi= effect of the ithweek; Tk= effect of the kthtreatment; WTik= effect of the week by treatment interaction; and C(ik)n= random experimental error from the nth cow nested Table 1 Composition and analysis of diets fed to Holstein
cows during the dry and lactating periods
Item Far-off
diet
Close-up diets1 Lactation
diet2 HD MD LD
Ingredients, % DM
Leymus chinensis hay 42.8 13.3 21.7 31.3
-Alfalfa hay - 8.4 8.4 8.4 17.2
Whole corn silage 24.7 21.0 21.1 21.0 21.0
Corn 12.0 23.2 14.4 2.0 20.0
Extruded soybean - - - - 2.6
Soybean meal 2.1 4.5 4.0 3.7 5.8
Rapeseed meal 4.5 4.0 4.0 4.0 1.3
Cottonseed meal 5.0 4.0 4.3 4.5 1.3
Apple pomace 9.2 5.7 7.3 11.4 2.5
Whole cottonseed - 3.3 3.3 3.3 10.4
DDGS 4.1 4.0 4.0 4.0 10.0
Palm kernel meal 5.1 3.3 3.3 3.3
-Beet pulp meal - - - - 3.5
Calcium carbonate 1.2 1.9 1.9 1.9 1.0
Close-up premix3 0.1 0.4 0.4 0.4
-Lactation premix4 - - - - 7
Bergafat5 - 2.2 0.9 - 1.6
Yeast culture6 0.2 0.9 0.9 0.9 0.4
Sodium bicarbonate - - - - 0.9
Analysis
DM, % 51.9 51.5 51.5 51.6 52.1
CP, % of DM 12.6 14.0 14.0 14.0 18.2
NDF, % of DM 53.3 37.4 42.9 49.8 31.7
ADF, % of DM 32.4 23.2 26.8 31.5 19.8
NFC, % of DM 22.8 35.0 30.4 23.9 36.9
Crude fat, % of DM 3.1 5.6 4.3 3.3 5.7
NEL, MJ/kg DM 5.4 6.8 6.2 5.4 7.2
ME, MJ/kg DM 8.7 10.7 10.0 8.8 11.1
1
HDhigh energy density diet,MDmiddle energy density diet,LDlow energy density diet.
2
Lactation diet was fed to cows from parturition to 70 d in milk. 3
Close-up premix contained (per kg of premix; DM basis): 2,200,000 IU of vitamin A, 550,000 IU of vitamin D3, 20,000 IU of vitamin E, 2,000 mg of vitamin PP, 3,750 mg Cu, 5,720 mg Mn, 14,850 mg Zn, 150 mg I, 180 mg Se, 120 mg Co.
4
Lactation premix contained (per kg of premix; DM basis): 1,000,000 IU of vitamin A, 280,000 IU of vitamin D3, 10,000 IU of vitamin E, 1,000 mg of vitamin PP, 3,250 mg Cu, 4,800 mg Mn, 12,850 mg Zn, 140 mg I, 150 mg Se, 110 mg Co.
5
Fractionated palm fatty acids (Berg + Schmidt, Hamburg, Germany). 6
within the ith week and kth treatment. Repeated state-ment was used for variables measured over time. Covari-ance structures including autoregressive (1), compound symmetry, and unstructured were tested. Autoregressive (1) yielded the lowest Akaike’s criterion and was finally used in our model. DMI, NEI and NDF intake for−48 h to 48 h, BW, BCS, and weekly EB were evaluated by One-Way ANOVA procedure of SPSS 16.0 (SPSS Inc.). Least squares means were computed and are presented throughout. A value of P< 0.05 was set as the signifi-cance level.
Results DMI and NEI
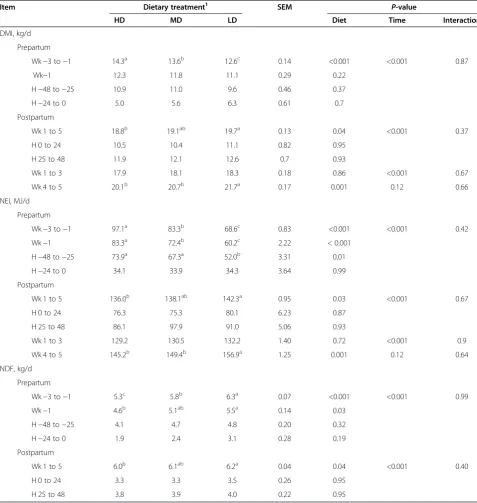
The total average DMI and NEI prepartum were de-creased by the reduced energy density diets (P< 0.05; Table 2). During the last week before parturition, the DMI of the 3 groups was not affected (P= 0.22) and all declined markedly, but the NEI for LD group was lower than that of HD and MD groups (P< 0.05). Although HD group was fed a high energy density diet, the DMI (P= 0.70) and NEI (P= 0.99) were not affected in the last 24 h before parturition. The average NDF intake was in-creased by the reduced energy density diets during the whole close-up period and the last week before partur-ition (P< 0.05). The total average DMI and NEI of LD group were higher than that of HD group (P< 0.05) dur-ing the first 5 wk of lactation, and higher in LD group compared with HD and MD groups from 4 to 5 wk of lactation (P< 0.05).
BCS and BW
Pretrial BCS and BW were not different among dietary treatment groups (Table 3;P> 0.05). The change in BCS and BW prepartum showed no significant differences among the 3 treatments (P> 0.05). Although all the 3 treatments gained BW prepartum, the MD group had no change in BCS and LD group lost a little BCS. The loss of BCS (P= 0.71) and BW (P= 0.55) for LD group was numerically lower than HD and MD groups during the first 5 wk of lactation.
Milk yield and composition
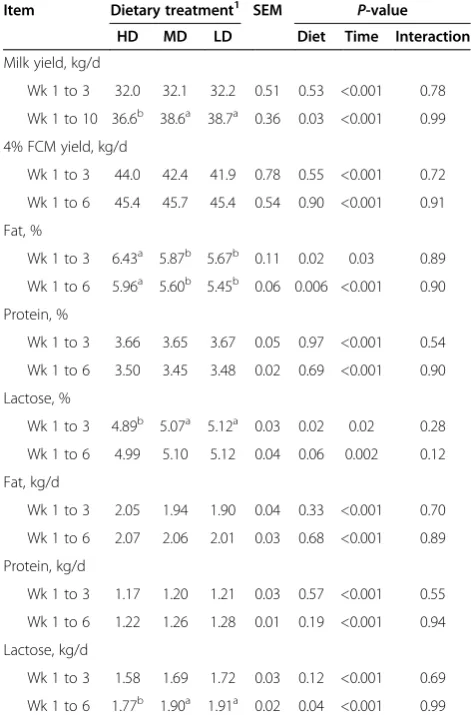
The average milk yield for MD and LD groups was higher than HD group during the first 10 wk (Table 4;
P< 0.05). The 4% FCM yield for LD group was 2.1 kg/d less than HD group during the first 3 wk (P> 0.05), and was similar among the 3 groups during the first 6 wk (P> 0.05). The milk fat content of HD group was higher than MD and LD groups during the first 3 wk and first 6 wk (P< 0.05), and milk lactose content dur-ing the first 3 wk and milk lactose yield durdur-ing the first 6 wk were lower than these 2 treatments (P< 0.05). Energy density of the diets demonstrated no effect on
milk protein content, milk fat yield and protein yield during the experiment (P> 0.05).
Energy balance
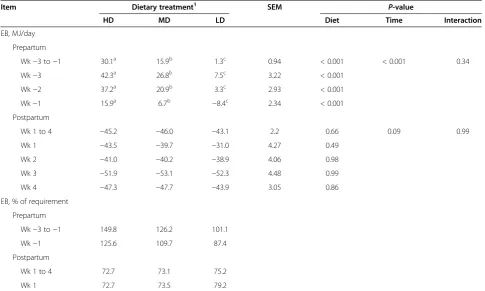
In the close-up dry period, there was significant differ-ence among the 3 treatments in EB (Table 5;P< 0.001). HD, MD and LD groups consumed 30.1, 15.9 and 1.3 MJ/d more than the prepartum NELrequirement, re-spectively; and achieved 149.8%, 126.2% and 101.1% of their calculated energy requirement, respectively. During the last week before calving, LD group consumed 87.4% of their energy requirement and the other 2 treatments both exceeded 100%. LD group had a milder NEB com-pared to the other 2 treatments during the first week of lactation. During the first 4 wk postpartum, HD, MD and LD groups achieved 72.7%, 73.1% and 75.2% of their calculated energy requirement, respectively. In all treat-ments, the most marked NEB appeared in approximately the third and fourth week.
Discussion DMI and NEI
The average DMI for the 3 treatments was 12.6-14.3 kg/ d prepartum, which was higher than our previous study with cows in a tie-stall barn (12.3 kg/d in cool autumn and 8.0 kg/d in hot summer) [21]. In Janovick’s study [12], the cows housed in tie stalls and fed the same high NEL diet (6.8 MJ/kg) had less DMI (13.1 v. 14.3 kg/d) compared with our study, but those fed a similar low NEL diet (5.2 v. 5.4 MJ/kg) had a slightly higher DMI (12.8 v. 12.6 kg/d), and the BW of our experimental cows were much lower (approximately 650 v. 730 kg). Leymus chinensis hay has high NDF (68% ~ 74%, DM) and ADF (35% ~ 40%, DM) contents, and it’s effective ruminal NDF degradability is 26% ~ 31%, and is abun-dant in the Northeast of China. In the current study, cows fed a low energy density diet containing much Leymus chinensis hay had a significantly lower DMI pre-partum. In the last 48 h before calving, however, the DMI for the 3 treatments had no significant difference. The results revealed that a high NDF content diet gave a small change in DMI prepartum. Other studies have shown that diets supplemented with much wheat straw had lower DMI and DMI decline rate prepartum [11,22,23]. The average proportion of the19-mm screen for diets of HD, MD, LD groups were 23.2%, 20.4% and 14.7% as fed basis prepartum, respectively; and they were 35.1%, 29.8% and 19.3% for orts of HD, MD, LD groups, respectively. All the changes on the19-mm screen were less than 15 percentage unit, indicating no sorting has occurred.
MD and LD, respectively, which were higher than the energy requirements recommended by NRC (2001) [8]. Other studies have also confirmed that close-up cows fed with moderate or low energy density diets would easily consume more energy relative to their require-ments if DMI is not limited [11,24]. But the energy consumption of LD group fed a higher level of Leymus chi-nensis hay was closest to the NRC (2001) recommendation
[8]. Diets high in wheat straw in other studies have also shown the effect of controlling energy intake prepartum [11,12]. The LD group had significantly higher NDF intake compared with HD group during the last week before par-turition. In the last 24 h before calving, the NDF intake of LD group increased 63% compared with HD group, but the NEI was similar among the 3 treatment groups. Therefore we could conclude that DMI in the last 24 h before calving Table 2 Effect of energy density of close-up dry period diets on DMI and (NEI) in Holstein cows
Item Dietary treatment1 SEM P-value
HD MD LD Diet Time Interaction
DMI, kg/d
Prepartum
Wk−3 to−1 14.3a 13.6b 12.6c 0.14 <0.001 <0.001 0.87
Wk−1 12.3 11.8 11.1 0.29 0.22
H−48 to−25 10.9 11.0 9.6 0.46 0.37
H−24 to 0 5.0 5.6 6.3 0.61 0.7
Postpartum
Wk 1 to 5 18.8b 19.1ab 19.7a 0.13 0.04 <0.001 0.37
H 0 to 24 10.5 10.4 11.1 0.82 0.95
H 25 to 48 11.9 12.1 12.6 0.7 0.93
Wk 1 to 3 17.9 18.1 18.3 0.18 0.86 <0.001 0.67
Wk 4 to 5 20.1b 20.7b 21.7a 0.17 0.001 0.12 0.66
NEI, MJ/d
Prepartum
Wk−3 to−1 97.1a 83.3b 68.6c 0.83 <0.001 <0.001 0.42
Wk−1 83.3a 72.4b 60.2c 2.22 < 0.001
H−48 to−25 73.9a 67.3a 52.0b 3.31 0.01
H−24 to 0 34.1 33.9 34.3 3.64 0.99
Postpartum
Wk 1 to 5 136.0b 138.1ab 142.3a 0.95 0.03 <0.001 0.67
H 0 to 24 76.3 75.3 80.1 6.23 0.87
H 25 to 48 86.1 97.9 91.0 5.06 0.93
Wk 1 to 3 129.2 130.5 132.2 1.40 0.72 <0.001 0.9
Wk 4 to 5 145.2b 149.4b 156.9a 1.25 0.001 0.12 0.64
NDF, kg/d
Prepartum
Wk−3 to−1 5.3c 5.8b 6.3a 0.07 <0.001 <0.001 0.99
Wk−1 4.6b 5.1ab 5.5a 0.14 0.03
H−48 to−25 4.1 4.7 4.8 0.20 0.32
H−24 to 0 1.9 2.4 3.1 0.28 0.19
Postpartum
Wk 1 to 5 6.0b 6.1ab 6.2a 0.04 0.04 <0.001 0.40
H 0 to 24 3.3 3.3 3.5 0.26 0.95
H 25 to 48 3.8 3.9 4.0 0.22 0.95
1
HDhigh energy density diet,MDmiddle energy density diet,LDlow energy density diet. a, b, c
was not decided by rumen volume, but rather by energy requirement.
After parturition, LD group had higher DMI compared with HD and MD groups. These results concur with an-other two studies showing that large changes in DMI prepartum have been related to lower DMI postpartum [25,26]. This effect can be explained as follows, 1) the dietary palatability changed more for the LD group from dry cow diet to lactation diet, and the average DMI of the first and second 24 h periods after calving were 0.6 kg and 0.7 kg higher than HD group in this study. 2) Small changes of DMI prepartum may lead to less meta-bolic disorders which could decrease DMI. Some studies have demonstrated that overfeeding energy prepartum results in a greater number of health problems postpar-tum [11,24,27].
Lactation performance
The reduced energy density of close-up diets increased the milk yield, but did not significantly affect 4% FCM yield. During the first 3 wk, average milk yields of the 3 treatments were similar, but the 4% FCM yield was 2.1 kg/d more for HD group than LD group due to a significantly higher milk fat content. Douglas et al. [24] also showed that cows on restricted intake diets prepartum had a numerically higher milk yield (1.5-2.5 kg/d) compared to those on ad libitum intake. On the contrary, cows fed a 150% of requirement energy diet prepartum tended to produce more milk in wk 1 to 8 than cows fed a 100% and 80% requirement energy diets [12]. In the above two studies, milk fat content for cows with more energy consumption prepartum was significantly or numerically higher than lower en-ergy consumption cows which was in agreement with
our study. Janovick et al. [12] reported that high milk fat content might be due to a greater mobilization of body stores in the early lactation period. Blood nones-terified fatty acids (NEFA) could account for as much as 40% of milk fat content on 4 DIM [1]. In this study, the plasma NEFA concentration for HD group was sig-nificantly higher than that of LD group during the first 2 wk of lactation (605.7 v. 464.8 μEq/L, the data were not published), and the numerically higher BW and BCS loss of HD group could be explained by more mobilization of adipose tissue, which resulted in a high milk fat content. Although milk lactose content is stable, the milk lactose content for HD group was sig-nificantly lower than MD and LD groups during the first 3 wk in the current study. A similar result was re-ported by Janovick et al. [12]. However, this result was not observed by some others [11,28].
Table 3 Effect of energy density of close-up dry period diets on body condition score (BCS) and BW in Holstein cows
Item Dietary treatment1 SEM P-value
HD MD LD
BCS
Initial BCS 3.54 3.52 3.54 0.06 0.93
Wk−3 to−1 change 0.02 0.00 −0.04 0.02 0.27
Wk 1 to 5 change −0.42 −0.34 −0.33 0.04 0.71
BW, kg
Initial BW 632 647 659 8.11 0.42
Wk−3 to−1 change 33.6 29.1 22.7 2.52 0.20
Wk 1 to 3 change −32.1 −25.3 −27.4 3.25 0.73
Wk 1 to 5 change −57.8 −49.6 −47.4 3.88 0.55
1
HDhigh energy density diet,MDmiddle energy density diet,LDlow energy density diet.
Table 4 Effect of energy density of close-up dry period diets on milk yield and composition in Holstein cows
Item Dietary treatment1 SEM
P-value HD MD LD Diet Time Interaction
Milk yield, kg/d
Wk 1 to 3 32.0 32.1 32.2 0.51 0.53 <0.001 0.78
Wk 1 to 10 36.6b 38.6a 38.7a 0.36 0.03 <0.001 0.99
4% FCM yield, kg/d
Wk 1 to 3 44.0 42.4 41.9 0.78 0.55 <0.001 0.72
Wk 1 to 6 45.4 45.7 45.4 0.54 0.90 <0.001 0.91
Fat, %
Wk 1 to 3 6.43a 5.87b 5.67b 0.11 0.02 0.03 0.89
Wk 1 to 6 5.96a 5.60b 5.45b 0.06 0.006 <0.001 0.90
Protein, %
Wk 1 to 3 3.66 3.65 3.67 0.05 0.97 <0.001 0.54
Wk 1 to 6 3.50 3.45 3.48 0.02 0.69 <0.001 0.90
Lactose, %
Wk 1 to 3 4.89b 5.07a 5.12a 0.03 0.02 0.02 0.28
Wk 1 to 6 4.99 5.10 5.12 0.04 0.06 0.002 0.12
Fat, kg/d
Wk 1 to 3 2.05 1.94 1.90 0.04 0.33 <0.001 0.70
Wk 1 to 6 2.07 2.06 2.01 0.03 0.68 <0.001 0.89
Protein, kg/d
Wk 1 to 3 1.17 1.20 1.21 0.03 0.57 <0.001 0.55
Wk 1 to 6 1.22 1.26 1.28 0.01 0.19 <0.001 0.94
Lactose, kg/d
Wk 1 to 3 1.58 1.69 1.72 0.03 0.12 <0.001 0.69
Wk 1 to 6 1.77b 1.90a 1.91a 0.02 0.04 <0.001 0.99
1
HDhigh energy density diet,MDmiddle energy density diet,LDlow energy density diet.
a, b
Energy balance
Douglas et al. [24] reported that cows fed 6.3 MJ/kg NEL diet in the whole 60 d dry period consumed an average of 159% of the NRC (2001) requirements for NEL. In the current study, cows on moderate or even low energy diets offered ad libitum intake during the close-up period consumed more energy relative to their requirements. The HD group was almost in posi-tive EB in the whole close-up period, but the NEI was markedly lower than requirements due to a sharp decrease in DMI in the last 3 d before parturation. A 5.4 MJ of NEL/kg diet could meet the energy require-ments of cows before d 12, and the NEB became much more serious with the onset of calving. All the 3 treat-ment cows gained BW prepartum, but LD group lost BCS. Janovick et al. [12] also reported that dry cows offered a diet meeting 80% of energy requirements lost BCS but gained18 kg over the dry period. We could conclude that the increase of BW was attributable to the rapid growth of the fetus and placenta in late preg-nancy, and not to maternal BW increase.
Although the average postpartum EB was not signifi-cantly affected by prepartum diets, HD group had 3.8 and 12.5 MJ/d more energy deficiency than MD and LD
groups during the first week of lactation, respectively. Other studies have also showed that overfed cows in the dry period were in more NEB postpartum [11,12]. The higher milk fat content for HD group during the first 3 wk of lactation also implied a more marked NEB in the current study.
Conclusions
Feeding a high energy density diet prepartum resulted in large decline in DMI prepartum, higher milk fat content and lower milk lactose content during the first 3 wk of lactation. The low energy density diet was beneficial in controlling NEI prepartum, increasing milk yield and DMI, and alleviating NEB postpartum.
Abbreviations
DMI:Dry matter intake; EB: Energy balance; NEL: Net energy for lactation;
HD: High energy density diet containing 6.8 MJ NEL/kg; MD: Middle energy
density diet containing 6.2 MJ NEL/kg; LD: Low energy density diet
contaning 5.4 MJ NEL/kg; DIM: Day in milk; DM: Dry matter; NEB: Negative
energy balance; BW: Body weight; BCS: Body condition score; CP: Crude protein; NDF: Neutral detergent fibre; ADF: Acid detergent fibre; NEI: NEL
intake; NEM: Net energy required for maintenance; NEP: Net energy required
for pregnancy; EBPRE: Prepartum EB; EBPOST: Postpartum EB.
Competing interests
The authors declare that they have no competing interests. Table 5 Effect of energy density of close-up dry period diets on EB in Holstein cows
Item Dietary treatment1 SEM P-value
HD MD LD Diet Time Interaction
EB, MJ/day
Prepartum
Wk−3 to−1 30.1a 15.9b 1.3c 0.94 < 0.001 < 0.001 0.34
Wk−3 42.3a 26.8b 7.5c 3.22 < 0.001
Wk−2 37.2a 20.9b 3.3c 2.93 < 0.001
Wk−1 15.9a 6.7b
−8.4c 2.34 < 0.001
Postpartum
Wk 1 to 4 −45.2 −46.0 −43.1 2.2 0.66 0.09 0.99
Wk 1 −43.5 −39.7 −31.0 4.27 0.49
Wk 2 −41.0 −40.2 −38.9 4.06 0.98
Wk 3 −51.9 −53.1 −52.3 4.48 0.99
Wk 4 −47.3 −47.7 −43.9 3.05 0.86
EB, % of requirement
Prepartum
Wk−3 to−1 149.8 126.2 101.1
Wk−1 125.6 109.7 87.4
Postpartum
Wk 1 to 4 72.7 73.1 75.2
Wk 1 72.7 73.5 79.2
1
HDhigh energy density diet,MDmiddle energy density diet,LD, low energy density diet. a, b, c
Authors’contributions
WH, YT, AS, AY and ZW carried out the experiments. SL, ZC and YW participated in the design of the study, and drafted the manuscript. All authors read and approved the final manuscript.
Acknowledgments
This research was financially supported by National Natural Science Foundation of China (31272469, 31372334) and China Agriculture Research System (CARS-37). The authors greatly appreciate all the people who offered assistance in the experimental procedures and paper writing.
Received: 14 March 2014 Accepted: 23 May 2014 Published: 29 May 2014
References
1. Bell AW:Regulation of organic nutrient metabolism during transition from late pregnancy to early lactation.J Anim Sci1995,73:2804–2819. 2. Grummer RR, Wiltbank MC, Fricke PM, Watters RD, Silva-Del-Rio N:Management
of dry and transition cows to improve energy balance and reproduction. J Reprod Dev2010,56:S22–S28.
3. Bertics SJ, Grummer RR, Cadorniga-Valino C, Stoddard EE:Effect of prepartum dry matter intake on liver triglyceride concentration and early lactation. J Dairy Sci1992,75:1914–1922.
4. Grummer RR:Impact of changes in organic nutrient metabolism on feeding the transition dairy cow.J Anim Sci1995,73:2820–2833. 5. Guo J, Peters RR, Kohn RA:Effect of a transition diet on production
performance and metabolism in periparturient dairy cows.J Dairy Sci 2007,90:5247–5258.
6. Moe PW, Tyrrell HF:Metabolizable energy requirements of pregnant dairy cows.J Dairy Sci1972,55:480–483.
7. McNamara S, O'Mara FP, Rath M, Murphy JJ:Effects of different transition diets on dry matter intake, milk production, and milk composition in dairy cows.J Dairy Sci2003,86:2397–2408.
8. NRC:Nutrient requirements of dairy cattle.7th edition. Washington, DC: National Academies Press; 2001.
9. Doepel L, Lapierre H, Kennelly JJ:Peripartum performance and metabolism of dairy cows in response to prepartum energy and protein intake.J Dairy Sci2002,85:2315–2334.
10. Agenas S, Burstedt E, Holtenius K:Effects of feeding intensity during the dry period. 1. Feed intake, body weight, and milk production.J Dairy Sci 2003,86:870–882.
11. Dann HM, Litherland NB, Underwood JP, Bionaz M, D'Angelo A, McFadden JW, Drackley JK:Diets during far-off and close-up dry periods affect periparturient metabolism and lactation in multiparous cows.J Dairy Sci2006,89:3563–3577. 12. Janovick NA, Drackley JK:Prepartum dietary management of energy intake
affects postpartum intake and lactation performance by primiparous and multiparous Holstein cows.J Dairy Sci2010,93:3086–3102.
13. Rukkwamsuk T, Wensing T, Geelen MJ:Effect of overfeeding during the dry period on regulation of adipose tissue metabolism in dairy cows during the periparturient period.J Dairy Sci1998,81:2904–2911. 14. Herdt TH:Ruminant adaptation to negative energy balance. Influences
on the etiology of ketosis and fatty liver.Vet Clin North Am Food Anim Pract2000,16:215–230.
15. Bobe G, Young JW, Beitz DC:< i > Invited review:pathology, etiology, prevention, and treatment of fatty liver in dairy cows.J Dairy Sci2004, 87:3105–3124.
16. FASS:Guide for the care and use of agricultural animals in research and teaching.3rd edition. Champaign, IL: Federation of Animal Science Societies; 2010.
17. Chapinal N, Veira DM, Weary DM, von Keyserlingk MAG:Technical note: validation of a system for monitoring individual feeding and drinking behavior and intake in Group-Housed cattle.J Dairy Sci2007,90:5732–5736. 18. Lammers BP, Buckmaster DR, Heinrichs AJ:A simple method for the
analysis of particle sizes of forage and total mixed rations.J Dairy Sci 1996,79:922–928.
19. Dann HM, Carter MP, Cotanch KW, Ballard CS, Takano T, Grant RJ:Effect of partial replacement of forage neutral detergent fiber with By-Product neutral detergent fiber in Close-Up diets on periparturient performance of dairy cows.J Dairy Sci2007,90:1789–1801.
20. Ferguson JD, Galligan DT, Thomsen N:Principal descriptors of body condition score in Holstein cows.J Dairy Sci1994,77:2695–2703.
21. Su H, Wang Y, Zhang Q, Wang F, Cao Z, Rahman MA, Cao B, Li S: Responses of energy balance, physiology, and production for transition dairy cows fed with a low-energy prepartum diet during hot season. Trop Anim Health Prod2013,45:1495–1503.
22. Minor DJ, Trower SL, Strang BD, Shaver RD, Grummer RR:Effects of nonfiber carbohydrate and niacin on periparturient metabolic status and lactation of dairy cows.J Dairy Sci1998,81:189–200.
23. Beever DE:The impact of controlled nutrition during the dry period on dairy cow health, fertility and performance.Anim Reprod Sci2006,96:212–226. 24. Douglas GN, Overton TR, Bateman HN, Dann HM, Drackley JK:Prepartal
plane of nutrition, regardless of dietary energy source, affects periparturient metabolism and dry matter intake in Holstein cows. J Dairy Sci2006,89:2141–2157.
25. Grummer RR, Mashek DG, Hayirli A:Dry matter intake and energy balance in the transition period.Vet Clin North Am Food Anim Pract2004,20:447–470. 26. Drackley JK, Dann HM, Douglas GN, Guretzky NAJ, Litherland NB,
Underwood JP, Loor JJ:Physiological and pathological adaptations in dairy cows that may increase susceptibility to periparturient diseases and disorders.Ital J Anim Sci2005,4:323–344.
27. Janovick NA, Boisclair YR, Drackley JK:Prepartum dietary energy intake affects metabolism and health during the periparturient period in primiparous and multiparous Holstein cows.J Dairy Sci2011,94:1385–1400.
28. Rabelo E, Rezende RL, Bertics SJ, Grummer RR:Effects of transition diets varying in dietary energy density on lactation performance and ruminal parameters of dairy cows.J Dairy Sci2003,86:916–925.
doi:10.1186/2049-1891-5-30
Cite this article as:Huanget al.:Effect of reduced energy density of close-up diets on dry matter intake, lactation performance and energy balance in multiparous Holstein cows.Journal of Animal Science and Biotechnology20145:30.
Submit your next manuscript to BioMed Central and take full advantage of:
• Convenient online submission
• Thorough peer review
• No space constraints or color figure charges
• Immediate publication on acceptance
• Inclusion in PubMed, CAS, Scopus and Google Scholar
• Research which is freely available for redistribution