R E S E A R C H A R T I C L E
Open Access
Image quality and pathology assessment in
CT Urography: when is the low-dose series
sufficient?
Bharti Kataria
1,2,3*, Jonas Nilsson Althén
2,4, Örjan Smedby
5, Anders Persson
1,2,3, Hannibal Sökjer
2and
Michael Sandborg
2,3,4Abstract
Background:Our aim was to compare CT images from native, nephrographic and excretory phases using image quality criteria as well as the detection of positive pathological findings in CT Urography, to explore if the radiation burden to the younger group of patients or patients with negative outcomes can be reduced.
Methods:This is a retrospective study of 40 patients who underwent a CT Urography examination on a 192-slice dual source scanner. Image quality was assessed for four specific renal image criteria from the European guidelines, together with pathological assessment in three categories: renal, other abdominal, and incidental findings without clinical significance. Each phase was assessed individually by three radiologists with varying experience using a graded scale. Certainty scores were derived based on the graded assessments. Statistical analysis was performed using visual grading regression (VGR). The limit for significance was set atp= 0.05.
Results:For visual reproduction of the renal parenchyma and renal arteries, the image quality was judged better for the nephrogram phase (p< 0.001), whereas renal pelvis/calyces and proximal ureters were better reproduced in the excretory phase compared to the native phase (p< 0.001). Similarly, significantly higher certainty scores were obtained in the nephrogram phase for renal parenchyma and renal arteries, but in the excretory phase for renal pelvis/calyxes and proximal ureters. Assessment of pathology in the three categories showed no statistically significant differences between the three phases. Certainty scores for assessment of pathology, however, showed a significantly higher certainty for renal pathology when comparing the native phase to nephrogram and excretory phase and a significantly higher score for nephrographic phase but only for incidental findings.
Conclusion:Visualisation of renal anatomy was as expected with each post-contrast phase showing favourable scores compared to the native phase. No statistically significant differences in the assessment of pathology were found between the three phases. The low-dose CT (LDCT) seems to be sufficient in differentiating between normal and pathological examinations. To reduce the radiation burden in certain patient groups, the LDCT could be considered a suitable alternative as a first line imaging method. However, radiologists should be aware of its limitations.
Keywords:Computed tomography, Urography, Low-dose, Optimization, Image quality, Dose
© The Author(s). 2019Open Access This article is distributed under the terms of the Creative Commons Attribution 4.0 International License (http://creativecommons.org/licenses/by/4.0/), which permits unrestricted use, distribution, and reproduction in any medium, provided you give appropriate credit to the original author(s) and the source, provide a link to the Creative Commons license, and indicate if changes were made. The Creative Commons Public Domain Dedication waiver (http://creativecommons.org/publicdomain/zero/1.0/) applies to the data made available in this article, unless otherwise stated. * Correspondence:Bharti.Kataria@liu.se
1Department of Radiology, Linköping University, Linköping, Sweden 2Department of Medical & Health Sciences, Linköping University, Linköping,
Sweden
Background
CT Urography (CTU) has emerged as the modality of choice in imaging of the abdomen in patients with urinary tract diseases due to its high sensitivity and specificity [1]. Although it comes with a high radiation dose penalty, the benefits of CT imaging outweigh the risk for many of these patients. Optimisation is not only about patient dose and image quality but also about the diagnostic task at hand, i.e. the correct examination technique for a specific diagnostic enquiry in accordance to the ALARA (radiation dose as low as reasonably achievable) and AHARA (image quality as high as reasonably achievable) principles [2,3]. Patients presented with haematuria or acute flank pain usually undergo diagnostic imaging to rule out any serious conditions underlining upper urinary tract disease such as urolithiasis, renal cell cancer or upper urinary tract urothelial cell carcinoma (UUT-UCC) [4]. Urolithiasis is a common health problem with a high recurrent rate re-quiring considerable radiological imaging resources for this population, many of which are younger than 50 years of age [5].
The standardized care pathway (SCP) led to general recommendations of the use of medical imaging in diag-nostics of urinary tract disease for patients with macro-scopic hematuria who are≥40 years (revised to≥50 years in 2018), but even younger patients with risk factors are investigated [6]. The majority of the SCP population consist of malignant cancer diagnoses of the urinary tract and a third of the patients present with benign causes of hematuria [6]. Approximately 20–30% of these patients with symptoms of visible blood have negative outcomes and are being subjected to diagnostic imaging tests and radiation related risks based on the presence of macro-hematuria [6].
Macroscopic hematuria is a common symptom in other treatable benign diseases such as urinary tract in-fection and targets younger women of child bearing age, among others [7].
CTU is a multiphase examination associated with a relatively high radiation dose and can be justified as a first line investigation in hematuria patients if important risk factors are present and clinical tests indicate high risk probability of cancer [8]. In the emergency depart-ment, where the short examination times as well as the detection of alternative diagnoses is paramount, CT is the preferred modality with a selection of scan protocols depending on the indication. The detrimental effects of ionizing radiation and the expanding use of CT tech-nique have been the driving factors in optimization of clinical practices regarding appropriateness criteria and dose reduction [9]. These can be achieved foremost by selective use of nonradiative modalities such as ultrasound and magnetic resonance imaging (MRI) and referrals based on proper clinical indications, preliminary tests and
patient groups. Dose reduction is achieved in a number of ways, such as, limiting scan lengths and number of phases, and the use of lower exposure settings. Dose reduction is additionally seen in the use of features such as automatic dose modulation, iterative reconstruction [10–12] and split-bolus techniques especially in diagnostic imaging of younger, high risk patients [13,14]. Recent advancements show a trend towards use of low-dose CT (LDCT) in several diagnostic indications such as the investigation of acute flank pain and acute abdomen for diverticulitis, ap-pendicitis and renal stone disease [15,16].
Both the Bonn call for action and the triple AAA cam-paign were introduced to strengthen the need for stringent measures in radiation protection for safe and appropriate use of ionizing radiation in medical imaging [17–19]. Pub-lished literature on renal stone evaluation have validated the trend towards use of low-dose CT (LDCT) due to the high contrast between urinary stones and the surrounding soft tissue [15,20] as well as in investigation of acute abdo-men [16]. However, implementation of the LDCT protocol in the clinical setting has been very slow partly due to the low quality of the images and lack of confidence in inter-preting reduced-dose images [21]. But with practice and growing experience it is possible to increase diagnostic con-fidence and acceptance of lower quality images [22].
The diagnostic performance of non-enhanced CT com-pared to intravenous urography (IVU) [23] and plain abdominal radiography [24] has been evaluated but there are, to our knowledge, no studies that have compared the image quality and pathology assessment between phases as the present study.
The aim was to compare CT images from native, nephrographic and excretory phases using image quality criteria as well as the detection of positive pathological findings in CT Urography to explore if the radiation burden to the younger group of patients, patients under-going repetitive imaging or patients with negative out-comes can be reduced.
Materials & methods
This is a retrospective study approved by the regional ethical board. Of the 50 patients referred for a clinical CTU between 2016-03-14 and 2016-11-22 and examined on a 192-slice dual source scanner in single source mode (Siemens Healthineers, Erlangen, Germany), forty patients were included in the study. The acquisition data are pre-sented in Table1.
Dose Length Product (DLP) were recorded and Size Specific Dose Estimate (SSDE) was calculated based on the antero-posterior (AP) and lateral (LAT) dimensions of each patient at the level of the kidneys using the center slice approach as described in Boos et al. [25,26].
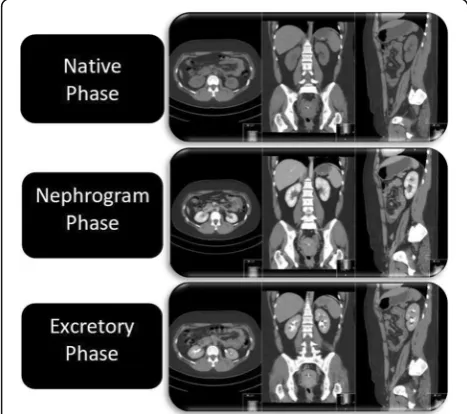
The standard protocol for CTU consists of three phases: the native or unenhanced phase (low-dose), a nephrographic phase (standard dose) and an excretory phase (low-dose), all of which are reconstructed with multi-planar reconstruction (MPR) in three planes: axial, coronal and sagittal (Fig.1). In patients < 50 years of age, the nephrographic phase is limited to the upper abdo-men. Patients > 50 years of age are examined with all three phases from dome of diaphragm to symphysis pubis arch.
During the reading sessions the readers were asked to grade four anatomical structures (renal parenchyma, renal pelvis and calyxes, proximal ureters and renal arteries) obtained from European guidelines for quality criteria on a five-point Likert scale with numerical scores from one to five allocated to response alternatives; criterion was fulfilled, criterion was probably fulfilled, in-decisive, criterion was probably not fulfilled and criter-ion was not fulfilled (Table2).
The readers were also asked to assess the presence of pathology in three categories; renal, abdominal and inci-dental findings. These were also graded on a five-point Likert-type scale based on numerical scores from one to five with response alternatives; normal examination, prob-ably normal examination, indecisive, probprob-ably pathological examination and pathological examination (Table 3). To determine how certain the readers were in their scoring of the image criteria and pathological findings, variation in certainty scores between the three phases were also calcu-lated by grouping the score options as shown in Table4.
Statistical analysis within the Visual Grading Regres-sion (VGR) framework [27] was performed with the soft-ware Stata 13.1 (Stata Corporation LP, College Station, TX, USA) using the multi-level mixed-effects ordered logistic regression (meologit)command for image quality scores [28]. Thus, ordinal logistic regression was applied to scores from observer ratings whilst controlling for dependencies between observers and patients, where the regression coefficients describe the combined effect of dose and intravenous contrast on image quality, related to each of the phases of the CTU. The certainty scores were analyzed using the same statistic model as the original scores.
Results
Of the 40 patients included in the study, 12 were women, age range 27–74 years (mean 58.9 ± 14 (SD)) Table 1Acquisition parameters for a clinical CT Urography on a 192-slice dual source scanner in a single source scan mode
Phase Acquisition data kV Qref mAs Gantry Rotation (s) Pitch Slice thickness/increment mm Scan Delay Care kV
Native 192 × 0.6 120 45 0.5 0.6 3/2 On
Nephrogram 192 × 0.6 120 140 0.5 0.6 3/2 100 s Semi
Excretory 192 × 0.6 120 45 0.5 0.6 3/2 10 min On
The scan length ranged from diaphragm to symphysis pubis. The images were reconstructed with kernel Bf36 and iterative reconstruction ADMIRE strength 3. In the nephrographic phase semi Care kV setting was used resulting in 100 kV and effective tube load of 181mAs
Fig. 1Illustration of compared phases reconstructed with multi-planar reconstruction (MPR) in three planes. The images are from a CT Urography examination of a study patient
Table 2Anatomical image criteria assessed for each phase including axial, coronal and sagittal multiplanar reconstruction (MPR) planes and graded on a 5-point Likert type scale by allocating a score of 1 to 5
Image Criteria
C1: Visually sharp reproduction of the renal parenchyma
C2: Visually sharp reproduction of the renal pelvis and calyxes
C3: Visually sharp reproduction of the proximal part of the ureters
C4: Visually sharp reproduction of the renal arteries
Grading Scale scores
1: Criterion was fulfilled
2: Criterion was probably fulfilled
3: Indecisive
4: Criterion was probably not fulfilled
with a body mass index (BMI) of 20.7–35.7 kg/m2(mean 27.7 ± 5.0) and 28 men, age range 29–85 years (mean 63.8 ± 15.0) with a BMI of 19.3–38.9 kg/m2 (mean 27.0 ± 3.7). The mean values, SD and ranges of DLP, CTDIvol,SSDE for the native, nephrogram and excretory
phases are displayed in Table5.
Assessment of anatomical image criteria
When comparing the native phase with nephrogram and excretory phase respectively, criteria C1 and C4 (renal parenchyma and renal arteries) were better reproduced in the nephrographic phase, whereas criteria C2 and C3 (renal pelvis/calyxes, proximal ureters), were visually better reproduced in the excretory phase, (p< 0.001). Similar results were obtained when comparing the nephrogram to excretory phase, where the nephro-graphic phase was favorable for criteria C1 (renal paren-chyma) and C4 (renal arteries) (p< 0.001). For the delineation of criteria C2 (renal pelvis/calyxes) and C3 (proximal ureters), the excretory phase was preferred (p< 0.001 andp= 0.034, respectively) (Fig.2).
Assessment of pathology
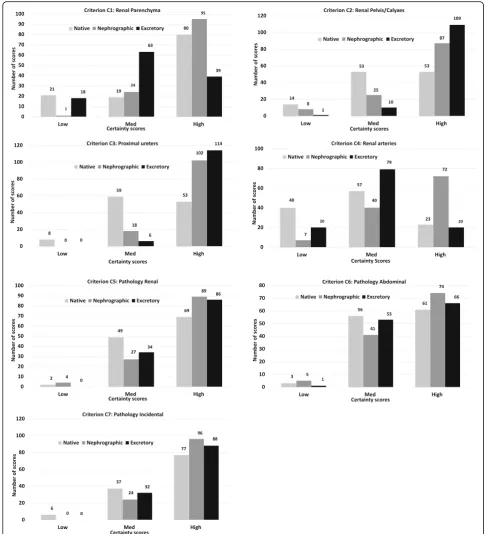
For the detection of renal and other abdominal path-ologies, only marginal and not statistically significant differences in scores were found when comparing the native phase with nephrographic and excretory phases. Similarly, the scores for incidental findings in all three phases were not significantly different. For all three pathology categories, the number of incon-clusive scores were very low suggesting that normality and pathology could be assessed in all three phases with marginal differences in scores. The native phase had a higher number of probably normal examination scores compared to the other two phases. None of these differences were statistically significant.
Certainty scores Image criteria
High certainty scores are seen for criteria C1 (renal parenchyma) and C4 (renal arteries) in favor of the nephrographic phase, when comparing native to nephrographic phase (p< 0.001). Similar results are seen for comparison between nephrographic and ex-cretory phase with significant differences in favor of the nephrographic phase (p< 0.001). However, when comparing native and excretory phases, certainty for criterion C1 (renal parenchyma) was statistically nificantly higher for the native phase whereas no sig-nificant difference was found for criterion C4 (renal arteries). Criteria C2 (renal pelvis/calyxes) and C3 (proximal ureters) showed significantly higher cer-tainty scores in the contrast-enhanced phases when comparing native phase to nephrographic and excretory phases (p< 0.001). Comparisons between Table 3Pathology categories were assessed for each phase
including axial, coronal and sagittal multiplanar reconstruction (MPR) planes and graded on a 5-point Likert type scale by allocating a score of 1 to 5
Pathology categories
C5: Pathology in the kidneys and urinary tract related to abdominal symptoms
C6: Other pathology related to abdominal symptoms
C7: Incidental findings without clinical significance
Grading Scale scores
1: Normal examination
2: Probably normal examination
3: Inconclusive examination
4: Probably pathological examination
5: Pathological examination
Table 4Certainty scores obtained by grouping the assessment scores for anatomical criteria and pathology
Grouping of scores
Certainty score: Image criteria
High 1 and 5 (was fulfilled/not fulfilled)
Medium 2 and 4 (probably fulfilled/probably not fulfilled)
Low 3 (indecisive)
Certainty score: Pathology
High 1 and 5 (normal examination/pathological examination)
Medium 2 and 4 (probably normal examination/probably pathological examination)
Low 3 (indecisive)
Table 5Distribution of ranges, standard deviation (SD) and mean values of dose length product (DLP), Computed Tomography Dose Index (CTDIvol) and size specific dose
estimate (SSDE)
Phase DLP
mGy.cm
CTDIvol
mGy
SSDE mGy
Native
Mean 135.7 2.84 3.51
SD 38.3 0.73 0.79
Range 63.8–257.6 1.45–5.39 2.28–6.93
Nephrogram
Mean 336.2 6.9 8.52
SD 100.6 1.9 2.55
Range 151.5–696.8 3.46–14.58 5.45–18.75
Excretory
Mean 135.4 2.83 3.49
SD 38.7 0.73 0.79
nephrographic and excretory phases show a highly significant difference in scores in favor of excretory phase for criterion C2 (renal pelvis/calyxes) (p< 0.001) and a significant difference in scores for criterion C3 (proximal ureters) (p= 0.021).
Pathology
Significantly high certainty scores in favor of the con-trast enhanced phases are obtained for C5 (renal pathology) (p< 0.05), when comparing native to nephrographic and excretory phases, however, there
was no significant difference between the two con-trast-enhanced phases. Marginal not significant differ-ences in medium and high certainty scores are observed for Criteria C6 (abdominal pathology) and C7 (incidental findings) when comparing all three phases with each other. Except for determination of C7 (incidental findings), which was statistically signifi-cant in favor of the nephrographic phase (p< 0.01), when native and nephrographic phases were com-pared, all other differences in scores between phases were not significant.
Discussion
The present study showed that the contrast-enhanced phases were considered significantly better for determin-ation of renal pathology. This is not an unusual finding as the acquisition delays after contrast injection are designed to render anatomical features in the best possible way. However, the marginal differences in scores when assessing pathology in the three categories were not significant, with very few inconclusive scores suggesting that it was possible to determine whether the examination was normal or pathological in all three phases. This is also demonstrated by the larger number of high and medium certainty scores for all three categories (Fig.3). The LDCT is one of many alternatives, that could possibly be used to differentiate be-tween normal and pathological in order to reduce the radi-ation burden in patients with negative outcomes and those who are more sensitive to ionising radiation.
There are studies that have evaluated the effect of iterative reconstruction on dose reduction in patients presented with acute abdominal pain [11,12]. Lee et al. [12] concluded that despite subjective differences in image quality between full-dose and half-dose images, the diagnostic performance is maintained for the low-dose images with the exception of lesion detection at sub-centimeter size. Poletti et al. [11] concluded that low-dose imaging can be achieved in non-obese pa-tients. However, these studies were performed with contrast enhancement which, combined with dose re-duction properties of IR, maintains the diagnostic per-formance of the low-dose protocol when compared to contrast-enhanced standard-dose protocol.
In order to optimize the use of CT in urinary tract investigations, there are several methods that can be used to reduce dose in abdominal CT such as modifying scanning parameters [29], using a combination of standard-dose and low-standard-dose phases in a CTU protocol [30] and re-ducing the number of acquisitions and scan lengths [14]. As the implementation of the LDCT has been very slow, this study provides an insight into the possible applicability of this protocol in clinical practice to reduce radiation dose for adolescents and children, as well as patients that require repetitive imaging.
Our CTU protocol is optimized using automatic dose modulation as well as iterative reconstruction and combin-ation of low-dose and standard-dose series in concurrence with Dahlman et al. [30] who obtained significant dose re-ductions, in the unenhanced and excretory phases, achieved when combined with one normal-dose phase. However, the dilemma of reducing the radiation burden in certain patient groups still remains. Some institutions have adopted a work-flow routine in order to minimize the number of phases re-quired by viewing the low-dose series to determine further need for imaging (Magnusson A, CT lecture, Larvik, 2018, personal communications). However due to logistics this is not always possible especially for referrals from the emer-gency department where time is of essence.
One of the sites at our institution extensively adopted the LDCT in 2012, to meet the urologists needs for im-aging after Extracorporal Shockwave Lithotripsy (ESWL) as well as follow-up imaging of patients with nephro- and uro-lithiasis. With growing expertise and increasing diag-nostic confidence, the comfort zone boundaries were broadened and the LDCT use was extended to diagnostics of acute flank pain and acute abdomen for several indica-tions such as diverticulitis, appendicitis and renal calculi [22] in concurrence with Hamimi et al. [31] who studied the efficiency of low-dose technique using an effective mAs of 50 (very similar to our LDCT protocol), in diagno-sis of renal calculi and concluded that it was crucial in the management of renal stone disease in the acute setting. Both Lee et al. [12] and Poletti et al. [11] demonstrated the use of LDCT in acute abdominal pain diagnoses. An LDCT protocol can be considered as a valuable tool in acute abdominal pain evaluation as it allows for many pos-sible differential diagnoses, but radiologists should also be aware of its limitations [22].
The statistical method (VGR) that we used, allowed us to analyze the three phases in the same analysis, with subse-quent pair-wise comparisons. VGR also has the ability to let the researcher estimate the potential dose reduction resulting from changes in the imaging protocol. However, the design of this retrospective study does not permit such an analysis.
There is one major study limitation: due to the retro-spective nature of our study we failed to separate the individual effects of dose and contrast enhancement on image quality. Ideally to determine these effects indi-vidually, all three phases should have been compared at different dose levels which would also allow for estima-tion of the potential dose reducestima-tion for each individual phase [32]. However, this would have increased the ra-diation burden for these patients.
Conclusion
statistically significant differences in the assessment of pathology were found between the three phases.
Since many certainty scores were in the high and medium categories, the LDCT seems to be sufficient to differentiate between normal and pathological examinations. In order to
reduce the radiation burden in adolescents and children, as well as patients with negative outcomes and those that re-quire repetitive imaging, the LDCT could be considered a suitable alternative as a first line imaging method. However, radiologists should be aware of its limitations.
Additional files
Additional file 1:Table S1.Scores for each of the criteria. Significance of differences between phases tested with mixed-effects ordinal logistic regression, with pairwise comparisons using Bonferroni correction. (DOCX 63 kb)
Additional file 2:Table S2.Certainty scores for each of the criteria. Significance of differences between phases tested with mixed-effects ordinal logistic regression in phase comparisons using Bonferroni correction. (DOCX 55 kb)
Abbreviations
AHARA:As high as reasonably achievable; ALARA: As low as reasonably achievable; CTDIvol: Computed Tomography Dose Index; CTU: Computed Tomography Urography; DLP: Dose Length Product; ESWL: Extracorporal Shock Wave Lithotripsy; kV: kilovolt; LDCT: Low-dose Computed Tomography; mAs: milliampere seconds; mGy: milligray; MRI: Magnetic Resonance Imaging; mSv: millisievert; SCP: Standardized Care Pathway; SD: Standard deviation; SSDE: Size Specific Dose Estimate
Acknowledgements
We thank our participating radiologists, Anki Pozson, Jenny Öman and Senija Halilic for grading the images.
Authors’contributions
All authors (BK, JNA, ÖS, AP, HS and MS) have contributed to the conception, design of the work and interpretation of the data. BK has been responsible for acquisition, drafting and revision of the manuscript in collaboration with the other authors and ÖS for performing the statistical analysis. All authors have contributed to the final manuscript and approved it.
Funding
This work was supported by ALF- and LFoU-grants from Region Östergötland and the Medical Faculty at Linköping University. The funding bodies have had no role in the design of the study and collection, analysis, interpretation of data and in writing the manuscript.
Availability of data and materials
The datasets used and/ or analyzed during the current study are available from the corresponding author on reasonable request.
Ethics approval and consent to participate
All procedures performed in studies involving human participants were in accordance with the ethical standards of the institutional research committee (Linköping University) and with the 1964 Helsinki declaration and its later amendments or comparable ethical standards. Our regional Ethical Review Board (EPN, Linköping) approved this retrospective study, and the requirement for informed consent was waived.
Consent for publication
Not applicable.
Competing interests
The authors declare that they have no competing interests.
Author details
1Department of Radiology, Linköping University, Linköping, Sweden. 2
Department of Medical & Health Sciences, Linköping University, Linköping, Sweden.3Center for Medical Image Science & Visualization (CMIV), Linköping
University, Linköping, Sweden.4Department of Medical Physics, Linköping University, Linköping, Sweden.5Department of Biomedical Engineering and
Health Systems (MTH), KTH Royal Institute of Technology, Stockholm, Sweden.
Received: 16 April 2019 Accepted: 29 July 2019
References
1. Sudah M. Modern Imaging of the Upper Urinary Tract [Dissertations in Health Sciences]: Publications of the University of Eastern Finland. Kuopio:
University of Eastern Finland; 2016.http://epublications.uef.fi/pub/urn_isbn_ 978-952-61-2083-6/urn_isbn_978-952-61-2083-6.pdf.
2. IAEA Safety standards Radiation protection and safety of radiation sources -International Basic Safety standards. Vienna: -International Atomic Energy Agency; 2014.https://www-pub.iaea.org/MTCD/Publications/PDF/Pub1578_ web-57265295.pdf.
3. Kalra M, Sodickson AD, Mayo-Smith WW. CT radiation key concepts for gentle and wise use. Radiographics. 2015;35:1706–21.
4. Cowan NC. CT urography for hematuria. Nat Rev Urol. 2012;9(4):218–26. 5. Bhatt K, Monga M, Remer EM. Low-dose computed tomography in the
evaluation of urolithiasis. J Endourol. 2015;29(5):504–11.
6. Standardiserade vårdförlopp cancer-urinblasa-ovre-urinvagarnawww. cancercentrum.seRegionala cancercentrum; 2018 [updated 27th February 2018].https://www.cancercentrum.se/globalassets/cancerdiagnoser/ urinvagar/urinblase%2D%2Doch-urinrorscancer/vardforlopp/svf-cancer-urinblasa-ovre-urinvagarna.pdf. Accessed 15 Dec 2018.
7. Muthulakshmi M, Gopalakrishnan S. Study on urinary tract infection among females of reproductive age group in a rural area of Kancheepuram district, Tamil Nadu. Int J Community Med Public Health. 2017;4(10):3915-21. 8. Van Der Molen AJ, Cowan NC, Mueller-Lisse UG, Nolte-Ernsting CC,
Takahashi S, Cohan RH. CT urography: definition, indications and techniques. A guideline for clinical practice. Eur Radiol. 2008;18:4–17. 9. Mathews JD, Forsythe AV, Brady Z, Butler MW, Goergen SK, Byrnes GB, et al.
Cancer risk in 680,000 people exposed to computed tomography scans in childhood or adolescence: data linkage study of 11 million Australians. BMJ. 2013;346:f2360.
10. Kaza RK, Platt JF, Goodsitt MM, Al-Hawary MM, Maturen KE, Wasnik AP, et al. Emerging techniques for dose optimization in abdominal CT. Radiographics. 2014;34:4–17.
11. Poletti PA, Becker M, Becker CD, Halfon Poletti A, Rutschmann OT, Zaidi H, et al. Emergency assessment of patients with acute abdominal pain using low-dose CT with iterative reconstruction: a comparative study. Eur Radiol. 2017;27:3300–9.
12. Lee KH, Shim YS, Park SH, Choi SJ, Pak SY, Cheong H. Comparison of standard-dose and half-dose dual-source abdominopelvic CT scans for evaluation of acute abdominal pain. Acta Radiol. 2018;0:1–9.
13. Safety and efficacy of computed tomography (SECT): A broad perspective (CT Safety and Efficacy) Euratom call 2003. 2008http://www.biophysicssite. com/Documents/SECT2008/DeliverableWP1D5F.pdf. Accessed 5 Feb 2019. 14. Sung MK, Singh S, Kalra MK. Current status of low dose multi-detector CT in
the urinary tract. World J Radiol. 2011;3:256–65.
15. Rodger F, Roditi G, Aboumarzouk OM. Diagnostic accuracy of low and ultra-low dose CT for identification of urinary tract stones: a systematic review. Urol Int. 2018;100:375–85.
16. Kim K, Kim YH, Kim SY, Kim S, Lee YG, Kim KP, et al. LDCT for evaluating appendicitis. N Engl J Med. 2012;366:1596–605.
17. Bonn-call-for-action 10 actions to improve Radiation Protection. Vienna: IAEA; 2014.https://www.who.int/ionizing_radiation/medical_exposure/ bonncallforaction2014.pdf?ua=1. Accessed 15 Dec 2018.
18. IAEA Bulletin 52-2-2011 Division of Public Information: IAEA; 2011
https://www.iaea.org/sites/default/files/bull52-2-february2011.pdf. Accessed 10 Feb 2019.
19. Dose reduction in CT while maintaining diagnostic confidence: a feasibility/ demonstration study. Vienna: IAEA; 2009. ISNN 1011-4289https://www-pub. iaea.org/MTCD/Publications/PDF/te_1621_web.pdf. Accessed 7 Feb 2019. 20. Gervaise A, Gervaise-Henry C, Pernin M, Naulet P, Junca-Laplace C,
Lapierre-Combes M. How to perform low-dose computed tomography for renal colic in clinical practice. Diagn Interv Imaging. 2016;97:393–400. 21. Weisenthal K, Karthik P, Shaw M, Sengupta D, Bhargavan-Chatfield M,
Burleson J, et al. Evaluation of kidney stones with reduced-radiation dose CT: Progress from 2011-2012 to 2015-2016-not there yet. Radiology. 2018; 286:581–9.
22. Halilic S and Kämmerling N. Värdet av DT-buköversikt som primär undersökning vid akut buk smärta. Linköping University Electronic Press, Linköping, 2016.http://liu.diva-portal.org/smash/get/diva2:1304503/ FULLTEXT01.pdf. Accessed 12 Apr 2019.
23. Wang J-H, Shen S-H, Huang S-S, Chang C-Y. Prospective comparison of unenhanced spiral computed tomography and intravenous urography in the evaluation of acute renal colic. J Chin Med Assoc. 2008;71(1):30–6. 24. Alshamari M, Norrman E, Geijer M, Jansson K, Geijer H. Diagnostic accuracy
acute abdominal pain: prospective study and systematic review. Eur Radiol. 2016;26(6):1766–74.
25. The report of AAPM task group 204. Size-specific dose estimates in paediatric and adult body CT examinations, 2011.https://www.aapm.org/ pubs/reports/RPT_204.pdf. Accessed 6 June 2019.
26. Boos J, Kropil P, Bethge OT, Aissa J, Schleich C, Sawicki LM, et al. Accuracy of size-specific dose estimate calculation from center slice in computed tomography. Radiat Prot Dosim. 2018;178(1):8–19.
27. Smedby Ö, Fredrikson M. Visual grading regression: analysing data from visual grading experiments with regression models. Br J Radiol. 2010; 83(993):767–75.
28. Saffari SELA, Fredrikson M, Smedby O. Regression models for analyzing radiological visual grading studies--an empirical comparison. BMC Med Imaging. 2015;15:49):1–10.
29. Dyakov I, Alamin M, Groudeva V, Vassileva J, Stoinova V, Hadjidekov V. Optimisation of CT procedures in two radiology departments. Phys Med. 2014;30:e17.
30. Dahlman P, Van der Molen AJ, Magnusson M, Magnusson A. How much dose can be saved in three-phase CT urography? A combination of normal-dose corticomedullary phase with low-normal-dose unenhanced and excretory phases. AJR Am J Roentgenol. 2012;199:852–60.
31. Hamimi A, El Azab M. MSCT renal stone protocol; dose penalty and influence on management decision of patients: is it really worth the radiation dose? Egypt J Radiol Nucl Med. 2016;47:319–24. 32. Kataria B, Althen JN, Smedby O, Persson A, Sokjer H, Sandborg M.
Assessment of image quality in abdominal CT: potential dose reduction with model-based iterative reconstruction. Eur Radiol. 2018;28(6):2464–73.
Publisher’s Note