T E C H N I C A L A D V A N C E
Open Access
Cut-scores revisited: feasibility of a new
method for group standard setting
Boaz Shulruf
1*, Lee Coombes
2, Arvin Damodaran
1, Adrian Freeman
3, Philip Jones
1, Steve Lieberman
5,
Phillippa Poole
4, Joel Rhee
1, Tim Wilkinson
6and Peter Harris
1Abstract
Background:Standard setting is one of the most contentious topics in educational measurement. Commonly-used
methods all have well reported limitations. To date, there is not conclusive evidence suggesting which standard setting method yields the highest validity.
Methods:The method described and piloted in this study asked expert judges to estimate the scores on a real MCQ examination that they consider indicated a clear pass, clear fail, and pass mark for the examination as a whole. The mean and SD of the judges responses to these estimates, Z scores and confidence intervals were used to derive the cut-score and the confidence in it.
Results:In this example the new method’s cut-score was higher than the judges’estimate. The method also yielded estimates of statistical error which determine the range of the acceptable cut-score and the estimated level of confidence one may have in the accuracy of that cut-score.
Conclusions:This new standard-setting method offers some advances, and possibly advantages, in that the decisions being asked of judges are based on firmer constructs, and it takes into account variation among judges.
Keywords:Standard setting, MCQ, Angoff, Assessment
Background
Standard setting is a contentious topic in educational measurement. Commonly used methods all have reported limitations. To date there is no conclusive evidence suggesting which standard setting method yields the high-est validity. A comprehensive review of standard setting in the book by G Cizek and M Bunch [1] provides an in-depth insight into a range of mechanisms by which judges’ perceptions of the desirable cut-scores are extracted and summarised. The axiom used by Cizek & Bunch is that ‘regardless of the procedure chosen, the standard setter will always need to involve people and judgments’ [1]. This axiom is correct, but the range of both people and techniques involved in those judgements is wide and the variance across judges determining cut-scores is large [2–5]. Well-known is the Angoff method in which groups of judges estimate the propor-tions of hypothetical minimally competent examinees who
would correctly answer each item. The mean of the proportions across all judges establishes the cut-score (henceforth: CS) [6]. Most other standard setting methods employ panels of experts who are asked to agree upon examination cut scores either by estimating the difficulty of the items, of the entire examination and/or estimating the acceptable pass/fail rates [1]. More advanced methods of this type provide the panellists with some psychometric parameters with which to facilitate or improve their judge-ment [7–10]. Alternative methods do not use panellists, but use the student examination marks to generate cut-scores, without any additional judgement [11–14]. The extent to which standards rely on, or are independent of, assessment data can vary even within implementations of the same method. To date no conclusive evidence is available to suggest which method is more accurate at identifying the cut-scores that best distinguish the competent from the incompetent examinees [4]). This is despite compelling evidence suggesting that when-ever two or more different methods are applied to
* Correspondence:[email protected]
1University of New South Wales Australia, Sydney, Australia
Full list of author information is available at the end of the article
the same examination data the cut-score are almost always different [15–21].
A common reason for the lack of validity evidence for standard setting methods is that almost all the research uses observed data (examination marks) and judges’ per-spectives to estimate cut-scores but information on the true abilities of students is rarely available. It is evident and well documented that different methods yield differ-ent cut-scores for the very same examination results with no evidence provided to suggest which method is superior to others [21]. If such data (the examinees’
‘true’ability) were available, there would be no need to set standards and cut-scores. Consequently, the quality of standard setting methods is commonly measured by the level of subjective agreement among judges, the reliability of the results, or the error of measurement of the yielded cut-scores [22–29].
A different approach for estimating the quality of stand-ard setting methods and the accuracy (deviation from the
‘true’ cut-score, however it is defined) of the yielded cut-scores is to apply standard setting methods to simulated datasets where the ‘true ability’ is predeter-mined [30, 31]. This type of research does not measure natural or observed phenomena but rather measures only the accuracy of a standard setting technique under a defined set of assumptions; as part of an evidence-based approach [32–34]. Overall, it is a challenge to find a standard setting model applicable to observed data, yet providing a measure of accuracy beyond just the agreement of judges.
The current paper introduces a method which pro-vides a partial solution to the abovementioned challenge. The main principles of this new method are: (1) it involves a panel of judges; (2) it assumes that the exam-ination score that denotes a‘clear pass’or a‘clear fail’is more concrete and easier to estimate [35] than the con-cept of ‘the proportion of minimally competent exam-inees who would give a correct answer to each of the items’ [6]; (3) by measuring two cut-scores (minimum score for clear pass (cP) and maximum score for clear fail (cF)) it doubles the number of data points, hence may provide more reliable cut-scores [36]; (4) the exam-ination cut-score means that if the examexam-ination were free of measurement- errors, every performance level below that cut-score indicates incompetence and any performance level at or above the cut-score indicates competence. Consequently, one could be classified as either competent or incompetent but never both or neither and ultimately a borderline mark/score is only given when the measurement is not accurate enough to provide a decisive pass/fail mark; and (5) the examin-ation cut-score is based on 95% confidence intervals (95%CI) calculated from the distributions of judges’ scores for cF and cP. The distributions are normalised,
and the cut point is at the optimal interface between the two distributions with the same z-scores for cF and cP. In other words, this new method yields a cut-score which is derived from the clear criteria estimates of the scores representing ‘clear pass’and‘clear fail’, which have been demonstrated to be reliable reference criteria [37].
Application of the new method
In a usual Angoff procedure, each person in a panel of judges reviews the examination, and estimates the pro-portion of minimally competent examinees likely to give the correct answer to each of the items. The scores across items and judges are then averaged to determine the cut-score. In our new method, the judges may also review each item; however, this is done to allow them to gauge the overall impression of the exam difficulty. With their knowledge of the examination difficulty, the student level and the curriculum, the judges answer the following two questions for the examination as a whole:
1. What would be the lowest score that indicates the examinee is without any doubt, clearly competent in the topics assessed?
2. What would be the highest score that indicates the examinee is without any doubt, clearly incompetent in the topics assessed?
The only data used in this method are the scores inde-pendently given by the judges in response to the above two questions.
Calculating the cut-score
Each judge provides two scores:
L = the highest score indicating the examinee is clearly incompetent.
H = the lowest score indicating the examinee is clearly competent.
From the collated scores (L & H), means of L and H (XL and XH respectively) and standard errors of the means (SELand SEHrespectively) are calculated.
The following equation is used to identify the Z score (Z) which would apply to both confidence intervals of XLand XHwhen they interface.
ZSEL þZSEH¼H−L ð1Þ
From (1) that we extract the Z:
Z¼ðH−LÞ=ðSEL þSEHÞ ð2Þ
indicates the level of confidence one may have in that cut-score being correct.
A demonstration of the method is presented below in Figs.1,2and3.
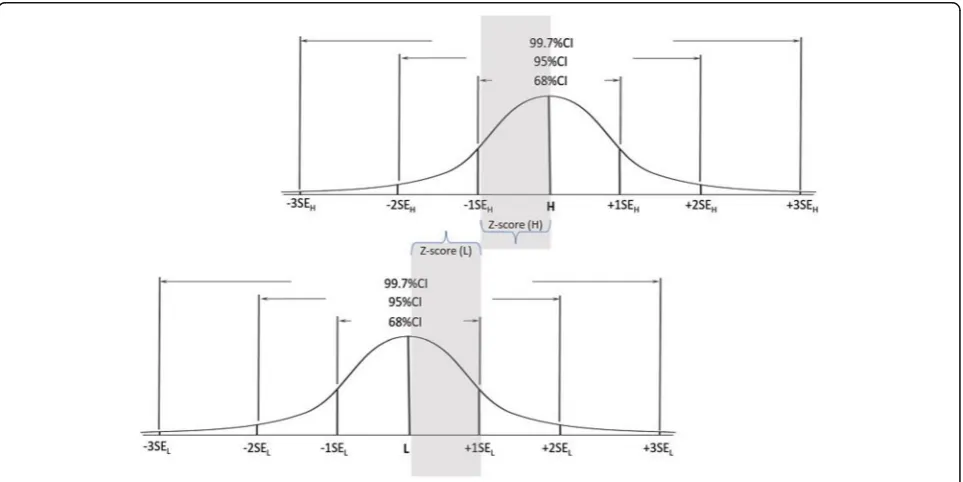
Figures 1 demonstrates a hypothetical situation when: SEL= SEH; and 1SEL+ 1SEH = H–L. In this demonstra-tion, SE sizes determine that there is 68% confidence that a score below the cut-score (CS) indicates incompe-tence and a score above the CS indicates compeincompe-tence. The CS is placed in the optimal location where the confidence that a score below it indicates incompetence, and a score above it indicate competence are equal (=68%). In this example both L and H are placed within 1 SE (SEL and SHH respectively) from the CS; and since SEL= SEH, CS -L = H-CS that is the CS is placed within the same distance from L and H.
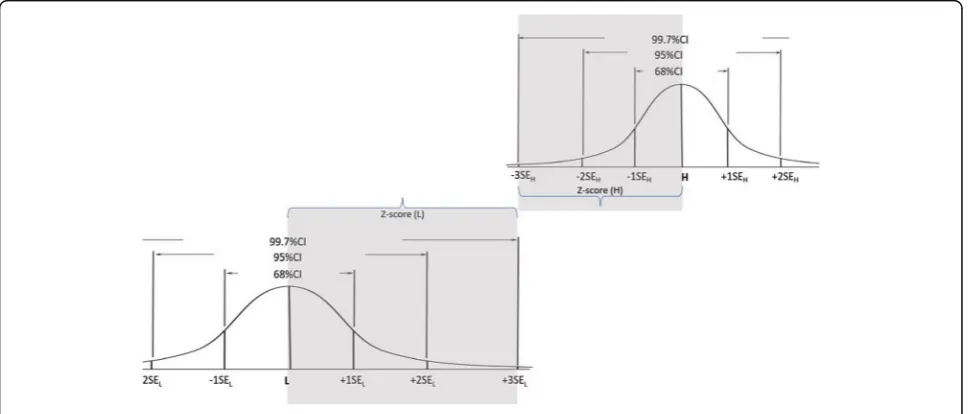
Figures 2 demonstrates a hypothetical situation when the SEs are not equal i.e. SEL< SEH; and the dis-tance of the L and H from the CS is 2 SEs (2SEL+ 2SEH = H–L). In this example the SE sizes determine the CS is placed in the optimal location where the confidence that a score below it indicates incompe-tence, and a score above it indicate competence are equal (=95%). In this example, both L and H are placed within 2 SE (SEL and SHH respectively) from the CS. However, unlike in Fig.1, in this example SEL< SEH,thus CS -L < H-CS, which then places the CS closer to L than to H. In this example it is clear that the exam-iners reached greater agreement about the value of L than about the value of H. It is noteworthy that although the CS is not in the middle between L and H, it is still in the
optimal location which yields the same confidence for competence and incompetence for scores above and below (respectively) the CS.
The third example (Fig. 3) demonstrates another hypothetical situation when the SEs are not equal, i.e. SEL > SEH, and the distance of L and H from the CS is 3 SEs (3SEL+ 3SEH = H – L). In this example the SE sizes determine that the CS is placed in the optimal location where the confidence that a score below it indicates incompetence, and a score above it indicates competence are equal (=99.7%). Similar to previous examples (Figs.1 & 2), in this example, both L and H are each placed within the same number of SEs (3SEL and 3SHH respectively) from the CS. However, in this example (Fig. 3) SEL > SEH, thus CS -L > H-CS, which then places the CS closer to H than to L. In this example it is clear that the examiners reached greater agreement about the value of H than about the value of L. Also, although the CS is not in the middle between L and H, it is still in the optimal location which yields the same confidence for competence and incompetence for scores above and below (respect-ively) the CS.
Of note is that the CS is always located in a place that equates the confidence that a score just under the CS indicates incompetence with the confidence that a score just above the CS indicated competence. The new method does not assume that the agreement among the assessors would be the same about thresholds for clear pass and clear fail; and no previous study supporting such an assumption (of equity) was identified.
This new method assumes that the judges’L’s and H’s are normally distributed. This assumption is reasonable should the judges composition be balanced [30]. If judges’ composition is not balanced then their judge-ment would be skewed irrespective of the method used, whether it was with this new method, Angoff, Abel, Bookmark or any other. Possible, yet partial remedies for heavily skewed scores are either to remove the extreme scores or applying bootstrapping to calculate robust SEs [38, 39]. These techniques may be useful also for other standard setting methods relying on SEs [26, 29, 39, 40]. Certainly, increasing the number of
judges is also likely to normalise the judges’ L and H scores’distribution.
This paper demonstrates and discusses the application and the feasibility of this new method.
Methods
For this feasibility study, we used 20 multiple choice questionnaire (MCQ) items taken from the final written examination used for medical students at an Australian university. This examination is set at the medical programme graduate level and the items were placed into a web-based survey.
Fig. 2Setting the cut score at the confidence level of 95%
Experienced clinical teachers who were familiar with the expected level of medical programme graduates were invited to participate in the study. The respondents pro-vided information on their level of training, gender and age, as well as responses to the following questions:
1. What would be the lowest score for the entire examination that would indicate that the examinee is without any doubts, clearly competent in the topic assessed?
2. What would be the highest score for the entire examination that would indicate that the examinee is without any doubts, clearly incompetent in the topic assessed?
Finally, respondents were asked to suggest a cut-score for the entire examination.
The study was approved by Human Research Ethics Advisory (HREA) Panel G: Health, Medical, Community and Social ref. # HC16181. Participants consented to complete the survey and then review the draft paper containing collated anonymised data.
Results
Seventeen participants participated in the questionnaire. This is an acceptable size for traditional Angoff pro-cesses applied in medical education [41–44].
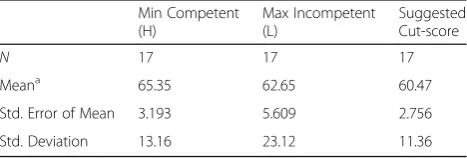
Table 1 shows the means and standard errors of the means of judges’scores for L and H, as well as their esti-mates for the exam as a whole.
The cut-score was calculated as per the description above with the H and L data from Table 1 in inserted into the equations.
Using eq. (1) Z* SEL + Z* SEH = H-L; Z*5.609 + Z*3.193 = 65.35–62.65 we calculatedZ = 0.307.
Consequently, using the data derived from L, the cut-score decided by the panel is L + Z* SEL = 62.65 + 0.307*5.609 =64.37.
The cut-score using the data derived from H is obvi-ously identical H- Z* SEH= 65.35–0.307*3.193 =64.37.
With Z = 0.307, the p value = 0.38 (based on a Z-table). This means there is only a 25% level confi-dence (areas under the normal curve around L, from the CS upwards =12.5%; and under the normal curve
around H from the CS downwards =12.5% [45]) that the cut-score of 64.37 correctly distinguishes between pass and fail based on judges’ reports. A cut-score > 64.37 wouldincreasethe confidence that a score above it is not fail but would decrease the confidence that a score below it is not pass and vice versa. In the absence of external valid information about student abilities, there is no other way to increase the confi-dence of both.
There is another potential way to calculate the 95%CI for the cut-score, which is relevant only when the |Z-score| < 1.96, as in these results (Z = 0.307). In this case the 95%CI of the L and the H are used. Given that one could be either competent or incompetent but cannot be neither or both it is clear that (H- 1.96 SEH) is the lowest 95%CI boundary of the score that would be acceptable by the examiners as clear pass. Thus any score < (H- 1.96*SEH) must indicate failure. Similarly, L + 1.96*SEL is the highest 95%CI boundary of the score that would be acceptable by the examiners as clear pass. Thus any score < L+ 1.96 SEL must indicate failure. Consequently, the 95%CI of the ANGOFF 2.0 given |Z-score| < 2 is: L+ 1.96 SEL to H- 1.96 SEH. Using the results presented in Table 1 the 95%CI of the cut-score between 59.09 and 73.64. It is important to note that the cut-score may not necessarily equal the mid-point between two boundaries of the 95%CI: the cut-score is 64.37 whereas the mid-point of the ANGOFF 2.0 95%CI is (59.09 + 73.64)/2 is 66.37. The reason is that the 95%CI of the cut-scoreis derived from two different and independent variances (the L and H scores were ob-tained independently. Nonetheless from the data in this study, the cut-score of 64.37 was only slightly different from the mid-point between L and H: (65.35 + 62.65)/2 = 64.00, but very different from the mean of the cut-scores as suggested by the very same judges (60.47).
Discussion
This study describes a new and feasible way to deter-mine cut-scores using a panel of judges. It is different from Angoff and modified Angoff methods in one major way. The Angoff method and its variants ask judges about the proportion of minimally competent examinees who would give a correct answer to each of the items. This is a complex cognitive process that requires the judges to make several decisions: identify what the min-imally competent examinee is; and the proportion of such hypothetical examinees that would correctly answer each item. These decisions are made on relatively vague criteria which may leave standard setters unsure of the standard’s reliability. The means of the proportions of this hypothetical minimally competent examinees who would correctly answer each item then determine the cut-score [6,46]. Furthermore, the empirical association
Table 1Descriptive statistics of judges’scores Min Competent
(H)
Max Incompetent (L)
Suggested Cut-score
N 17 17 17
Meana 65.35 62.65 60.47
Std. Error of Mean 3.193 5.609 2.756
Std. Deviation 13.16 23.12 11.36 a
between proportions of examinees and an examination cut-score has not been discussed in the literature, thus can at best be an arbitrary mechanism [1,47].
By contrast, our proposed method uses the judges’ estimates of level of performance. The judges may esti-mate the proportion of examinees who would correctly answer each item, but this exercise is used only to facili-tate judges’judgements and impressions of the examin-ation as a whole. These proportions derivedare not used to calculate the cut-score. The new method directly asks judges to determine cut-scores for the whole examin-ation, using practical concepts of ‘clear pass’ and ‘clear fail’ without referring to any hypothetical concept. As discussed above, having concrete points of reference or principles may enhance the accuracy of the determined cut-scores [48,49].
We found the cut-score determined by this new method was different from a cut-score yielded from a direct question asking about the desirable cut-score for an examination (Table 1). So which cut-score is more trustworthy? It has been demonstrated that the use of the categories of ‘clear pass’and ‘clear fail’better distin-guish between competent and incompetent examinees than the categories of ‘pass’ and ‘fail’ [37]. It is not unreasonable to conclude that a cut-score that uses the
‘clear pass’ and ‘clear fail’ as reference is more accurate than a cut-score that uses estimates of competence within the borderline range (e.g. estimations based on minimally competent examinees). Recent debate has suggested three mechanisms that explain variances among assessors’ judgements: (1) they apply assessment criteria incorrectly; (2) there are fundamental limitations in human cognition; and (3) assessors may be meaning-fully idiosyncratic and can make sense of complex and highly contextual situations which then lead to different outcomes, all of which are acceptable [50]. C St-Onge, M Chamberland, A Lévesque and L Varpio [51] echoed these assertions and suggested that it is mostly about a balance between external and internal/personal sources of information that impact assessors. The ImpExp model [52], for example, provides a detailed explanation of that process of responses to questions which overall indicates that variance among Angoff judges is unavoidable.
Our new method addresses the limitation of judges’ variance in a number of ways. First the method asks the judges to make judgements about what is clear (clear pass and clear fail) rather than what is vague (probability of correctly answering an item by a minimally competent examinee). What is a clear pass and what is a clear fail can be more easily agreed among assessors as these are based on principles that do not frequently change [49]. The data from the current study provide evidence for a difference between‘principle’based decisions (clear pass / clear fail) and decisions based on a vague reference (an‘estimate the
proportion of hypothetical minimally competent examinees who would correctly answer each item’[6]). Based on data generated from the same judges for the same set of items, the new method cut-score was 64.37 but the suggested cut-score when asked directly was 60.47, which is even lower than the L (62.65). It is also noted when using judges in standard setting processes variability across judges’cut scores is not a‘random error’in the sense of a typical measurement model [27]. That variability may be related to a range of biases derived from judges char-acteristics, opinions, expertise as well as other factors which should be considered rather than minimised [27, 30, 53, 54].
So what is the preferred cut-score? We believe that the new method cut-score is more trustworthy, firstly, as it is derived from mathematical principles, whereas the directly suggested cut-score is based on an overall im-pression of the examination difficulty and provides a less defensible cut score. Since asking examiners why they made each decision was not within the scope of the study this is a topic for future studies.
Secondly, the new method uses two points of reference (clear pass & clear fail) compared to only one (the ex-pected level of the minimally competent examinee) used by the traditional and modified Angoff methods. Overall the traditional Angoff and its variants use more data but can be expensive in time and money, whereas the new method uses less data but is quick and inexpensive.
Third, the new method considers two independent variances (Var (L) and Var(H)). Table 1 demonstrates that these variances were different (Var(L) > Var(H)), which indicates that the judges agreed more closely about what constitutes clear pass than what constitutes clear fail. A recent study demonstrated that even one extreme examiner may impact the pass/fail decisions [55]. The new method provides an inherent moderating mechanism for extreme judges as the cut-score is determined not only by the L and the H but also by the related variances. The use of two different variances determines a cut-score which is not necessarily at the mid-point between the H and the L (64.37 vs. 64.00 respectively). We suggest that this is a preferable out-come since the mid-point between the H and the L does not consider differences in agreement among judges.
cut-score should not be of concern since although the closer the H and the L are to each other the smaller the confidence is; a close gap between the L and the H is a desirable and defensible outcome as it is an indication that the judges believe the examination has a high discrimination value.
Conclusions
This feasibility study demonstrates how a revised Angoff method could generate a defensible cut-score. The dem-onstration was made on a limited sample of 17 judges examining 20 items only. Nonetheless the mathematical basis of the method is robust and thus suggests that it may be a feasible and defensible method for setting examination cut-scores. We anticipate that it would be applicable to most types of examinations which have an examination score and require a defensible cut-score. These could be examinations containing MCQs, OSCEs, short answers questionnaires etc. Further research, however, is required to identify how the new method compares to other methods and whether there are any limitations which have yet not been identified.
Abbreviations
cF:Clear fail; cP: Clear pass; H: High boundary of 95% confidence interval of the mean; L: Low boundary of 95% confidence interval of the mean; MCQ: Multiple choice questionnaire; SD: Standard deviation; SE: Standard error; Var: Variance; Z: Z-score
Availability of data and materials
Anonymised data are stored on UNSW secure server. Data are available by request conditional to the approval of UNSW ethics committee.
Authors’contributions
BS: Generated the concept, designed the study, undertook the statistical analysis and contributed to the writing. LC: Contributed to data collection, the interpretation of the data and to the writing. AD: Contributed to data collection, the interpretation of the data and to the writing. AF: Contributed to data collection, the interpretation of the data and to the writing. PJ: Contributed to data collection, the interpretation of the data and to the writing. SL: Contributed to data collection, the interpretation of the data and to the writing. PP: Contributed to data collection, the interpretation of the data and to the writing. JR: Contributed to data collection, the interpretation of the data and to the writing. TW: Contributed to data collection, the interpretation of the data and to the writing. PH: Contributed to data collection, development of the concept, the interpretation of the data and to the writing. All authors read and approved the final version of the manuscript.
Ethics approval and consent to participate
The study was approved by Human Research Ethics Advisory (HREA) Panel G: Health, Medical, Community and Social ref. # HC16181. All participants have consented in writing to participate in the study; the consents were informed.
Consent for publication
Not applicable.
Competing interests
The authors declare that they have no competing interests.
Publisher’s Note
Springer Nature remains neutral with regard to jurisdictional claims in published maps and institutional affiliations.
Author details
1University of New South Wales Australia, Sydney, Australia.2Cardiff
University, Cardiff, UK.3University of Exeter, Exeter, UK.4University of
Auckland, Auckland, New Zealand.5University of Texas, Austin, USA.
6University of Otago, Dunedin, New Zealand.
Received: 5 April 2017 Accepted: 23 May 2018
References
1. Cizek G, Bunch M. Standard setting: a guide to establishing and evaluating performance standards on tests. London: Sage Pubns; 2007.
2. Pell G, Roberts T. Setting standards for student assessment. Int J Res Method Educ. 2006;29(1):91–103.
3. Cusimano M. Standard setting in medical education. Acad Med. 1996;71(10): S112–20.
4. Ben-David M. AMEE guide no. 18: standard setting in student assessment. Med Teach. 2000;22(2):120–30.
5. Norcini J. Setting standards on educational tests. Med Educ. 2003;37(5):464–9. 6. Angoff W. Scales, norms, and equivalent scores. In: Thorndike R, editor.
Educational measurement. 2nd ed. Washington, DC: American council on education; 1971. p. 508–600.
7. Karantonis A, Sireci S. The bookmark standard-setting method: a literature review. Educ Meas Issues Pract. 2006;25(1):4–12.
8. Cizek G, Bunch M. The Bookmark Method. In: Cizek G, Bunch M, editors. Standard Setting. Thousand Oaks: SAGE Publications, Inc.; 2007. 9. Clauser B, Mee J, Baldwin S, Margolis M, Dillon G. Judges’use of
examinee performance data in an Angoff standard-setting exercise for a medical licensing examination: an experimental study. J Educ Meas. 2009;46(4):390–407.
10. Brandon P. Conclusions about frequently studied modified Angoff standard-setting topics. Appl Meas Educ. 2004;17(1):59–88.
11. Shulruf B, Turner R, Poole P, Wilkinson T. The objective borderline method (OBM): a probability-based model for setting up an objective pass/fail cut-off score for borderline grades in medical education programmes. Adv Health Sci Educ. 2013;18(2):231–44.
12. Hejri S, Jalili M, Muijtjens A, Van der vleuten C. Assessing the reliability of the borderline regression method as a standard setting procedure for objective structured clinical examination. J Res Med Sci. 2013;18(10):887–91. 13. Wood T, Humphrey-Murto S, Norman G. Standard setting in a small scale
OSCE: a comparison of the modified borderline-group method and the borderline regression method. Adv Health Sci Educ. 2006;11(2):115–22. 14. Cohen-Schotanus J, van der Vleuten C. A standard setting method with the
best performing students as point of reference: practical and affordable. Med Teach. 2010;32(2):154–60.
15. Poggio JP. An empirical investigation of the Angoff, Ebel and Nedelsky standard setting methods. In: Annual Meeting of theAmerican Educational Research Association Los Angeles; 1981.
16. Jalili M, Hejri S, Norcini J. Comparison of two methods of standard setting: the performance of the three-level Angoff method. Med Educ. 2011;45(12):1199–208.
17. Schoonheim-Klein M, Muijtjens A, Habets L, Manogue M, van der Vleuten C, van der Velden U. Who will pass the dental OSCE? Comparison of the Angoff and the borderline regression standard setting methods. Eur J Dent Educ. 2009;13(3):162–71.
18. George S, Haque S, Oyebode F. Standard setting: comparison of two methods. BMC Med Educ. 2006;6(1):46.
19. Humphrey-Murto S, MacFadyen JC. Standard setting: a comparison of case-author and modified borderline-group methods in a small-scale OSCE. Acad Med. 2002;77(7):729–32.
20. Buckendahl CW, Smith RW, Impara JC, Plake BS. A comparison of Angoff and bookmark standard setting methods. J Educ Meas. 2002;39(3):253–63. 21. Downing S, Tekian A, Yudkowsky R. Research methodology: procedures for
establishing defensible absolute passing scores on performance Examinations in Health Professions Education. Teach Learn Med. 2006;18(1):50–7. 22. Nichols P, Twing J, Mueller C, O'Malley K. Standard-setting methods as
measurement processes. Educ Meas Issues Pract. 2010;29(1):14–24. 23. Verhoeven B, Van der Steeg A, Scherpbier A, Muijtjens A, Verwijnen G, Van
24. Wilkinson T, Newble D, Frampton C. Standard setting in an objective structured clinical examination: use of global ratings of borderline performance to determine the passing score. Med Educ. 2001;35:1043–9. 25. Ricketts C, Freeman A, Coombes L. Standard setting for progress tests:
combining external and internal standards. Med Educ. 2009;43(6):589–93. 26. Hurtz G, Patrick J. Innovations in measuring rater accuracy in standard setting:
assessing“fit”to item characteristic curves. Appl Meas Educ. 2009;22(2):120–43. 27. Ping Y, Sconing J. Estimating standard errors of cut scores for item rating
and Mapmark procedures: a generalizability theory approach. Educ Psychol Meas. 2008;68(1):25–41.
28. Hambleton R, Slater SC. Reliability of credentialing examinations and the impact of scoring models and standard-setting policies. Appl Meas Educ. 1997;10(1):19–28.
29. Cusimano M, Rothman A. The effect of incorporating normative data into a criterion-referenced standard setting in medical education. Acad Med. 2003; 78(10):S88–90.
30. Shulruf B, Poole P, Wilkinson T, Weller J, Jones P. Insights into the Angoff method: results from a simulation study. BMC Med Educ. 2016;16:134. 31. Shulruf B, Poole P, Jones P, Wilkinson T. The objective borderline method
(OBM): a probabilistic method for standard setting. Assess Eval Higher Educ; 2014;40(3):420–38.
32. Dorans N. Simulate to understand models, not nature. ETS Res Rep Ser. 2014;2014(2):1–9.
33. Coombes L, Roberts M, Zahra D, Burr S. Twelve tips for assessment psychometrics. Med Teach. 2016;38(3):250–4.
34. Schuwirth L, van der Vleuten C. How to design a useful test: the principles of assessment. In: Swanwick T, editor. Understanding medical education: Evidence, Theory and Practice. Thousand Oaks: The Association for the Study of Medical Education; 2010. p. 195–207.
35. Hays R. Standard setting. Clin Teach. 2015;12(4):226–30.
36. Cizek G, Bunch M. The Hofstee and Beuk Methods. In: Cizek G, Bunch M, editors. Standard Setting: SAGE Publications, Inc.; 2007. p. 206–19. 37. McManus I, Thompson M, Mollon J. Assessment of examiner leniency and
stringency (‘hawk-dove effect’) in the MRCP(UK) clinical examination (PACES) using multi-facet Rasch modelling. BMC Med Educ. 2006;6(1):42.
38. Jockel K, Rothe O, Sendler W. Bootstrapping and related techniques. Berlin: Springer-Verlag; 1990.
39. Sireci S, Hauger WC, Shea C, Zenisky A. Evaluation of the standard setting on the 2005 grade 12 National Assessment of educational progress mathematics test. Appl Meas Educ. 2009;22(4):339–58.
40. Verhoeven B, Verwijnen G, Muijtjens A, Scherpbier A, van der Vleuten C. Panel expertise for an Angoff standard setting procedure in progress testing: item writers compared to recently graduated students. Med Educ. 2002;36(9):860–7.
41. Tannenbaum R, Kannan P. Consistency of Angoff-based standard-setting judgments: are item judgments and passing scores replicable across different panels of experts? Educ Assess. 2015;20(1):66–78.
42. Margolis M, Clauser B. The impact of examinee performance information on judges’cut scores in modified Angoff standard-setting exercises. Educ Meas Issues Pract. 2014;33(1):15–22.
43. Margolis M, Mee J, Clauser B, Winward M, Clauser J. Effect of content knowledge on Angoff-style standard setting judgments. Educ Meas Issues Pract. 2016;35(1):29–37.
44. Verheggen M, Muijtjens A, Van Os J, Schuwirth L. Is an Angoff standard an indication of minimal competence of examinees or of judges? Adv Health Sci Educ. 2008;13(2):203–11.
45. McPherson G. Applying and interpreting statistics: a comprehensive guide. 2nd ed. New York: Springer; 2001.
46. Cizek G, Bunch M. The Angoff method and Angoff variations. In: Cizek G, Bunch M, editors. Standard Setting. Thousand Oaks: SAGE Publications, Inc; 2007. p. 81–96. 47. Cizek G. Setting performance standards: foundations, methods, and
innovations. 2nd ed. London: Routledge; 2012.
48. Ma I, Pugh D, Mema B, Brindle M, Cooke L, Stromer J. Use of an error-focused checklist to identify incompetence in lumbar puncture performances. Med Educ. 2015;49(10):1004–15.
49. Apramian T, Cristancho S, Watling C, Ott M, Lingard L. Thresholds of principle and preference: exploring procedural variation in postgraduate surgical education. Acad Med. 2015;90(11 Association of American Medical Colleges Medical Education Meeting):S70–6.
50. Gingerich A, Kogan J, Yeates P, Govaerts M, Holmboe E. Seeing the‘black box’differently: assessor cognition from three research perspectives. Med Educ. 2014;48(11):1055–68.
51. St-Onge C, Chamberland M, Lévesque A, Varpio L. Expectations, observations, and the cognitive processes that bind them: expert assessment of examinee performance. Adv Health Sci Educ. 2016; 21(3):627–42.
52. Shulruf B, Hattie J, Dixon R. Factors affecting responses to Likert type questionnaires: introduction of the ImpExp, a new comprehensive model. Soc Psychol Educ. 2008;11(1):59–78.
53. Busch J, Jaeger R. Influence of type of judge, normative information, and discussion on standards recommended for the National Teacher Examinations. J Educ Meas. 1990;27(2):145–63.
54. Houston W, Raymond M, Svec J. Adjustments for rater effects in performance assessment. Appl Psychol Meas. 1991;15(4):409–21. 55. Fuller R, Homer M, Pell G, Hallam J. Managing extremes of assessor
judgment within the OSCE. Med Teach. 2016;39(1):58–66.