BMC Gastroenterology 2001,
1 :14
Research article
Changes in anti-viral effectiveness of interferon after dose reduction
in chronic hepatitis c patients: a case control study
Frank C Bekkering
1
, Avidan U Neumann
2
, Johannes T Brouwer
1
,
Rachel S Levi-Drummer
2
and Solko W Schalm*
1
Address: 1Dept. of Hepatology & Gastroenterology, University Hospital Rotterdam, the Netherlands and 2Faculty of Life Sciences, Bar-Ilan University, Ramat-Gan, Israel
E-mail: Frank C Bekkering - [email protected]; Avidan U Neumann - [email protected];
Johannes T Brouwer - [email protected]; Rachel S Levi-Drummer - [email protected]; Solko W Schalm* - [email protected] *Corresponding author
Abstract
Background: High dose interferon induction treatment of hepatitis C viral infection blocks viral production over 95%. Since dose reduction is often performed due to clinical considerations, the effect of dose reduction on hepatitis C virus kinetics was studied.
Methods: A new model that allowed longitudinal changes in the parameters of viral dynamics was used in a group of genotype-1 patients (N = 15) with dose reduction from 10 to 3 million units of interferon daily in combination with ribavirin, in comparison to a control group (N = 9) with no dose reduction.
Results: Dose reduction gave rise to a complex viral kinetic pattern, which could be only explained by a decrease in interferon effectiveness in blocking virion production. The benefit of the rapid initial viral decline following the high induction dose is lost after dose reduction. In addition, in some patients also the second phase viral decline slope, which is highly predictive of success of treatment, was impaired by the dose reduction resulting in smaller percentage of viral clearance in the dose reduction group.
Conclusions: These findings, while explaining the failure of many induction schedules, suggest that for genotype-1 patients induction therapy should be continued till HCVRNA negativity in serum in order to increase the sustained response rate for chronic hepatitis C.
Background
The hepatitis C virus (HCV) causes a slowly progressive liver disease, which may lead to cirrhosis, liver failure and liver cancer. Currently, about 10,000 patients die in the US from HCV related disease yearly and this number is ex-pected to triple in the next 2–3 decades [1] Anti-viral ther-apy is successful in arresting the progression of the disease
in those patients who reach a sustained clearance of the vi-rus, currently only 40% of treated patients [2]. Response to therapy with alpha Interferon injections thrice a week with or without additional Ribavirin is thought to occur gradually over time, and research has focused on improv-ing efficacy by prolongimprov-ing treatment up to 1 to 2 years [2– 4]. However, reports on viral dynamics analysis show that
Published: 13 December 2001
BMC Gastroenterology 2001, 1:14
Received: 11 October 2001 Accepted: 13 December 2001
This article is available from: http://www.biomedcentral.com/1471-230X/1/14
response to interferon is very fast and that a 10 to 1000 fold decrease in viral load can be reached within 24 hours of treatment. [5–7] The pattern of viral decline seems to be biphasic, with a rapid viral decline within the first 24– 48 hours followed by a much slower second phase of viral decline. This biphasic decline is hypothetically caused by a direct anti-viral effect of interferon in blocking virion production from infected cells [5].
A strong dependence of the viral decline in the first phase on the dose of interferon used has been described [5,8]. Nevertheless, it has been shown that it is the second slope which is the best predictor for response to treatment [5,9]. This slower second phase slope of viral decline has large variability between patients, and therefore cross sectional analysis of its dose dependence is hindered. Instead, here we investigated the longitudinal changes in viral dynamics in patients going through a dose reduction in order to ass-es the effect of dose on the second slope. The current mod-el for HCV dynamics, in which the dynamical parameters are fixed during treatment, fits the observed biphasic viral decline in patients treated with fixed Interferon dosages [5]. However, in this study we adapted the model such that the dynamical parameters can change over time due to a change in dose. We now report that early dose reduc-tion is followed by a rise in viral load, that can only be ex-plained by a decrease in interferon effectiveness; so the potential benefit of a rapid viral decline following high dose induction is often lost.
Methods
A case-control study was performed in an university-based tertiary referral center. Informed consent was obtained from all patients, and the human experimentation guide-lines of the University Hospital Rotterdam were followed in the conduct of clinical research.
Study population
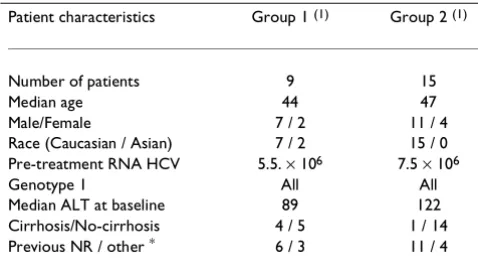
All 24 HCV genotype-1 patients enrolled in our high-dose induction studies were evaluated. All patients met the in-clusion and exin-clusion criteria previously described [10]. Note that all patients in these studies were considered "difficult-to-treat", either because they were non-respond-ers to previous treatment or had cirrhosis and/or high baseline viral load. Group 1 patients (N = 9) received 10 million units (MU) of Interferon-α-2b (Intron-A, Scher-ing-Plough) daily for 4 weeks. Group 2 patients (N = 15) received 10 MU of interferon daily for the first 3 days only, followed by 3 MU interferon daily from day 3 until day 28. In both groups, ribavirin was given orally in divided doses of 1,000–1,200 mg daily (according to weight >75 kg). Subsequently, all patients received a maintenance treatment of minimally 3 MU interferon daily for 52 weeks. The patients' baseline characteristics (Table 1) were well balanced, except for a trend for larger number of cir-rhotic patients in group 1.
Detection of Serum HCV RNA
Plasma samples were collected frequently during the first 4 weeks of treatment for HCV RNA detection. Blood sam-ples were collected in Vacutainer PPT tubes (Becton-Dick-inson) which were spun directly after collection in order to avoid RNA breakdown. The spun PPT tubes [11] were then transported to the virology department where plas-ma was aliquotted in 5 separate tubes that were stored at -80°C. Plasma samples were obtained at day 0 (0, 4, 8, 12, 16 hours), day 1 (24, 32 and 40 hours), day 2 (48 and 56 hours), day 3 (72 and 80 hours) day 4, 5, 6 7, 10, 14, 17, 21 and 28 after treatment initiation. Viral load was quan-tified using the Cobas Amplicor Monitor™ version 2 (Ro-che Molecular Systems). Since the linearity of quantitative assays for high numbers of viral copies has been question-able [12] we routinely diluted samples and re-tested, if the early quantification of that sample was higher than 106
copies/ml.
Mathematical Modeling
Viral kinetics were analyzed using a modification of a pre-viously described mathematical model for viral dynamics [5], for which the analytical solution is,
V(t) = V0 {A exp[-λ1(t - t0)] + (1 - A) exp[-λ2(t - t0)]} for (t > t0) (Eq. 1)
Where
λ1,2 = 1/2 {(c + δ) ± [(c - δ)2 + 4(1 - ε)(1 - H) cδ]1/2}
(Eq. 2)
A = (εc - λ2)/(λ1 - λ2) (Eq. 3)
This formula contains several dynamical parameters (c, δ, H and ε) which may vary per patient according to the best fit of the actual data, but are constant over time. c
de-Table 1: Patient baseline characteristics.
Patient characteristics Group 1 (1) Group 2 (1)
Number of patients 9 15
Median age 44 47
Male/Female 7 / 2 11 / 4
Race (Caucasian / Asian) 7 / 2 15 / 0
Pre-treatment RNA HCV 5.5. × 106 7.5 × 10⁶
Genotype 1 All All
Median ALT at baseline 89 122
Cirrhosis/No-cirrhosis 4 / 5 1 / 14
Previous NR / other * 6 / 3 11 / 4
*) Non-sustained responder to previous therapy or previously
scribes the clearance rate of free virus, with the corre-sponding virus half-life of ln(2)/c. δ describes the loss rate of productively infected cells, with the corresponding cel-lular half-life of ln(2)/δ. The effect of interferon can be modeled here either by a block of de-novo cell infection with effectiveness H (0 ≤ H ≤ 1), or block of virion produc-tion with effectiveness ε (0 ≤ε≤ 1). The logarithmic drop in viral decline during the first phase (24–48 hours) of treatment can be approximated by log(1-ε). The 2nd phase
slope can be approximated by ε times δ when H << 1, or by δ alone when H ≅ 1.
To investigate the effect of reducing treatment dose, all the above dynamical parameters were allowed to change over time in the solution, e.g. for interferon effectiveness in blocking virion production, ε, we use the function ε (t) :
for t ≤ t1 : ε(t) = ε1 (Eq. 4)
for t > t1 : ε (t) = (ε1 - ε2) exp(-k(t - t1)) + ε2
where t1 is the time of dose change and k is a exponential rate representing how rapid does the change in interferon dose effect the change in the parameter. Thus, the block-ing effectiveness starts at ε1 (for t ≤ t1), and changes with an exponential transition to ε2 (after (t-t1) >>1/k). The
same functional form was used to investigate changes in H (from H1 to H2), δ (from δ1 to δ2), and c (from c1 to c2).
It is important to note that we do not explicitly model in Eq. 1 the dynamics of viral replication after the dose re-duction, but rather replace the fixed parameters by time dependent parameters in the original analytical solution obtained with fixed parameters. Nevertheless, we have tested this approximation by simulating a modification of the original differential equation model [5] where chang-es in the dynamical parameters were allowed to change at the time of dose reduction. We found no significant differ-ence between the simulation of the full modified differen-tial equation model and the modified analytical solution. Since we only have 2–3 viral measurements immediately after dose reduction, we can not estimate the appropriate replication parameters and thus chose to use the simple approximation given in Eq 1.
To estimate HCV viral kinetic parameters for each patient, the logarithm of V(t) in Eq. 1 (using ε (t) from Eq. 4) was fit to the logarithm of the viral load data by a non-linear least squares method using the Madonna software (R.I. Macey and G.F. Oster, Berkeley, CA, USA). Two patients in group 2 were missing viral load data during the first week of treatment and one patient had a null response (less than 3 fold change in viral load during treatment) and therefore their viral kinetics could not be fitted.
Statistical analysis
The Fisher-exact test (2 × 2 tables) and the Chi-square test (N × N tables) were used to determine the statistical sig-nificance of the distribution of categorical variables be-tween groups. The non-parametric independent (or related) Mann-Whitney rank sum test was used to deter-mine the statistical significance of differences in continu-ous variables between the two groups (or of changes in the parameters within the same patients). Correlation among parameters, or between parameters and baseline values, was evaluated using the Spearman non-parametric test. Significance was established at P < 0.05.
Results
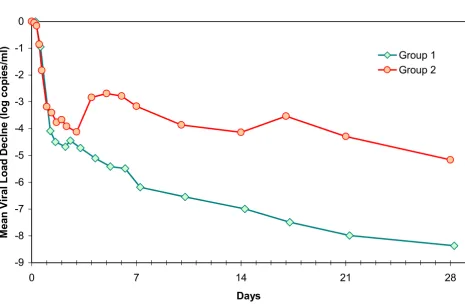
The biphasic decline previously reported [5–7,13] de-scribes the viral kinetics during the first month for all pa-tients in group 1 (Fig 1, Fig 2a), for whom interferon dose was kept constant. In contrast, we observed a complex dy-namic pattern for 11 out of 12 evaluable patients in group 2 (Fig 1, Fig 2b,c,d). In these patients, a rapid decline oc-curred during the first day, followed by a slower decline on the second and third days, at which point a rapid in-crease in viral load (mean 0.8 [range 0–1.3] log copies/ ml) is observed within 24–48 hours after the reduction in interferon dose. Thereafter, viral load again declined with a mean exponential slope comparable to the second phase slope in group 1.
We have tried to fit the viral kinetics of the patients in group 2 with several models, in each one of them allow-ing to change one parameter (ε, H, c or δ) at the time of dose reduction. The only model that was able to qualita-tively reproduce the observed kinetics was the one which allowed a longitudinal change in the interferon effective-ness in blocking virion production (ε) as function of the interferon dose (Eq. 4). By only allowing to change the in-terferon effectiveness in blocking de-novo infection (H), death rate of infected cells (δ) or the clearance rate of free virions (c), it was not possible to fit the observed data. When assuming the major effect of interferon is to block virion production in a dose dependent way (1 > ε1 > ε2 > 0), it was possible to fit the data both with H = 0 or H = 1. Thus it was not possible to determine if interferon also blocks de-novo infection, in addition to blocking virion production, or not. Varying H between 0 and 1 only gives rise to minimal changes in the estimate of ε and c, while somewhat affecting the estimate of δ when ε is smaller than 0.98 (minimal estimate of δ obtained for H = 1, and maximal estimate for H = 0). Moreover, when allowing ε to change at the time of dose reduction, it was not possi-ble to rule out that the other parameters also change at the same time.
as-sumed a change occurs only in ε when estimating the dynamical parameters. In addition, we needed to estimate the transition rate k (Eq. 4) from ε1 to ε2. It was not pos-sible to get a unique estimate of k for each patient individ-ually, with only 2–3 measurements during the rebound. Since using k = 1 up to 20 did not significantly affect the estimate of the other parameters, we have assumed k = 2 for all patients such that the effect of ε1 vanishes within 24–48 hours after the dose reduction in accordance to the observed data.
The estimates obtained by non-linear fitting of each pa-tient's viral kinetics individually are given in Table 2. As expected the baseline viral load, the half-life of free virions
and the initial effectiveness in blocking virion production, all related to the first phase decline, were similar between the 2 groups. Mean half-life of free virions for all patients was 3.0 hours ± standard deviation of 1.6 hours, similar to that derived in previous studies for interferon-α mono-therapy (2.7 hours) [5]. The mean effectiveness in block-ing virion production for all patients was 95.6% ± 6.5% for the 10 MU interferon dose. For group 1 the non-linear fit (with Eq. 4) did not give rise to a significant change in
ε over time, in accordance to the constant daily interferon dose used in these patients (insert Fig 2a). For group 2, however, a significant (p < 0.005) decrease in effectiveness of blocking production was observed (inserts Fig 2b,c,d, Figure 1
Group 1 (N = 9) received a continues dose of 10 MU INTERFERON daily for 28 days. Group 2 (dose reduction group, N = 15) reduced from 10 MU INTERFERON daily to 3 MU INTERFERON daily after 3 days of treatment. After the viral load data was log-transformed, the geometric means were calculated for the 2 groups for each time-point of viral load measurement. The created mean viral for group 1 clearly shows a biphasic decline in viral load as previously described for chronic HCV. Viral decline in the patients with a INTERFERON dose reduction (line Group 2) is more complex: a rebound in viral load is observed coinciding with the time of INTERFERON dose reduction.
-9 -8 -7 -6 -5 -4 -3 -2 -1 0
0 7 14 21 28
Days
M
ean V
i
r
a
l
Load De
clne (l
og co
pi
es/
m
l
)
Group 1
Fig 3a) from an average of ε1 = 94% ± 8% to ε2 = 69% ± 27%. The effectiveness of interferon with 10 MU (ε1) and with 3 MU (ε2) were pair wise correlated (R = 0.8, P <
0.001).
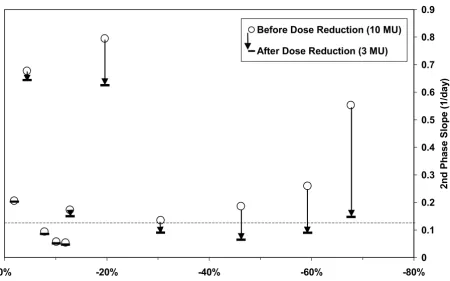
Cross-sectionally there was no difference observed be-tween the 2 groups in the death rate of infected cells (Ta-ble 2) or in the second phase slope (Fig 3b). However, longitudinal analysis of group 2 patients revealed a signif-icant decrease from the predicted second phase slope, which would have occurred without a dose reduction, to the actual slope after dose reduction in 4 out of 12
pa-tients (Fig 4a). These are the papa-tients with the largest de-crease (range 20% to 68%) from ε1 to ε2, since the second slope is a linear function of the interferon effectiveness in blocking production (ε).
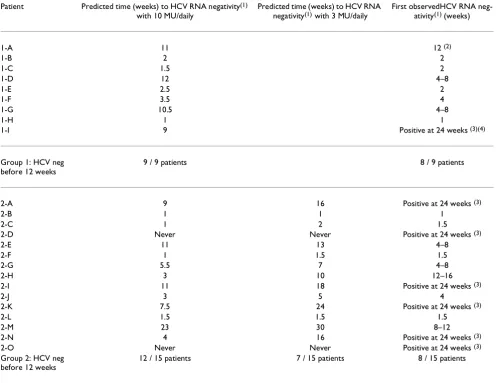
The clinical consequences of the viral dynamics data relate to the predicted time of HCV RNA negativity, which is strongly dependent on the second phase slope. The pre-dicted time to HCV-negativity with the biphasic model (median 3.5 weeks) was confirmed by the observed indi-vidual data of group 1 patients (median 4 weeks), and the dose-reduction model (with the reduced 3 MU dose) pre-Figure 2
In figure 2a the actual viral load measurements (red dots) and the fitted viral decline curve using Eq. 1 (black line) is presented of one of the patients (No 1-I) who receive 10 MU INTERFERON daily for 28 days. The actual decline in viral load in this patient is best described by the original bi-phasic model. In figure 2b,c,d the actual viral load (red dots) and the fitted viral decline using the modified model allowing for a change in INTERFERON efficacy as described in Eq.5 is presented (black line). The actual viral decline could only be correctly fitted by using our modified model. The red lines represent the calculated bi-phasic decline curve for a continues 10 MU INTERFERON regimen in the patients of group 2 by fitting only the observed viral load during the treatment period of 10 MU daily in the original model. The green line represents the calculated viral decline curve as if a continues treatment of 3 MU INTERFERON daily was given from the start of treatment (only the viral load during 3 MU INTERFERON are fitted). Note that the difference in the slope between the calculated decline curves for 10 MU versus 3 MU (red versus green lines) is dependent on the change in interferon efficacy after dose reduction (inserts). Patients 2-H was calculated to become HCV RNA negative within 14 days if 10 MU INTERFERON was continued (red line figure 2-d), but after dose reduction the actual viral decline curved shifted dramatically due to a strong decline in INTERFERON efficacy (green line).
0 7 14 21 28
Days
0% 25% 50% 75% 100%
0 7 14 21 28
Days
%Blocking
Patient 2-J
0% 25% 50% 75% 100%
0 7 14 21 28
Days
%Blocking
3 4 5 6 7 8
0 7 14 21 28
Days
HCV-RNA (log copies/ml)
0% 25% 50% 75% 100%
0 7 14 21 28
Days
%Blocking
3 4 5 6 7 8
HCV-RNA (log copies/ml)
0% 25% 50% 75% 100%
0 7 14 21 28
Days
%Blocking
Patient 2-H Patient 1-I
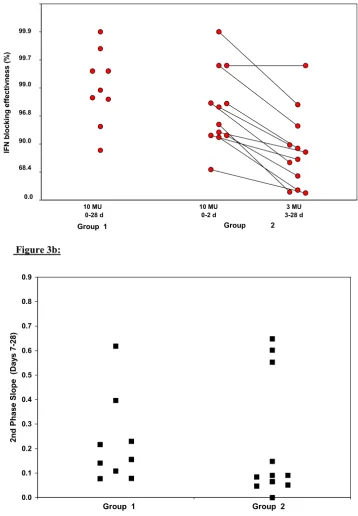
Figure 3
Figure 3a. Interferon efficacy in blocking production (%) is displayed for group 1 and group 2 (logarithmic scale). For the patients that received a dose reduction after 3 days of treatment (group 2), both the efficacy for the initial, 10 MU INTER-FERON daily period, is displayed as well as the reduced efficacy after the dose reduction to 3 MU daily. Note that the initial interferon efficacy between group 1 and 2 does not differ. After the dose reduction the interferon efficacy is reduced in 11/12
patients in group 2 (connected black dots). Figure 3b. The slopes of the second phase decline (days-1) is represented per
patient (black squares) for both groups. No differences between both groups could be observed in this study.
Figure 3b:
I
F
N
b
l
ocking
effe
ctiv
ness (%
)
10 MU 0-28 d
10 MU 0-2 d 0.0
90.0 99.9
68.4 96.8 99.7
Group
3 MU 3-28 d
Group 1 99.0
2
0.0 0.1 0.2 0.3 0.4 0.5 0.6 0.7 0.8 0.9
2nd P
h
a
se S
l
ope
(
D
ay
s
7-28)
dicted the time to HCV-negativity in group 2 patients (me-dians 12 and 14.5 weeks, Table 3). Reducing the interferon dose to 3 MU daily decreased the predicted number of patients that would become HCV-negative within 12 weeks from 12/15 with the 10 MU dose to only 7/15 with the reduced 3 MU dose, as indeed confirmed by the actual individual data (8/15).
Discussion
Our results indicate that the effect of interferon dose re-duction on viral dynamics can be completely attributed to decrease in the effectiveness of interferon in blocking
vir-ion productvir-ion (ε). Changes in other parameters, such as blocking de-novo infection (H) loss rate of infected cells (δ) and clearance rate of free virions (c), without a change in blocking production, can not reproduce the observed kinetics. The longitudinal dose dependence of the inter-feron anti-viral effectiveness observed here corroborates the dose dependence of interferon effectiveness previous-ly described onprevious-ly cross-sectionalprevious-ly [5]. The strength of the current results is that the dose dependence of the effective-ness cannot be attributed to baseline differences between the patients. Since longitudinal changes in the other pa-rameters of this model (such as H, δ and c) do not give rise
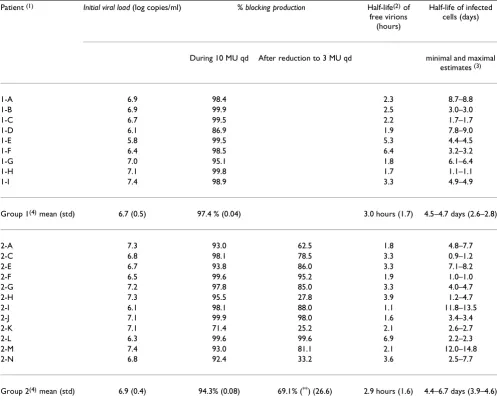
Table 2: Results of non-linear fitting of viral dynamics
Patient (1) Initial viral load (log copies/ml) % blocking production Half-life(2) of
free virions (hours)
Half-life of infected cells (days)
During 10 MU qd After reduction to 3 MU qd minimal and maximal
estimates (3)
1-A 6.9 98.4 2.3 8.7–8.8
1-B 6.9 99.9 2.5 3.0–3.0
1-C 6.7 99.5 2.2 1.7–1.7
1-D 6.1 86.9 1.9 7.8–9.0
1-E 5.8 99.5 5.3 4.4–4.5
1-F 6.4 98.5 6.4 3.2–3.2
1-G 7.0 95.1 1.8 6.1–6.4
1-H 7.1 99.8 1.7 1.1–1.1
1-I 7.4 98.9 3.3 4.9–4.9
Group 1(4) mean (std) 6.7 (0.5) 97.4 % (0.04) 3.0 hours (1.7) 4.5–4.7 days (2.6–2.8)
2-A 7.3 93.0 62.5 1.8 4.8–7.7
2-C 6.8 98.1 78.5 3.3 0.9–1.2
2-E 6.7 93.8 86.0 3.3 7.1–8.2
2-F 6.5 99.6 95.2 1.9 1.0–1.0
2-G 7.2 97.8 85.0 3.3 4.0–4.7
2-H 7.3 95.5 27.8 3.9 1.2–4.7
2-I 6.1 98.1 88.0 1.1 11.8–13.5
2-J 7.1 99.9 98.0 1.6 3.4–3.4
2-K 7.1 71.4 25.2 2.1 2.6–2.7
2-L 6.3 99.6 99.6 6.9 2.2–2.3
2-M 7.4 93.0 81.1 2.1 12.0–14.8
2-N 6.8 92.4 33.2 3.6 2.5–7.7
Group 2(4) mean (std) 6.9 (0.4) 94.3% (0.08) 69.1% (**) (26.6) 2.9 hours (1.6) 4.4–6.7 days (3.9–4.6)
1) Fitting was not done for: patients 2-B (non-detectable at day 2 on), 2-D (Null-response), 2-O (missing data and rebound). 2) For group 1 half-life of free virions is only a maximal estimate because only samples from 0, 8 and 24 hours were available. 3) Minimal and maximal estimates of the half-life of infected cells was estimated assuming H = 1 and H = 0 respectively in Eq 2. 4) No statistically significant differences in any parameter between
to significant differences in the kinetics, we can not rule out combined effects of changes in the other parameters concomitantly with the change in effectiveness of block-ing production (ε).
In turn, the dose dependency of the interferon effective-ness determines the result of both the 1st phase and the
2nd phase kinetics. The effectiveness in blocking virion
production with 10 MU before dose reduction (mean 95.6% and a mean viral decline of 1.8 log cp/ml) was sim-ilar to that of a previous study with 10 MU interferon (96%) [5]. However, we show that the benefit of the ini-tial viral decline due to 3 days of high induction dose was lost after the dose reduction in almost all patients (Fig 1, 3). The effectiveness in blocking virion production with 3
MU after the dose reduction (mean 69.1% and a mean vi-ral decline of 0.7 log cp/ml) was similar to that estimated in a previous study with 3 MU interferon initially (70%) [8]. As a consequence, the viral kinetics after the dose re-duction in group 2 patients is similar to the kinetics that would have been obtained if the patients had started with the reduced dose to begin with (green line Fig 2).
In contrast to the 1st phase viral decline, which
exponen-tially depends on the interferon effectiveness, the 2nd
phase slope is a linear function of the effectiveness in blocking virion production. This slope is the most predic-tive parameter for treatment outcome, with a threshold of 0.13 days-1 below which no sustained response was
ob-served [5] While the increase obob-served in viral load imme-Figure 4
The effect of the change in interferon efficacy after the dose reduction (x-axis) for the patients in group 2 is related to the change in slope of the second phase viral decline (open circles: second phase slope before dose reduction; horizontal lines: sec-ond phase slope after dose reduction). In 4 patients the slope of the second phase reduces drastically, note that 3/4 of these patients have the largest reduction in interferon efficacy. The dashed line reflects the threshold of 0.13 days-1 below which no
sustained response was observed.
0 0.1 0.2 0.3 0.4 0.5 0.6 0.7 0.8 0.9
-80% -60%
-40% -20%
0%
Change in %Blocking of Virion Production after Dose Reduction
2nd
Phase
S
l
ope (1/
day
)
Before Dose Reduction (10 MU)
diately after dose reduction can delay the time to negativity by several weeks at the most (patients J and 2-C Fig 2), the decrease in the second phase slope can radi-cally reduce the chance for HCV-RNA negativity (patient 2-H Fig 2). Therefore the decrease in the second slope could be crucial for their success of treatment. Indeed, the number of patients predicted to become HCV-negative within 12 weeks with the high induction dose was drasti-cally reduced due to the dose reduction (compare the 10 MU column versus 3 MU column in Table 3).
Interestingly, the results obtained here are for interferon and ribavirin combination treatment, while the results from previous studies [5,8] are for interferon monothera-py. On the other hand, in this study most patients are
non-responders or cirrhotic rather than normal naïve pa-tients as in the previous studies [5,8]. Thus, we can not conclude if ribavirin has an additive effect on initial viral decline or not.
Is induction treatment beneficial at all considering that following dose reduction the virus rebounds back to the level it would reach anyway with the reduced dose? Previ-ous studies with a longer period of induction treatment (14 days) do not show a consistent viral rebound as ob-served here [14]. Moreover, studies of prolonged induc-tion treatment (> 28 days) do not show any re-emergence of virus production [15]. Therefore, it could be suggested that an induction period of 3 days is too short, but longer induction periods, which continue until HCVRNA
nega-Table 3: Predicted and observed time to HCV RNA negativity
Patient Predicted time (weeks) to HCV RNA negativity(1)
with 10 MU/daily
Predicted time (weeks) to HCV RNA
negativity(1) with 3 MU/daily
First observedHCV RNA
neg-ativity(1) (weeks)
1-A 11 12 (2)
1-B 2 2
1-C 1.5 2
1-D 12 4–8
1-E 2.5 2
1-F 3.5 4
1-G 10.5 4–8
1-H 1 1
1-I 9 Positive at 24 weeks (3)(4)
Group 1: HCV neg before 12 weeks
9 / 9 patients 8 / 9 patients
2-A 9 16 Positive at 24 weeks (3)
2-B 1 1 1
2-C 1 2 1.5
2-D Never Never Positive at 24 weeks (3)
2-E 11 13 4–8
2-F 1 1.5 1.5
2-G 5.5 7 4–8
2-H 3 10 12–16
2-I 11 18 Positive at 24 weeks (3)
2-J 3 5 4
2-K 7.5 24 Positive at 24 weeks (3)
2-L 1.5 1.5 1.5
2-M 23 30 8–12
2-N 4 16 Positive at 24 weeks (3)
2-O Never Never Positive at 24 weeks (3)
Group 2: HCV neg before 12 weeks
12 / 15 patients 7 / 15 patients 8 / 15 patients
tivity in serum, might give rise to continuous suppression of viral replication. In all likelihood this concept may partly explain the increased efficacy of pegylated interfer-on [16,17] since the rather cinterfer-onstant interferinterfer-on levels with this type of interferon result in a constant block of virus production.
Conclusions
Dose reduction to 3 MU daily after 3 days of 10 MU of in-terferon daily in HCV genotype-1 patients negated the ex-tra virus suppressive effectiveness of the induction dose. These observations, while explaining the failure of many induction schedules suggests that induction therapy should be continued till HCV RNA negativity in serum in order to increase the sustained response rate in chronic hepatitis C.
Competing interests
Frank Bekkering: none declared
Avidan Neumann: none declared
Johannes Brouwer: received grant support from Schering Plough International
Rachel Levi-Drummer: none declared
Solko Schalm: received grant support from Schering Plough International
Acknowledgments
We thank Dr. Raj Reddy for fruitful discussions.
Presented in part: 51st annual meeting of the American Association for the Study of Liver Diseases, Dallas, 27–31 October 2000 (Bekkering FC, Neu-mann AU, Levi-Drummer R, Brouwer JT, Schalm. SW. In-vivo longitudinal changes in anti-viral effectiveness of interferon after dose reduction in chronic hepatitis C patients. Hepatology 2000;32:367A).
Financial support: Schering Plough International, Kenilworth, NJ.
References
1. Alter MJ: Epidemiology of hepatitis C.Hepatology 1997, 26 :62S-65S
2. McHutchison JG, Gordon SC, Schiff ER, Shiffman ML, Lee WM, Rustgi VK, Goodman ZD, Ling MH, Cort S, Albrecht JK: Interferon alfa-2b alone or in combination with ribavirin as initial treatment for chronic hepatitis C. Hepatitis Interventional Therapy Group.N Engl J Med 1998, 339:1485-1492
3. Lin R, Roach E, Zimmerman M, Strasser S, Farrell GC: Interferon alfa-2b for chronic hepatitis C: effects of dose increment and duration of treatment on response rates. Results of the first multicentre Australian trial. Australia Hepatitis C Study Group.J Hepatol 1995, 23:487-496
4. Poynard T, Marcellin P, Lee SS, Niederau C, Minuk GS, Ideo G, Bain V, Heathcote J, Zeuzem S, Trepo C, Albrecht J: Randomised trial of interferon alpha2b plus ribavirin for 48 weeks or for 24 weeks versus interferon alpha2b plus placebo for 48 weeks for treatment of chronic infection with hepatitis C virus. In-ternational Hepatitis Interventional Therapy Group (IHIT). Lancet 1998, 352:1426-1432
5. Neumann AU, Lam NP, Dahari H, Gretch DR, Wiley TE, Layden TJ, Perelson AS: Hepatitis C viral dynamics in vivo and the
antivi-ral efficacy of interferon-alpha therapy.Science 1998, 282 :103-107
6. Bekkering FC, Brouwer JT, Leroux-Roels G, Van Vlierberghe H, Ele-waut A, Schalm SW: Ultrarapid hepatitis C virus clearance by daily high-dose interferon in non-responders to standard therapy.J Hepatol 1998, 28:960-964
7. Zeuzem S, Schmidt JM, Lee JH, Ruster B, Roth WK: Effect of inter-feron alfa on the dynamics of hepatitis C virus turnover in vi-vo.Hepatology 1996, 23:366-371
8. Lam NP, Neumann AU, Gretch DR, Wiley TE, Perelson AS, Layden TJ: Dose-dependent acute clearance of hepatitis C genotype 1 virus with interferon alfa.Hepatology 1997, 26:226-231 9. Bekkering FC, Stalgis C, McHutchison JG, Brouwer JT, Perelson AS:
Estimation of early hepatitis C viral clearance in patients re-ceiving daily interferon and ribavirin therapy using a mathe-matical model.Hepatology 2001, 33:419-423
10. Brouwer JT, Nevens F, Kleter B, Elewaut A, Adler M, Brenard R, Cha-muleau RA, Michielsen PP, Pirotte J, Hautekeete ML, Weber J, Bour-geois N, Hansen BE, Bronkhorst CM, ten Kate FJ, Heijtink RA, Fevery J, Schalm SW: Efficacy of interferon dose and prediction of re-sponse in chronic hepatitis C: Benelux study in 336 patients. J Hepatol 1998, 28:951-959
11. Holodniy M, Mole L, Yen-Lieberman B, Margolis D, Starkey C, Carroll R, Spahlinger T, Todd J, Jackson JB: Comparative stabilities of quantitative human immunodeficiency virus RNA in plasma from samples collected in VACUTAINER CPT, VACU-TAINER PPT, and standard VACUVACU-TAINER tubes.J Clin Micro-biol 1995, 33:1562-1566
12. Mellor J, Hawkins A, Simmonds P: Genotype dependence of hep-atitis C virus load measurement in commercially available quantitative assays.J Clin Microbiol 1999, 37:2525-2532
13. Zeuzem S, Lee JH, Franke A, Ruster B, Prummer O, Herrmann G, Roth WK: Quantification of the initial decline of serum hepa-titis C virus RNA and response to interferon alfa.Hepatology 1998, 27:1149-1156
14. Iino S, Hino K, Kuroki T, Suzuki H, Yamamoto S: Treatment of chronic hepatitis C with high-dose interferon alpha-2b. A multicenter study.Dig Dis Sci 1993, 38:612-618
15. Bekkering FC, Brouwer JT, Hansen BE, Schalm SW: Hepatitis C vi-ral kinetics in difficult to treat patients receiving high dose interferon and ribavirin.J Hepatol 2001, 34:435-440
16. Zeuzem S, Feinman SV, Rasenack J, Heathcote EJ, Lai MY, Gane E, O'Grady J, Reichen J, Diago M, Lin A, Hoffman J, Brunda MJ: Peginterferon alfa-2a in patients with chronic hepatitis C.N Engl J Med 2000, 343:1666-1672
17. Heathcote EJ, Shiffman ML, Cooksley WG, Dusheiko GM, Lee SS, Balart L, Reindollar R, Reddy RK, Wright TL, Lin A, Hoffman J, De Pamphilis J: Peginterferon alfa-2a in patients with chronic hep-atitis C and cirrhosis.N Engl J Med 2000, 343:1673-1680
Publish with BioMed Central and every scientist can read your work free of charge
"BioMedcentral will be the most significant development for disseminating the results of biomedical research in our lifetime."
Paul Nurse, Director-General, Imperial Cancer Research Fund
Publish with BMCand your research papers will be:
available free of charge to the entire biomedical community
peer reviewed and published immediately upon acceptance
cited in PubMed and archived on PubMed Central
yours - you keep the copyright
[email protected] Submit your manuscript here:
http://www.biomedcentral.com/manuscript/