R E S E A R C H A R T I C L E
Open Access
Comparison of the gut microbiota
composition between obese and
non-obese individuals in a Japanese
population, as analyzed by terminal
restriction fragment length polymorphism
and next-generation sequencing
Chika Kasai
1, Kazushi Sugimoto
2,3*, Isao Moritani
1, Junichiro Tanaka
1, Yumi Oya
1, Hidekazu Inoue
1,
Masahiko Tameda
2,3, Katsuya Shiraki
3, Masaaki Ito
4, Yoshiyuki Takei
3and Kojiro Takase
1Abstract
Background:Obesity has become one of the most serious social problems in developed countries, including Japan. The relationship between the gut microbiota and obesity has recently attracted the attention of many researchers. Although the gut microbiota was long thought to contribute to obesity, the exact association remains largely unknown. We examined the human gut microbiota composition in a Japanese population in order to determine its relationship to obesity.
Methods:Stool samples from 23 non-obese subjects (body mass index [BMI] <20 kg/m2) and 33 obese subjects (BMI≥25 kg/m2) were collected and DNA was extracted prior to colonoscopy. After terminal restriction fragment length polymorphism (T-RFLP) analysis, samples from 10 subjects (4 non-obese and 6 obese) were selected and subjected to next-generation sequencing for species-level analysis.
Results:T-RFLP analysis showed significantly reduced numbers ofBacteroidetesand a higherFirmicutestoBacteroidetes ratio in obese subjects compared with non-obese subjects. Bacterial diversity was significantly greater in obese subjects compared with non-obese subjects. Next-generation sequencing revealed that obese and non-obese subjects had different gut microbiota compositions and that certain bacterial species were significantly associated with each group (obese:Blautia hydrogenotorophica,Coprococcus catus,Eubacterium ventriosum,Ruminococcus bromii,Ruminococcus obeum; non-obese:Bacteroides faecichinchillae,Bacteroides thetaiotaomicron,Blautia wexlerae,Clostridium bolteae, Flavonifractor plautii).
Conclusion:Gut microbial properties differ between obese and non-obese subjects in Japan, suggesting that gut microbiota composition is related to obesity.
Keywords:Obesity, Microbiota, T-RFLP, Next-generation sequencing
* Correspondence:[email protected] 2
Department of Molecular and Laboratory Medicine, Mie University School of Medicine, 2-174 Edobashi, Tsu, Mie 514-8507, Japan
3
Department of Gastroenterology and Hepatology, Mie University School of Medicine, Tsu, Japan
Full list of author information is available at the end of the article
Background
With the increasing westernization of Japanese dietary habits, obesity has become a serious social problem that is associated with metabolic disorders, including such lifestyle-associated diseases as diabetes. Numerous re-cent studies have revealed that the human gut micro-biota is strongly associated with host energy regulation and homeostasis, thereby affecting the clinical condi-tions of diabetic and/or obese patients [1].
The human gut is continually colonized by complex microbial communities in which the combined number of cells (1011-13 cells per gram range in the colon) is greater than the total number of host cells [2]. That is to say, the human body harbors 10 times as many exogen-ous cells as its own. Recently, the gut microbiota was re-ferred to as a“super organism”[3] and a “virtual organ” [4] because it affects both the biology and physiology of the host. However, numerous details regarding the pre-cise mechanism underlying the effects of gut microbiota activities on host homeostasis remain to be elucidated. Recent research has revealed that the composition of the gut microbiota varies with age, dietary habits, geographic environment, and other host-associated factors [5–8].
As the human gut microbiota is comprised primarily of anaerobes, 60-80 % of which are uncultivatable [9], traditional culture methods are of limited usefulness for studying these organisms. However, owing to recent de-velopments in molecular biological methods and the in-creasing utility of next-generation sequencing technology (both of which allow the detection of uncul-tivatable microbiomes), this research area has shown a notable advance.
Using one such molecular biological method, 16S rRNA sequencing, Turnbaugh et al. employed a genomic approach to examine the role of the gut microbiota (traditionally recognized as being associated with energy harvesting in the host) in the development of obesity [10, 11]. Through animal studies involving ob/ob mice, they found that obesity is associated with changes in the relative abundance of two dominant bacterial phyla, the
Bacteroidetes and the Firmicutes. The ob/ob mice har-bored fewerBacteroidetesand moreFirmicutesthan did lean mice [11]. Moreover, a human study showed that the microbiota of obese subjects is less diverse and is composed of significantly fewer Bacteroidetescompared with non-obese subjects [12]. Similar results were ob-served in another study by Armougom et al., who re-ported a significant reduction in the proportion of
Bacteroidetesin obese patients compared with lean indi-viduals [13]. However, other research has contradicted these findings. A significant increase in the proportion of Bacteroides in obese and overweight subjects com-pared with lean controls has been reported [14], whereas other researchers have found no correlation between
human obesity and the proportions of Bacteroides and
Firmicutesamong fecal bacteria [15].
Thus, previous research suggests that the composition of the gut microbiota differs between obese and non-obese subjects. However, the results of studies in humans and mice have been inconsistent, generating considerable controversy as to the proportions of Bacter-oides and Firmicutes and their relationship to obesity. Primarily led by Western researchers, considerable at-tention has focused on studies of the relationship be-tween the gut microbiota and various diseases. However, to the best of our knowledge, only a limited number of studies have addressed this topic in Japanese tions, whose dietary habits differ from Western popula-tions. Furthermore, previous research done in Japan has not adequately analyzed the relationship between the gut microbiota at the species level and disease development. Therefore, in this study, we investigated the human gut microbiota in a Japanese population using next-generation sequencing in addition to terminal restriction fragment length polymorphism (T-RFLP) analysis which has been revealed to be useful for analyzing gut micro-biota [16]. We identified 10 potential bacterial species uniquely associated with obesity and non-obesity.
Methods
Human subjects
Subjects who were under 65 years of age and had under-gone colonoscopy at Mie Prefectural General Medical Center, Yokkaichi, Japan, between 2012 and 2013 were enrolled in the study.
According to the definition of the Japan Society for the Study of Obesity, subjects with a body mass index (BMI) <18.5 kg/m2 are classified as lean, whereas sub-jects with a BMI between 18.5 and 25 kg/m2are classi-fied as normal, and those with a BMI ≥25 kg/m2 were classified as obese. In the current study, we classified subjects with a BMI <20 kg/m2as non-obese, and those with a BMI ≥25 kg/m2 as obese, for we did not have enough subjects with a BMI <18.5 kg/m2to make statis-tical analyses.
General Medical Center, Yokkaichi, Japan). Stool samples were collected prior to polyethylene glycol preparation of the bowel for colonoscopy. Fecal samples were stored at 4 °C after collection and were submitted to Technosuruga Laboratory (Shizuoka, Japan) for T-RFLP analysis, as described below.
DNA Extraction
Fecal samples (approximately 4 mg) were immediately suspended in a solution containing100 mM Tris-HCI, pH 9.0, 40 mM Tris-EDTA, pH8.0, and 4 M guanidine thiocyanate, and kept at -20 °C until DNA extraction. An aliquot of 0.8 ml of the suspension was homogenized with zirconia beads in a 2.0 ml screw cap tube by Fas-tPrep 24 Instrument (MP Biomedicals, Santa Ana, CA) at 5 m/s for 2 min and placed on ice for 5 min. After centrifugation at 5000 × g for 1 min, DNA was extracted from 200 μL of the suspension using an automatic nu-cleic acid extractor (Precision System Science, Chiba, Japan). MagDEA DNA 200 (GC) (Precision System
Science) was used as the reagent for automatic nucleic acid extraction.
T-RFLP
The 16S rDNA was amplified from human fecal DNA using the fluorescent-labeled 516f primer (5’-TGCCAG CAGCCGCGGTA-3’; Escherichia coli positions 516 to 532) and 1510r primer (5’ -GGTTACCTTGTTACGACTT-3’;E. colipositions 1510 to 1492). For this, the Hot-starTaq DNA polymerase by Gene Amp PCR system 9600 (Applied Biosystems, Foster City, CA) was used. The amp-lification program was as follows: preheating at 95 °C for 15 min, 30 cycles of denaturation at 95 °C for 30 s, annealing at 50 °C for 30 s, extension at 72 °C for 1 min, and finally, a terminal extension at 72 °C for 10 min. The amplified DNA was purified by a MultiScreen PCR96 Filter Plate (Millipore, Billerica, MA) and was verified by electrophoresis. The restriction enzymes were selected according to Nagashima et al. [17, 18]. In brief, the PCR product was purified, and digested with 10 U ofBslI (New England BioLabs, Ipswich, MA) at 55 °C for 3 h. The resultant DNA fragments, namely, fluorescent-labeled terminal restriction fragments (T-RFs), were analyzed by ABIPRISM 3130xl genetic analyzer, and their length and peak area were determined using the genotype software GeneMapper (Applied Biosystems). The T-RFs were divided into 29 operational taxonomic units (OTUs). The OTUs were quantified as the percentage of individual OTU per total OTU areas, which were expressed as the percentage of the area under the curve (%AUC). The bacteria were predicted for each classification unit and the corresponding OTU was identified according to reference Human Fecal Microbiota T-RFLP profiling (http://www.tecsrg-lab.jp/).
From all of the subjects who were diagnosed as normal after colonoscopy (21 of 56), samples from the 4 non-obese subjects with the lowest BMI and the 6 obese subjects with the highest BMI were selected for next-generation sequencing. The diagnosis of other 35 participants are shown in Additional file 1: Table S1.
Illumina library generation
NGS analysis of microbial community structure in feces was performed using a MiSeq (Illumina, San Diego, CA), as previously described by Takahashi et al. [19]. The V3-V4 region of 16S rDNA was amplified using
341 F (5’-CCTACGGGAGGCAGCAG-3’) [20] and
806R (5’-GGACTACHVGGGTWTCTAAT-3’) [21]. In addition to the V3-V4 specific priming regions, these primers were complementary to standard Illumina forward and reverse primers. The reverse primer also contained a 6-bp indexing sequence (CAGATC, ACTTGA, GATCAG, TAGCTT, GGCTAC, CTTGTA, ATCACG, CGATGT, TTAGGC and TGACCA) to allow for multiplexing. The Fig. 1Flowchart showing the total number of participants enrolled
touchdown PCR method for thermal cycling was used with a GeneAmp PCR system 9700 (ABI, Foster City, CA). The PCR reaction mixture (25 μL) contained 20 ng genomic DNA, 2 × MightyAmp Buffer Ver.2 (Takara, Otsu, Japan), 0.25 μM of each primer, and 1.25 units of MightyAmp DNA Polymerase (Takara). The PCR reaction and prepar-ation of amplicon pool were performed by the method of Takahashi et al. [19].
Illumina sequencing and quality filtering
Each multiplexed library pool was spiked with 30 % phiX control to improve base calling during sequencing, as recommended by Illumina for the pooling of two librar-ies, according to Takahashi et al. [19]. Sequencing was conducted using a paired-end, 2 × 251-bp cycle run on an Illumina MiSeq sequencing system and MiSeq Re-agent Nano Kit version 2 (500 Cycle) chemistry. Paired-end sequencing with read lengths of about 251 bp was performed. After demultiplexing, a clear overlap in the pairedend reads was observed. This allowed paired reads to be joined together with the fastq-join program (http://code.google.com/p/ea-utils/). Only reads that that had quality value (QV) scores of≥20 for more than 99 % of the sequence were extracted for further analysis. All sequences with ambiguous base calls were discarded [19].
Bioinformatics analysis
The determined 16S rDNA sequences were subjected to homology searching using Metagenome@KIN software (World Fusion Co., Ltd., Tokyo, Japan) against the Tech-noSuruga Lab Microbial Identification Databese
DB-BA9.0 (TechnoSuruga Laboratory), which contains only bacteria with standing in the taxonomic nomenclature.
Estimation of richness and diversity
Microbial diversity was assessed using the Shannon-Weiner diversity index (H’), which accounts for both the number of phylotypes (richness) and the proportion of the total accounted for by each phylotype (evenness) [22].
Principal component analysis
Principal component analysis (PCA) was performed using Metagenome@KIN software (World Fusion Co., Ltd., Tokyo, Japan) based on data from bacterial genera with 97 % similarity cut-off with the Apollon DB-BA database, ver 9.0 (TechnoSuruga Laboratory).
Statistical analysis
Data were analyzed using an unpairedt-test with Welch’s correction for continuous variables or the Mann-Whitney test (two-sided) and Fisher’s exact test for categorical vari-ables using the IBM SPSS software Ver. 22. P values less than 0.05 were considered significant.
Results
Differences in bacterial community profiles between obese and non-obese subjects as determined by T-RFLP analysis
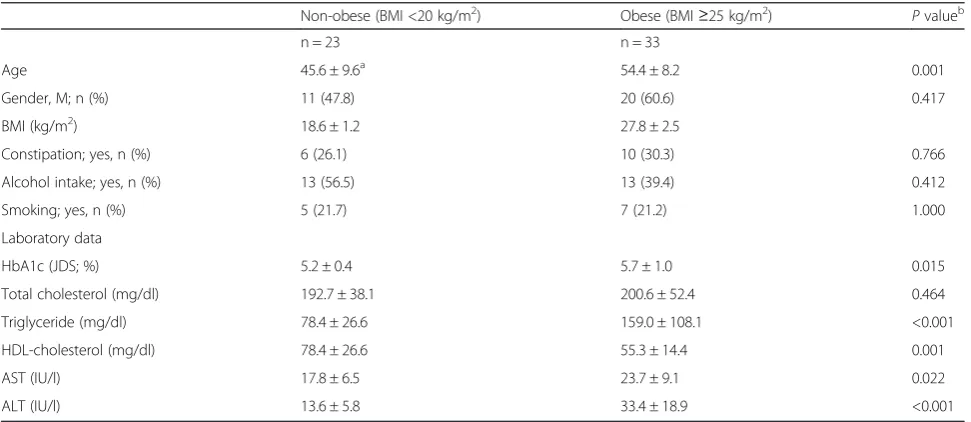
The characteristics of our subjects are shown in Table 1. A total of 23 non-obese subjects (BMI <20 kg/m2) and 33 obese subjects (BMI ≥25 kg/m2) were enrolled in this study. Blood test results showed that HbA1c, triglyceride, aspartate aminotransferase, and alanine aminotransferase
Table 1Descriptive characteristics of study participants
Non-obese (BMI <20 kg/m2) Obese (BMI≥25 kg/m2) Pvalueb
n = 23 n = 33
Age 45.6 ± 9.6a 54.4 ± 8.2 0.001
Gender, M; n (%) 11 (47.8) 20 (60.6) 0.417
BMI (kg/m2) 18.6 ± 1.2 27.8 ± 2.5
Constipation; yes, n (%) 6 (26.1) 10 (30.3) 0.766
Alcohol intake; yes, n (%) 13 (56.5) 13 (39.4) 0.412
Smoking; yes, n (%) 5 (21.7) 7 (21.2) 1.000
Laboratory data
HbA1c (JDS; %) 5.2 ± 0.4 5.7 ± 1.0 0.015
Total cholesterol (mg/dl) 192.7 ± 38.1 200.6 ± 52.4 0.464
Triglyceride (mg/dl) 78.4 ± 26.6 159.0 ± 108.1 <0.001
HDL-cholesterol (mg/dl) 78.4 ± 26.6 55.3 ± 14.4 0.001
AST (IU/l) 17.8 ± 6.5 23.7 ± 9.1 0.022
ALT (IU/l) 13.6 ± 5.8 33.4 ± 18.9 <0.001
ALTalanine aminotransferase,ASTaspartate aminotransferase,BMIbody mass index,HDLhigh-density lipoprotein,JDSJapan diabetes society
a
Mean ± SD
bP
levels were significantly higher and the high-density-lipoprotein cholesterol level was lower in the obese sub-jects. The average age of the obese subjects was higher than that of the non-obese subjects.
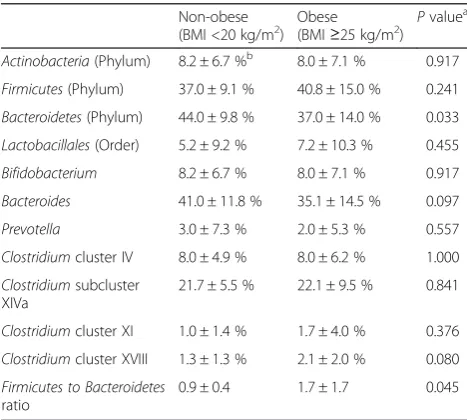
Differences in bacterial flora between the two groups are summarized in Table 2. The relative proportion of
Bacteroidetesat the phylum level was lower in stool sam-ples obtained from obese subjects compared with non-obese subjects. The Firmicutes to Bacteroidetes ratio was higher in the stool samples obtained from obese subjects compared with non-obese subjects. There were no differ-ences in other bacteria. There was no correlation between microbiota and subject age (Additional file 2: Table S2) and only HbA1c was weakly correlated with age in baseline variables (Additional file 3: Table S3).
Differences in bacterial communities between obese and non-obese subjects as determined by 16S rRNA
sequencing
Our T-RFLP analysis revealed that the levels of Bacteroi-detes would be significantly lower in obese subjects com-pared with non-obese subjects. To determine which
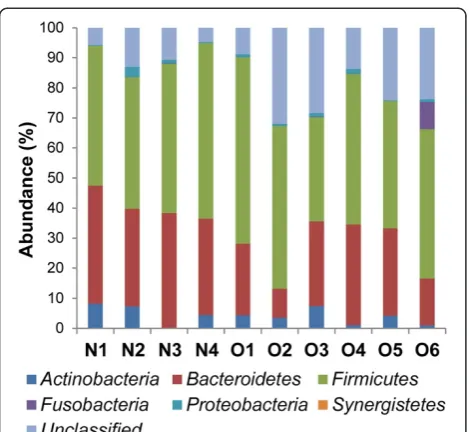
Bacteroidete species differed in abundance, we selected samples from 10 subjects (4 non-obese and 6 obese) from the initial group of 55 for next-generation sequencing (Table 3). Using our primer set and MiSeq platform combination, an average of 39452 reads were obtained for each sequencing reaction. Figure 2 shows the phylotype distribution for individual patients in this study. The composition and relative abundance of the major phyla were similar, with Bacteroidetes and Firmicutes being the dominant phyla. However, after dividing the samples into
two groups (obese vs. non-obese) and performing statis-tical analyses, a significant and drastic decrease in the proportion of Bacteroidetes (obese 23.28 % vs. non-obese 35.44 %; P< 0.05) and an increase in the propor-tion of“unclassified”phyla (obese 21.76 % vs. non-obese 8.54 %) were observed in the obese group relative to the non-obese group (Fig. 3). There were no differences in other bacteria.
Differences in species diversity between obese and non-obese subjects
According to the phylotype classification at the genus level, we assessed microbial diversity based on measures of richness and evenness for non-obese and obese sub-jects using 16S rRNA gene sequences derived from clone libraries. The mean diversity results for non-obese and obese subjects are shown in Fig. 4. Microbial diversity and richness tended to be significantly higher in obese subjects compared with non-obese subjects (P< 0.05).
Comparison of PCA results between obese and non-obese subjects
PCA was performed based on dominant bacteria of PC1 (Megamonas, Bacteroides, and Blautia) and of PC2 (Megamonas, Bacteroides, and Faecalibacterium) at the genus level (Fig. 5). PCA results showed that 4 non-obese subjects formed a cluster (separated by a circle) distinct from obese subjects.
Comparison of microbiomes at the species level
Species-level analyses identified five bacterial species that were significantly associated with the obese group:Blautia hydrogenotorophica,Coprococcus catus, Eubacterium ven-triosum, Ruminococcus bromii, and Ruminococcus obeum
(Table 4). It has been traditionally argued that the gut microbiota degrade and ferment resistant starches to produce short-chain fatty acids (SCFAs) that are used for Table 2Differences in bacterial flora as determined by T-RFLP
analysis
Non-obese
(BMI <20 kg/m2) Obese(BMI
≥25 kg/m2) Pvalue a
Actinobacteria(Phylum) 8.2 ± 6.7 %b 8.0 ± 7.1 % 0.917
Firmicutes(Phylum) 37.0 ± 9.1 % 40.8 ± 15.0 % 0.241
Bacteroidetes(Phylum) 44.0 ± 9.8 % 37.0 ± 14.0 % 0.033
Lactobacillales(Order) 5.2 ± 9.2 % 7.2 ± 10.3 % 0.455
Bifidobacterium 8.2 ± 6.7 % 8.0 ± 7.1 % 0.917
Bacteroides 41.0 ± 11.8 % 35.1 ± 14.5 % 0.097
Prevotella 3.0 ± 7.3 % 2.0 ± 5.3 % 0.557
Clostridiumcluster IV 8.0 ± 4.9 % 8.0 ± 6.2 % 1.000
Clostridiumsubcluster XIVa
21.7 ± 5.5 % 22.1 ± 9.5 % 0.841
Clostridiumcluster XI 1.0 ± 1.4 % 1.7 ± 4.0 % 0.376
Clostridiumcluster XVIII 1.3 ± 1.3 % 2.1 ± 2.0 % 0.080
Firmicutes to Bacteroidetes
ratio
0.9 ± 0.4 1.7 ± 1.7 0.045
aP
values are based on two-samplet-test with Welch correction
b
Data are expressed as mean ± SD
Table 3Characteristics of study participants whose gut microbiota was analyzed using next-generation sequencing
Participant ID Health status BMI (kg/m2) Age Gender, M : F
N1 non-obese 18.0 36.3 ± 4.1a 1 : 3
N2 non-obese 15.9
N3 non-obese 17.9
N4 non-obese 16.3
O1 obese 27.4 51.7 ± 6.6a 5 : 1
O2 obese 25.8
O3 obese 26.1
O4 obese 26.3
O5 obese 25.6
O6 obese 32.8
a
energy harvesting by the host. The five above-mentioned species belong to the phylum Firmicutes
and carry genes related to polysaccharide metabolism that enhance the efficiency of energy harvesting by the host.
Our results also showed that five bacterial species were significantly associated with the non-obese group: Bacter-oides faecichinchillae, Bacteroides thetaiotaomicron,
Blautia wexlerae, Clostridium bolteae, and Flavonifractor
plautii(Table 5). Most notably,Bacteroides faecichinchillae
and Bacteroides thetaiotaomicron were present in signifi-cantly greater proportions in the feces of non-obese sub-jects, whereas these bacteria were barely detectable in the feces of obese subjects (Figs. 6 and 7).
Discussion
Using T-RFLP analysis and next-generation sequencing, we found that the composition of the gut microbiota dif-fers between obese and non-obese subjects in a Japanese population. We obtained results similar to previous studies [10, 11] in terms ofFirmicutestoBactericides ra-tio but that were different from previous studies [12] in terms of diversity. We also identified potential bacterial species uniquely associated with each group. As gener-ally proposed in previous studies [10, 11], T-RFLP ana-lysis showed significantly reduced levels ofBacteroidetes
and a higher Firmicutes to Bactericides ratio in obese subjects compared with non-obese subjects. In addition, the bacterial diversity of the gut microbiota was signifi-cantly greater in obese subjects compared with non-obese subjects in our study subjects.
Earlier studies revealed that the human gut microbiota becomes relatively stable around 1 week after birth, be-gins to resemble that of an adult after weaning, and once colonized in the gut of a healthy person remains stable over long period [23]. It is also traditionally thought that every healthy person has his or her own unique gut microbiota composition [2, 24, 25].
Past research investigating the relationship between the composition of the gut microbiota and the degree of obesity has yielded contradictory results. For example, it has been reported that an increase in Firmicutes and a decrease in
Bacteroidetesis associated with obesity [10, 11, 26], whereas Schwiertz et al. reported a lower ratio of Firmicutes in Fig. 2Phylum-level classification of bacteria identified in individual
stool samples. N-numbered samples were obtained from non-obese subjects, whereas O-numbered samples were obtained from obese subjects. Each bar represents the percent contribution of phylum-level profiles grouped by non-obese-obese status or for each individual. The phyla represented by the different colors are shown below the figure
overweight adults compared with lean controls [14], and Duncan et al. reported no differences between Firmicutes
andBacteroidetesaccording to BMI [15]. Although Duncan et al. hypothesized that theBacteroidetestoFirmicutesratio plays no important role in human obesity, at least at the phylum level, they did not rule out the possibility that dis-crepancies between the results of various researchers may be due to dietary habits and/or host physiology, as well as the methodologies used in the analyses.
Consistent with the reports of Ley, Furet, and Turnbaugh [10, 11, 26], our T-RFLP analyses in a
Japanese population showed higher levels of Bacteroi-detesand a lowerFirmicutestoBacteroidetesratio at the phylum level in non-obese versus obese subjects. Fur-thermore, Mitsuoka et al. reported that modification of the human gut microbiota starts early in old age (at 65 years or over), although the cause is unclear [23]. It was for this reason that subjects over 65 years of age were excluded from our study. Although the average age of the obese subjects was higher than that of the non-obese subjects examined in the T-RFLP analysis in the current study, we found no correlations between any bacteria and subject age (Additional file 2: Table S2), in-dicating that the differences in gut microbiota between obese and non-obese subjects were not attributable to differences in the age of the subjects.
Following the T-RFLP analyses, we selected samples from several subjects from each group and analyzed them using next-generation sequencing followed by PCA. The results showed that the composition of the gut microbiota differs between obese and non-obese subjects, suggesting that changes in the gut microbiota composition are associated with body weight in the Japanese population we examined. In addition, compared with non-obese subjects, obese sub-jects exhibited greater gut bacterial diversity and richness. However, previous research conducted to date has shown that obesity is associated with reduced bacterial diversity [12, 27, 28]. Le Chatelier et al. studied the human gut mi-crobial composition in 123 non-obese (BMI <25 kg/m2) and 169 obese (BMI >30 kg/m2) individuals in a Danish Fig. 4Comparison of bacterial diversity (Shannon-Wiener index)
between the microbiota of non-obese and obese subjects. *P< 0.05
Fig. 5Comparison of principal component analysis results at the genus level between the gut microbiota of obese and non-obese subjects. A PCA based on dominant bacteria of PC1 (Megamonas,
Bacteroides, andBlautia) and of PC2 (Megamonas,Bacteroides, and
Faecalibacterium). Non-obese subjects formed a cluster (separated by a circle) distinct from obese subjects
Table 4Bacterial species significantly more abundant in the stool of obese compared with non-obese individuals
Ave. non-obese (%) Ave. obese (%) Pvalue*
Blautia
hydrogenotorophica
ND 0.01 0.040
Coprococcus catus ND 0.21 0.030
Eubacterium ventriosum ND 0.19 0.046
Ruminococcus bromii ND 1.03 0.028
Ruminococcus obeum 0.07 0.87 0.038
NDnot determined
*Pvalues are based on Welch’s test
Table 5Bacterial species significantly more abundant in the stool of non-obese compared with obese individuals
Ave. non-obese (%) Ave. obese (%) Pvalue*
Bacteroides faecichinchillae
2.57 0.16 0.037
Bacteroides thetaiotaomicron
0.12 ND 0.024
Blautia wexlerae 11.91 3.79 0.043
Clostridium bolteae 0.69 0.12 0.028
Flavonifractor plautii 0.22 0.06 0.038
NDnot determined
population and found that obese individuals with low bac-terial richness were characterized by more noticeable over-all adiposity, insulin resistance, dyslipidemia, and a more marked inflammatory phenotype when compared with obese individuals with a high gut bacterial richness [27]. Moreover, Cotillard et al. found that individuals with re-duced microbial gene richness (40 %) presented with more pronounced dysmetabolism and low-grade inflammation than individuals with high bacterial gene richness [28]. Possible explanations for these discrepancies in bacterial diversity between previous studies and ours include the small number of study samples and differences in BMI categorization of the study subjects. In the literature from outside of Japan, lean and obese are defined as BMI <25 and >30 kg/m2, respectively, whereas in our study obese was defined as BMI ≥25 kg/m2and non-obese as BMI <
20 kg/m2. Furthermore, in the analysis with next generation sequencing, only one patient had a BMI >30 kg/m2and all of the non-obese subjects had a BMI ≤18 kg/m2 in this study. As the BMI categorization of our patient population differed from that of previous studies, it is difficult to dir-ectly compare the results. It is also possible that mildly obese persons have richer bacterial diversity, and that as obesity increases coupled with increasingly severe meta-bolic disturbances such as insulin resistance or dyslipid-emia, the gut microbial diversity declines, which is consistent with the findings of Le Chatelier et al.
We found that five species,Blautia hydrogenotorophica,
Coprococcus catus, Eubacterium ventriosum, Ruminococ-cus bromii, andRuminococcus obeum(included in the Fir-micutes), were significantly more abundant in stool samples obtained from obese subjects compared with non-obese subjects. The gut microbiota is involved in the fermentation of indigestible polysaccharides (components of dietary fibers) that are converted into SCFAs (e.g., acet-ate, propionacet-ate, butyrate) [29] used by the host as an en-ergy source, representing 10-15 % of the enen-ergy influx from food [30]. All five of the species listed above are SCFA-producing bacteria belonging to the phylum Firmi-cutes, and it is likely that they provide energy to the host by promoting energy harvest and adipose tissue expansion [31]. However, Tagliabue et al. pointed out that this “ en-ergy harvest”hypothesis conflicts with epidemiologic data suggesting that high intake of dietary fiber (the main source of SCFAs) inhibits the development of obesity. That is to say, despite the recommendations for high diet-ary fiber intake as published by the World Health Organization and other groups as a means of enhancing weight loss or maintaining a healthier body weight, the en-ergy harvest hypothesis suggests that high fiber intake leads to weight gain rather than weight loss. Thus, re-searchers have been studying mechanisms other than that associated with the energy harvest hypothesis [32]. In addition, Blaut et al. suggested that the gut microbiota may influence energy harvest by producing SCFAs from dietary fiber, but they also stressed that it is unknown whether this mechanism is relevant to human populations in Western countries, where the average intake of dietary fiber is quite low [33]. However, SCFA levels were not evaluated in our study, as this was not within the initial scope of our research; therefore, the relationship between obesity and energy harvest related to bacterial SCFA pro-duction should be investigated further.
In our study, populations ofBacteroides faecichinchil-lae, Bacteroides thetaiotaomicron, Blautia wexlerae,
Clostridium bolteae, andFlavonifractor plautiiwere sig-nificantly more abundant in stool samples from non-obese compared with non-obese subjects. Most notably, two
Bacteroides species (B. faecichinchillae and B. thetaio-taomicron) were detected in significant abundance in Fig. 6Average abundance ofBacteroides thetaiotaomicronin
individual stool samples. N-numbered samples were obtained from non-obese subjects and O-numbered samples were obtained from obese subjects
stool samples from all of the non-obese subjects but were barely detectable in samples from any of the obese sub-jects. According to Shipman et al.,Bacteroides thetaiotao-micron is a gram-negative obligate anaerobe that can utilize polysaccharides very efficiently as a source of carbon and energy by binding them to the cell surface and allow-ing cell-associated enzymes to hydrolyze the polysaccha-rides into fragments that can be internalized by the bacterium [34]. This mechanism implies that this species independently harvests and consumes a certain amount of energy in the colon which would be otherwise used by the host. Furthermore, Ridaura et al. showed that co-housing obese and lean animals prevents the development of an in-creased adiposity phenotype as a result of invasion of the obese microbiota by specificBacteroideteswithin the lean microbiota. This microbial transition and the inhibition of body fat increase were observed only when animals were fed foods low in saturated fats and high in fruits and vege-tables [35], suggesting that specific members of the gut microbiota contribute to the suppression of obesity and that the anti-obesity effect is diet dependent.
Conclusion
In conclusion, the results of the current study in a Japanese population show that the gut microbiota differs between obese and non-obese individuals. However, whether alter-ations in the gut microbial composition are the cause or the sequel of obesity remains an open question for re-search. Further study will be necessary to elucidate the exact role of the gut microbiota in the development of lifestyle-related diseases such as obesity and diabetes.
Additional files
Additional file 1: Table S1.Colonoscopy diagnosis of study participant. (DOCX 17 kb)
Additional file 2: Table S2.Correlation between microbiota and patient age. (DOCX 20 kb)
Additional file 3: Table S3.Correlation between baseline variables and patient age. (DOCX 19 kb)
Abbreviations
BMI:Body mass index; T-RFLP: Terminal restriction fragment length polymorphism; SCFA: Short-chain fatty acid.
Competing interests
The authors declare that they have no competing interests.
Authors’contributions
Conceived and designed the study: CK KS1 KT. Recruited the subjects: CK IM JT YO HI KT. Wrote the paper CK KS1 MT. Supervised the study; KS2 MI YT KT. KS1 is corresponding to Kazushi Sugimoto, KS2 is corresponding to Katsuya Shiraki. All authors read and approved the final manuscript.
Acknowledgements
The authors express their appreciation to TechnoSuruga Laboratory Co., Ltd. (Sizuoka, Japan) for technical assistance.
Author details
1
Department of Gastroenterology, Mie Prefectural General Medical Center, 5450-132 Hinaga, Yokkaichi, Mie 510-8561, Japan.2Department of Molecular
and Laboratory Medicine, Mie University School of Medicine, 2-174 Edobashi, Tsu, Mie 514-8507, Japan.3Department of Gastroenterology and Hepatology,
Mie University School of Medicine, Tsu, Japan.4Department of Cardiology and Nephrology, Tsu, Japan.
Received: 3 March 2015 Accepted: 30 July 2015
References
1. Remely M, Aumueller E, Merold C, Dworzak S, Hippe B, Zanner J, et al. Effects of short chain fatty acid producing bacteria on epigenetic regulation of FFAR3 in type 2 diabetes and obesity. Gene. 2014;537(1):85–92. 2. Savage DC. Microbial ecology of the gastrointestinal tract. Annu Rev
Microbiol. 1977;31:107–33.
3. Dore J, Simren M, Buttle L, Guarner F. Hot topics in gut microbiota. United European Gastroenterol J. 2013;1(5):311–8.
4. Evans JM, Morris LS, Marchesi JR. The gut microbiome: the role of a virtual organ in the endocrinology of the host. J Endocrinol. 2013;218(3):R37–47. 5. Biagi E, Nylund L, Candela M, Ostan R, Bucci L, Pini E, et al. Through ageing,
and beyond: gut microbiota and inflammatory status in seniors and centenarians. PLoS One. 2010;5(5):e10667.
6. Yatsunenko T, Rey FE, Manary MJ, Trehan I, Dominguez-Bello MG, Contreras M, et al. Human gut microbiome viewed across age and geography. Nature. 2012;486(7402):222–7.
7. De Filippo C, Cavalieri D, Di Paola M, Ramazzotti M, Poullet JB, Massart S, et al. Impact of diet in shaping gut microbiota revealed by a comparative study in children from Europe and rural Africa. Proc Natl Acad Sci U S A.
2010;107(33):14691–6.
8. Wu GD, Chen J, Hoffmann C, Bittinger K, Chen YY, Keilbaugh SA, et al. Linking long-term dietary patterns with gut microbial enterotypes. Science. 2011;334(6052):105–8.
9. Van Citters GW, Lin HC. Management of small intestinal bacterial overgrowth. Curr Gastroenterol Rep. 2005;7(4):317–20.
10. Ley RE, Turnbaugh PJ, Klein S, Gordon JI. Microbial ecology: human gut microbes associated with obesity. Nature. 2006;444(7122):1022–3. 11. Turnbaugh PJ, Ley RE, Mahowald MA, Magrini V, Mardis ER, Gordon JI. An
obesity-associated gut microbiome with increased capacity for energy harvest. Nature. 2006;444(7122):1027–31.
12. Turnbaugh PJ, Hamady M, Yatsunenko T, Cantarel BL, Duncan A, Ley RE, et al. A core gut microbiome in obese and lean twins. Nature.
2009;457(7228):480–4.
13. Armougom F, Henry M, Vialettes B, Raccah D, Raoult D. Monitoring bacterial community of human gut microbiota reveals an increase in Lactobacillus in obese patients and Methanogens in anorexic patients. PLoS One. 2009;4(9):e7125.
14. Schwiertz A, Taras D, Schafer K, Beijer S, Bos NA, Donus C, et al. Microbiota and SCFA in lean and overweight healthy subjects. Obesity. 2010;18(1):190–5. 15. Duncan SH, Lobley GE, Holtrop G, Ince J, Johnstone AM, Louis P, et al.
Human colonic microbiota associated with diet, obesity and weight loss. Int J Obes (Lond). 2008;32(11):1720–4.
16. Sjoberg F, Nowrouzian F, Rangel I, Hannoun C, Moore E, Adlerberth I, et al. Comparison between terminal-restriction fragment length polymorphism (T-RFLP) and quantitative culture for analysis of infants’gut microbiota. J Microbiol Methods. 2013;94(1):37–46.
17. Nagashima K, Hisada T, Sato M, Mochizuki J. Application of new primer-enzyme combinations to terminal restriction fragment length polymorphism profiling of bacterial populations in human feces. Appl Environ Microbiol. 2003;69(2):1251–62. 18. Nagashima K, Mochizuki J, Hisada T, Suzuki S, Shimomura K. Phylogenetic
analysis of 16S ribosomal RNA gene sequences from human fecal microbiota and improved utility of terminal restriction fragment length polymorphism profiling. Biosci Microflora. 2006;25(3):99–107.
19. Takahashi S, Tomita J, Nishioka K, Hisada T, Nishijima M. Development of a prokaryotic universal primer for simultaneous analysis of bacteria and archaea using next-generation sequencing. PLoS One. 2014;9(8):e105592. 20. Muyzer G, de Waal EC, Uitterlinden AG. Profiling of complex microbial
21. Caporaso JG, Lauber CL, Walters WA, Berg-Lyons D, Lozupone CA, Turnbaugh PJ, et al. Global patterns of 16S rRNA diversity at a depth of millions of sequences per sample. Proc Natl Acad Sci U S A. 2011;108 Suppl 1:4516–22.
22. Gafan GP, Lucas VS, Roberts GJ, Petrie A, Wilson M, Spratt DA. Statistical analyses of complex denaturing gradient gel electrophoresis profiles. J Clin Microbiol. 2005;43(8):3971–8.
23. Mitsuoka T, Hayakawa K. The fecal flora in man. I. Composition of the fecal flora of various age groups. Zentralbl Bakteriol Orig A. 1973;223(2):333–42. 24. Zoetendal EG, Akkermans AD, De Vos WM. Temperature gradient gel
electrophoresis analysis of 16S rRNA from human fecal samples reveals stable and host-specific communities of active bacteria. Appl Environ Microbiol. 1998;64(10):3854–9.
25. Rajilic-Stojanovic M, Heilig HG, Tims S, Zoetendal EG, de Vos WM. Long-term monitoring of the human intestinal microbiota composition. Environ Microbiol. 2013;15(4):1146-59.
26. Furet JP, Kong LC, Tap J, Poitou C, Basdevant A, Bouillot JL, et al. Differential adaptation of human gut microbiota to bariatric surgery-induced weight loss: links with metabolic and low-grade inflammation markers. Diabetes. 2010;59(12):3049–57.
27. Le Chatelier E, Nielsen T, Qin J, Prifti E, Hildebrand F, Falony G, et al. Richness of human gut microbiome correlates with metabolic markers. Nature. 2013;500(7464):541–6.
28. Cotillard A, Kennedy SP, Kong LC, Prifti E, Pons N, Le Chatelier E, et al. Dietary intervention impact on gut microbial gene richness. Nature. 2013;500(7464):585–8.
29. Macfarlane GT, Macfarlane S. Fermentation in the human large intestine: its physiologic consequences and the potential contribution of prebiotics. J Clin Gastroenterol. 2011;45(Suppl):S120–7.
30. McNeil NI. The contribution of the large intestine to energy supplies in man. Am J Clin Nutr. 1984;39(2):338–42.
31. Delzenne NM, Cani PD. Interaction between obesity and the gut microbiota: relevance in nutrition. Annu Rev Nutr. 2011;31:15–31. 32. Tagliabue A, Elli M. The role of gut microbiota in human obesity: recent findings
and future perspectives. Nutr Metab Cardiovasc Dis. 2013;23(3):160–8. 33. Blaut M, Klaus S. Intestinal microbiota and obesity. Handb Exp Pharmacol.
2012;209:251–73.
34. Shipman JA, Berleman JE, Salyers AA. Characterization of four outer membrane proteins involved in binding starch to the cell surface of Bacteroides thetaiotaomicron. J Bacteriol. 2000;182(19):5365–72. 35. Ridaura VK, Faith JJ, Rey FE, Cheng J, Duncan AE, Kau AL, et al. Gut
microbiota from twins discordant for obesity modulate metabolism in mice. Science. 2013;341(6150):1241214.
Submit your next manuscript to BioMed Central and take full advantage of:
• Convenient online submission
• Thorough peer review
• No space constraints or color figure charges
• Immediate publication on acceptance
• Inclusion in PubMed, CAS, Scopus and Google Scholar
• Research which is freely available for redistribution