Open Access
R E S E A R C H
© 2010 El Mesallamy et al; licensee BioMed Central Ltd. This is an Open Access article distributed under the terms of the Creative Com-mons Attribution License (http://creativecomCom-mons.org/licenses/by/2.0), which permits unrestricted use, distribution, and reproduc-tion in any medium, provided the original work is properly cited.
Research
Effect of taurine supplementation on
hyperhomocysteinemia and markers of oxidative
stress in high fructose diet induced insulin
resistance
Hala O El Mesallamy
1, Ebtehal El-Demerdash
2, Lamiaa N Hammad
3and Hekmat M El Magdoub*
3Abstract
Background: High intake of dietary fructose is accused of being responsible for the development of the insulin resistance (IR) syndrome. Concern has arisen because of the realization that fructose, at elevated concentrations, can promote metabolic changes that are potentially deleterious. Among these changes is IR which manifests as a decreased biological response to normal levels of plasma insulin.
Methods: Oral glucose tolerance tests (OGTT) were carried out, homeostasis model assessment of insulin resistance (HOMA) was calculated, homocysteine (Hcy), lipid concentrations and markers of oxidative stress were measured in male Wistar rats weighing 170-190 g. The rats were divided into four groups, kept on either control diet or high fructose diet (HFD), and simultaneously supplemented with 300 mg/kg/day taurine via intra-peritoneal (i.p.) route for 35 days.
Results: Fructose-fed rats showed significantly impaired glucose tolerance, impaired insulin sensitivity,
hypertriglyceridemia, hypercholesterolemia, hyperhomocysteinemia (HHcy), lower total antioxidant capacity (TAC), lower paraoxonase (PON) activity, and higher nitric oxide metabolites (NOx) concentration, when compared to rats fed on control diet. Supplementing the fructose-fed rats with taurine has ameliorated the rise in HOMA by 56%,
triglycerides (TGs) by 22.5%, total cholesterol (T-Chol) by 11%, and low density lipoprotein cholesterol (LDL-C) by 21.4%. Taurine also abolished any significant difference of TAC, PON activity and NOx concentration among treated and control groups. TAC positively correlated with PON in both rats fed on the HFD and those received taurine in addition to the HFD. Fructose-fed rats showed 34.7% increase in Hcy level. Taurine administration failed to prevent the observed HHcy in the current dosage and duration.
Conclusion: Our results indicate that HFD could induce IR which could further result in metabolic syndrome (MS), and that taurine has a protective role against the metabolic abnormalities induced by this diet model except for HHcy.
Introduction
Soft drink consumption has recently been linked with increased risk for weight gain, type 2 diabetes mellitus (T2DM) and other features of the MS [1]. Many studies suggest that the mechanism by which sugar or high fruc-tose corn syrup may induce MS is related to the frucfruc-tose content [2].
Concern has arisen because of the realization that fruc-tose, at elevated concentrations, can promote metabolic
changes that are potentially deleterious. Among these changes is IR which manifests as a decreased biological response to normal levels of plasma insulin and is indi-cated by impaired glucose tolerance, hyperglycemia and hyperinsulinemia [3].
Metabolic dyslipidemia is the most common complica-tion of IR and T2DM. It is believed to be exacerbated by obesity, as well as numerous detrimental environmental factors such as a high fat diet and sedentary lifestyle. The dyslipidemia accompanying IR is characterized by dis-tinct changes that significantly contribute to increased risk of cardiovascular diseases (CVD) [4].
* Correspondence: h_elmagdoub@hotmail.com
3 Department of Biochemistry, Faculty of Pharmacy, Misr International
University, Cairo, Egypt
In addition, elevated levels of glucose, insulin, advanced glycation endproducts (AGEs), TGs and free fatty acids (FFAs) in patients with IR and MS are reported to pro-duce reactive oxygen species (ROS). ROS can in turn ele-vate tension of redox stress, and cause damage of pancreatic islets [5]. It can also shift the nitric oxide syn-thase (NOS) reaction towards the production of per-oxynitrite (ONOO-) rather than nitric oxide (NO), which might contribute to the development of CVD [6].
Hyperhomocysteinemia is accused of being responsible for elevating oxidative stress as a result of formation of Hcy thiolactone, which leads to impairment of insulin signaling and causes IR [7]. Case-control studies have shown a significant association between plasma Hcy and insulin levels in human and animal models [8,9]. How-ever, it is still not clear whether HHcy induces IR or it is actually hyperinsulinemia that causes elevated plasma Hcy levels. The direction of the causality in this associa-tion is still controversial. It was previously reported that high concentrations of serum insulin are associated with an increased risk of developing HHcy [10]. However, other in vitro studies suggested that Hcy could exert dele-terious effects on insulin secretion, resulting in IR [11].
Amino acids have been recognized as important signal-ing mediators in different cellular functions. Taurine (2-amino ethane sulphonic acid) is a conditionally essential amino acid that is involved in many important biological functions [12]. Taurine reduces the rate of apoptosis in pancreatic islets and acts on DNA synthesis, preventing abnormal development of the endocrine pancreas [13]. In fetal rat islets, taurine increases glucose-stimulated insu-lin secretion and enhances the action of some secret-agogues, such as leucine or arginine [14]. Furthermore, there is evidence indicating that taurine has hypoglyce-mic properties due to the potentiation of the effects of insulin [15]. Finally, taurine antioxidant properties pro-tect pancreatic beta-cells against oxidative stress-induced decrease in function observed in some pathophysiologi-cal conditions [16]. These findings indicate that taurine is involved in distinct central and peripheral processes nec-essary for the control of glucose homeostasis. However, the exact mechanisms by which the amino acid affects blood glucose levels are still unknown [17].
In this study, we investigate the effect of taurine on glu-cose intolerance, lipid profile, Hcy level, TAC, PON activ-ity, and NOx concentration in HFD-induced IR. To the best of our knowledge, there was no previous focus on the effect of taurine supplementation on HHcy in insulin resistant rat model.
Materials and methods
Chemicals
Taurine (Oxford Chemical Company, India). Glucose and Zinc Sulphate (El Nasr Co, Cairo, Egypt). Phenyl acetate,
Tris HCl buffer, sodium nitrite, vanadium (III) chloride, sulfanilamide and N-(1-naphthyl) ethylendiamine dihy-drochloride (Sigma Chemical Company, USA). Calcium chloride (Fluka Chemical Company, USA).
Diet
The control diet for the rats contained 60% starch, 20.7% casein, 0.3% methionine, 5% fat, 7.9% cellulose, 5% miner-als and 1% vitamins mix. The fructose diet contained 60% fructose instead of starch (Harlan-Teklad, TD. 89247, Madison, WI, USA), while the remaining composition was the same.
Animals
Thirty two male Wistar rats were used for the present study after being procured from the animal house of El-Nile Company for Pharmaceutical Products (Cairo, Egypt). The animals were acclimatized for two weeks in the animal house of Misr International University before dietary manipulation. Two rats were housed per wire floored cage in an air-conditioned room (22 ± 2°C) with 12 h light/dark cycle and had free access to standard labo-ratory chow diet (El Nasr Co, Cairo, Egypt), and water ad
libitum. The protocol of the current study was approved
by the Department of Biochemistry Council, Faculty of Pharmacy, Ain Shams University, which has an ethical authority.
Experimental design
Animals weighed 170-190 g at the time of dietary manip-ulation. They were randomly assigned into four groups of eight each, as given below:
i. Control group (C): normal control rats, received control diet.
ii. Taurine group (C + T): taurine-treated normal rats, received taurine (300 mg/kg/day) via i.p. route [18], and control diet.
iii. Fructose-fed group (F): fructose-fed rats, received HFD.
iv. Fructose-fed + taurine group (F + T): taurine-treated fructose-fed rats, received taurine (300 mg/ kg/day) via i.p. route, and HFD.
The animals were maintained in their respective groups for 35 days. OGTT were carried out and animals' body weights were measured at different intervals during the feeding period. Fasting serum glucose, insulin, lipid pro-file, TAC, PON, and NOx as well as plasma Hcy of all ani-mals were measured at the last day (day 35) of the experiment.
Oral glucose tolerance test (OGTT)
2 g/kg body weight [19]. Blood glucose levels were deter-mined at 0 (before glucose administration), 30, 60, 90 and 120 min after glucose administration using an automated glucometer (One Touch-Horizon, Johnson & Johnson (Life Scan) blood glucose monitoring system, Almere, Netherlands).
Sample collection
Blood samples were collected from retro-orbital plexus of the eye after 35 days from 12-h fasted rats into two differ-ent types of vacutainer tubes. The first contained EDTA as anticoagulant for the assay of Hcy, while the second was plain for serum preparation. The samples were cen-trifuged at 3000 rpm for 10 min at 4°C using Centurion centrifuge (K280R, UK). The plasma was then stored at -20°C for the assay of Hcy, while the serum was aliquoted and stored at -80°C for the assay of insulin, glucose, TGs, T-Chol, high density lipoprotein cholesterol (HDL-C), LDL-C, TAC, PON, and NOx. All assays were performed within two months after sample collection.
Biochemical measurements
The concentration of serum glucose was measured by the enzymatic colorimetric GOD-POD procedure [20] using Diamond Diagnostics kit (Germany). Insulin was deter-mined using an enzyme linked immunosorbent assay (ELISA) kit purchased from Linco research (USA) (Cat.# EZRMI-13K). The IR was estimated using the HOMA which is equal to: [fasting serum insulin (μU/ml) × fasting serum glucose (mmol/l)/22.5] [21].
Serum TGs were estimated by GPO-POD enzymatic method [22] using a Biocon kit (India). T-Chol and LDL-C concentrations were determined utilizing enzymatic colorimetric CHOD-PAP method [23,24] using Biocon kits (India). HDL-C was determined by the same method after the precipitation of very low density lipoprotein cholesterol (VLDL-C) and LDL-C [25], and finally, the atherogenic index (T-Chol/HDL-C) was calculated.
Plasma Hcy was assessed by a chemiluminescent tech-nique using ARCHITECT i2000 immunoassay analyzer (Abbott Diagnostics, Germany). Serum TAC was deter-mined by an enzymatic colorimetric method [26], using Biodiagnostic kit (Egypt). PON activity was determined spectrophotometrically using phenyl acetate as substrate [27]. Serum NOx levels were measured by Griess reaction [28].
Statistical analysis
The results were expressed as means ± SEM. To deter-mine the statistical significance of laboratory findings, multiple comparisons were achieved using ANOVA fol-lowed by Tukey test as post hoc test. The correlations between PON and TAC were tested by Pearson's
coeffi-cient (r). P-value ≤ 0.05 was considered statistically signif-icant.
Results
At day zero, there was no significant difference between the body weights of the four study groups. After 35 days of feeding, the HFD resulted in a significant increase in the body weight of group F by 18.1% when compared to group C, and by 15% when compared to group C + T. Taurine was able to attenuate this effect as group F + T was of a significantly less body weight than group F by 7.7% (Figure 1). Meanwhile, there was no significant dif-ference in the water and food intakes among the four study groups.
The analysis of the OGTT at the end of the feeding period and the comparison between area under the curve (AUC) of glycemia during 120 min from control and experimental groups showed that fructose-fed rats devel-oped glucose intolerance (Table 1, Figure 2). The AUC of glucose during OGTT of group F was significantly ele-vated by 8.9% when compared to group C. The AUC of OGTT in group F + T was only elevated by 4% when compared to group C, which was statistically insignifi-cant. The AUC of OGTT in group F + T was significantly lower than that of group F by 4.5%, showing improved glucose tolerance (Figure 3).
The HOMA results of group F were 4.1 fold greater than those of group C, and 3.9 fold greater than those of group C + T. Group F + T showed a significant increase when compared to groups C and C + T, but a significant decrease when compared to group F (Table 2, Figure 4).
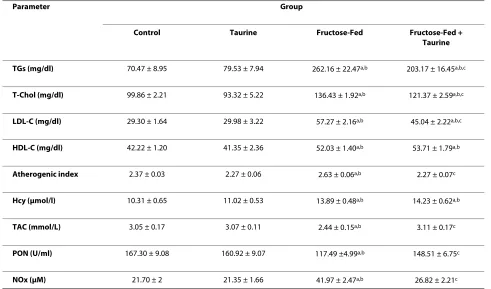
There was no significant change in serum TGs between groups C and C + T. Meanwhile, there was a significant increase in that of group F relative to groups C and C + T, by 272% and 229.6%, respectively. The TGs level of group F + T showed a significant increase by 188.3% and 155.5% when compared to groups C and C + T, respectively, although, it was statistically lower than group F by 22.5% (Table 3).
T was statistically lower than that of group F but not sta-tistically different from those of groups C and C + T (Table 3).
Plasma Hcy of groups F and F + T were not statistically different from each other but they showed a significant increase relative to groups C and C + T (Table 3).
Serum TAC and PON of group F were significantly lower than those of groups C and C + T, meanwhile tau-rine was able to abolish this effect in group F + T. Serum TAC positively correlated with serum PON in groups F (Figure 5) and F + T (Figure 6) at p < 0.05 (r = 0.753 and 0.773, respectively). Serum NOx of group F showed a sig-Figure 1 Effect of HFD and taurine supplementation on weight gain at days 0 and 35 of feeding. Each value is expressed in grams. (a) Significant difference from control group, at P ≤ 0.05. (b) Significant difference from taurine group, at P ≤ 0.05. (c) Significant difference from fructose-fed group, at P ≤ 0.05. Using one way ANOVA followed by Tukey test as post hoc test.
Table 1: Effect of HFD and taurine supplementation on the AUC of the OGTT at days 0, 14, 28, and 35:
Day Group
Control Taurine Fructose-Fed Fructose-Fed +
Taurine
AUC day Zero 0.85 ± 0.011 0.84 ± 0.009 0.84 ± 0.009 0.83 ± 0.017
AUC day 14 0.83 ± 0.013 0.82 ± 0.008 0.90 ± 0.015a,b 0.87 ± 0.009b
AUC day 28 0.83 ± 0.014 0.81 ± 0.007 0.90 ± 0.014a,b 0.87 ± 0.017b
AUC day 35 0.84 ± 0.012 0.84 ± 0.010 0.92 ± 0.07a,b 0.88 ± 0.005b,c
Values are expressed as mean ± S.E.M. Number of rats per group n = 8.
HFD, high fructose diet; AUC, area under the curve; OGTT, oral glucose tolerance test. (a) Significant difference from control group (P ≤ 0.05).
nificant increase when compared to groups C and C + T, an effect that was also abolished in the F + T group (Table 3).
Discussion
The MS is a cluster of cardiovascular risk factors which include obesity, central obesity, atherogenic dyslipidemia and IR [29]. Apart from its association with CVD and dia-betes mellitus, it is a common soil for numerous other clinical disorders [30].
Our work is comparable to that of Kannappan and Aduradha [31], who were able to show that the HFD was able to impair insulin sensitivity and glucose tolerance. This was revealed by the significant elevation in AUC of the OGTT of group F. Such a finding was confirmed by the observed hyperglycemia, hyperinsulinemia and ele-vated HOMA of the same group, and is matched with those of Yadav et al. [32].
Increases in the fructose load to the liver, could elicit rapid responses that ultimately influence hepatic gene expression, glucose disposal, and insulin action. This may be attributed to the fact that fructose metabolism bypasses the regulatory step catalyzed by phosphofruc-tokinase-1. Thus, fructose continuously enters the glyco-lytic pathway resulting in hyperglycemia [33]. The extra
glucose released into the blood stimulates more insulin secretion, leading to reduced insulin sensitivity [34].
Visceral adiposity is known to be increased by HFD [35]. It is associated with IR as a result of the direct deliv-ery of portal blood flow from visceral fat to the liver releasing FFAs [36]. The greater lipolytic capacity of vis-ceral than peripheral adipocytes releases more FFAs to the portal circulation. Furthermore, when visceral adipo-cytes enlarge, they become more insulin resistant than smaller adipocytes [37]. Increased amounts of FFAs directly affect insulin signaling, diminish glucose uptake in muscle, and induce gluconeogenesis in the liver [38].
tyrosine phosphatase activity that negatively regulates insulin signaling. Thus, taurine has the potential ability to prolong as well as increase insulin signaling. It is also pos-sible that taurine being an antioxidant, would make the cells less susceptible to the consequence of stress-induced activation of serine kinases [40].
The consumption of the HFD resulted in hypertriglyc-eridemia, hypercholesterolemia, and increased levels of both LDL-C and HDL-C. Fasting hypertriglyceridemia in IR has largely been attributed to apoB-100 containing TGs rich very low density lipoprotein (VLDL) overpro-duction and secretion by the liver, with a lesser contribu-tion to the impaired VLDL removal [41]. Fructose consumption can promote hepatic lipogenesis because it provides unregulated amounts of lipogenic substrates acetyl-CoA and glycerol-3-phosphate [32]. Fructose can also activate sterol regulatory element binding protein-1c (SREBP-1c) independently of insulin, which then acti-vates genes involved in de-novo lipogenesis [42]. SREBP-1c over-expression was also reported to inhibit insulin
receptor substrate-2 expression, which might contribute to a transitional switch from glycogen synthesis to lipo-genesis [43]. High density lipoprotein (HDL) is the major cholesterol lipoprotein carrier in rats [3], thus, the eleva-tion of serum HDL-C could merely be a refleceleva-tion to the observed increased serum T-Chol.
Taurine can upregulate 7-α-hydroxylase, the rate-limit-ing enzyme in bile acids production [44], and was shown to increase its mRNA levels [45]. Taurine may also decrease cholesterol levels through upregulation of hepatic LDL receptor and/or through improving the binding of LDL to them. Thus, it increases the LDL turn-over in blood [46]. The ability of taurine to decrease the T-Chol level could be the main contributor to the reduced atherogenic index of group F + T.
show that chronic insulin addition was able to induce HHcy that was due to Hcy being transformed to either methionine or cysteine at a reduced rate [9].
Hyperhomocysteinemia could also be explained in light of the observed hypertriglyceridemia which might specif-ically promote lipid deposition in visceral adipose tissue as commonly associated with IR [36]. N-nicotinamide methyltransferase (NNMT) is a major methyltransferase expressed in high amounts in human adipose tissue [47]. It converts nicotinamide into N-methyl nicotinamide at the expense of S-adenosyl methionine as methyl-donat-ing cofactor. The generated S-adenosyl homocysteine could further be converted to Hcy [35]. Thus, the observed HHcy in the fructose-fed rat model of the cur-rent study could be attributed to the increased visceral adiposity accompanying overconsumption of fructose.
The high levels of Hcy could be metabolized into Hcy thiolactone, a physiological substrate of PON protein.
Table 2: Effect of HFD and taurine supplementation on fasting serum glucose, serum insulin and HOMA:
Parameter Group
Control Taurine Fructose-Fed Fructose-Fed +
Taurine
Glucose (mmol/l) 4.62 ± 0.28 4.09 ± 0.19 5.57 ± 0.25a,b 5.35 ± 0.23b
Insulin(μU/ml) 32.26 ± 4.76 38.24 ± 4.15 109.5 ± 7.37a,b 50.71 ± 4.45c
HOMA 6.68 ± 1.13 6.95 ± 0.79 27.24 ± 2.44a,b 11.9 ± 0.88c
Values are expressed as mean ± S.E.M. Number of rats per group n = 8.
HFD, high fructose diet; HOMA, homeostasis model assessment of insulin resistance. (a) Significant difference from control group (P ≤ 0.05).
(b) Significant difference from taurine group (P ≤ 0.05). (c) Significant difference from fructose-fed group (P ≤ 0.05).
Table 3: Effect of HFD and taurine supplementation on fasting serum lipids, TAC, PON, NOx and plasma Hcy:
Parameter Group
Control Taurine Fructose-Fed Fructose-Fed +
Taurine
TGs (mg/dl) 70.47 ± 8.95 79.53 ± 7.94 262.16 ± 22.47a,b 203.17 ± 16.45a,b,c
T-Chol (mg/dl) 99.86 ± 2.21 93.32 ± 5.22 136.43 ± 1.92a,b 121.37 ± 2.59a,b,c
LDL-C (mg/dl) 29.30 ± 1.64 29.98 ± 3.22 57.27 ± 2.16a,b 45.04 ± 2.22a,b,c
HDL-C (mg/dl) 42.22 ± 1.20 41.35 ± 2.36 52.03 ± 1.40a,b 53.71 ± 1.79a,b
Atherogenic index 2.37 ± 0.03 2.27 ± 0.06 2.63 ± 0.06a,b 2.27 ± 0.07c
Hcy (μmol/l) 10.31 ± 0.65 11.02 ± 0.53 13.89 ± 0.48a,b 14.23 ± 0.62a,b
TAC (mmol/L) 3.05 ± 0.17 3.07 ± 0.11 2.44 ± 0.15a,b 3.11 ± 0.17c
PON (U/ml) 167.30 ± 9.08 160.92 ± 9.07 117.49 ±4.99a,b 148.51 ± 6.75c
NOx (μM) 21.70 ± 2 21.35 ± 1.66 41.97 ± 2.47a,b 26.82 ± 2.21c
Values are expressed as mean ± S.E.M. Number of animal per group n = 8.
HFD, high fructose diet; TGs, triglycerides; T-Chol, total cholesterol; LDL-C, low density lipoprotein cholesterol; HDL-C, high density lipoprotein cholesterol; TAC, total antioxidant capacity: PON, paraoxonase activity: NOx, nitric oxide metabolites: Hcy, homocysteine. (a) Significant different from control group (P ≤ 0.05).
correlations revealed between TAC and PON activities of groups F and F + T are convenient.
The significant reduction of TAC in group F could be attributed to the fact that the high fructose delivery to the liver may generate stress-activating molecules, such as methylglyoxal and/or d-glyceraldehyde. These molecules can serve as substrates for AGEs [51]. AGEs could acti-vate NADPH oxidase in endothelial cells. Activation of NADPH oxidase could also occur cause endothelial cells lack CβS and Betaine:homocysteine methyltransferase. Thus, Hcy depends on the methionine synthase pathway for its elimination. HHcy may thus cause a deficiency of folic acid with subsequent deficiency of tetrahydrobiope-trin, and consequently, uncoupling of the endothelial NOS reaction producing superoxide anion (O 2•-) as well as ONOO- rather than NO [52]. Hcy was also shown to reduce the expression of glutathione peroxidase and the secretion and expression of extracellular superoxide dis-mutase [53,54]. Thus, in addition to directly producing ROS, Hcy also reduces the O 2•- anion scavenging capac-ity leading to further elevation of oxidative stress.
Hyperhomocysteinemia could also promote ROS pro-duction by increasing inducible NOS expression which
subsequently increases nitrotyrosine formation [55]. This fact could explain the significant elevation of NOx observed in group F. ROS could also reduce NO bioavail-ability by inactivating it to ONOO-. In this respect, the elevation of serum NOx might indeed reflect the impaired NO bioavailability since ONOO-, as well as NO, are metabolized into nitrites and nitrates [56]. Recently, it has been shown that ONOO-, in the absence of known nitrosative stress-protecting enzymes, could be degraded by catalase enzyme into nitrate (70%) and nitrite (30%) [57]. A finding that may aid in rationalizing the elevated NOx concentration in this fructose-fed model.
Taurine is synthesized from cysteine, the precursor of glutathione (GSH). Hence, taurine supplementation may spare cysteine, thus increasing tissue levels of GSH, restoring TAC as well as PON activity back to normal [58]. In the present study, taurine supplementation was also able to improve the elevated NOx which may have been achieved through lowering inducible NOS gene expression as previously reported by Hsu et al. [59], or through scavenging O 2•- and NO, the precursors of ONOO- under conditions of elevated oxidative stress [60]. These results are matched with those of Yalçınkaya et al. [61], who reported that taurine was not able to improve the diet-induced HHcy, although it was able to improve HHcy-induced ROS production. Thus, further studies are required to define or not whether different dosages and/or durations of taurine supplementation will be able to improve the observed HHcy in this model of IR.
Conclusion
Our study revealed that rats fed on a HFD develop IR as manifested by hyperglycemia, hyperinsulinemia, and ele-vated HOMA. They showed metabolic dyslipidemia as well as HHcy. The HFD also resulted in decreased TAC, decreased PON activity, and increased NOx production. Our results demonstrate that taurine supplementation is able to improve the glucose intolerance, the hyperinsu-linemia and to guard against the drastic increase in HOMA. Taurine is also able to improve dyslipidemia, and to abolish the effect of the HFD on TAC, PON activity, and NOx concentration. Meanwhile, it was not able to attenuate the observed HHcy associated with the devel-opment of IR in the current dose and duration.
Competing interests
The authors declare that they have no competing interests.
Authors' contributions
HOM put the idea of research and developed the study protocol, supervised samples and results interpretation and correlation assessments, and contrib-uted to the revising of the manuscript. EE participated in protocol writing, as well as experimental work, and helped in statistical analysis. LNH supervised samples' collection, preparation and analysis, provided superb scientific guid-ance regarding interpretation and presentation of results, and helped to draft
Figure 5 Correlation between serum PON versus serum TAC in group F.
the manuscript. HMM carried the designed protocol, performed the statistical analysis and contributed to the writing of the manuscript. All authors read and approved the final manuscript.
Acknowledgements
This work received partial financial support from the "Office of Scientific Research", Misr International University, Cairo, Egypt.
Author Details
1Department of Biochemistry, Faculty of Pharmacy, Ain Shams University, Cairo,
Egypt, 2Department of Pharmacology & Toxicology, Faculty of Pharmacy, Ain
Shams University, Cairo, Egypt and 3Department of Biochemistry, Faculty of
Pharmacy, Misr International University, Cairo, Egypt
References
1. Dhingra R, Sullivan L, Jacques PF, Wang TJ, Fox CS, Meigs JB, D'Agostino
RB, Gaziano JM, Vasan RS: Soft drink consumption and risk of
developing cardiometabolic risk factors and the metabolic syndrome in middle-aged adults in the community. Circulation 2007, 116:480-488.
2. Segal MS, Gollub ES, Johnson RJ: Is the Fructose Index more relevant
with regards to cardiovascular disease than the Glycemic Index? Eur J
Nutr 2007, 46:406-417.
3. Girard A, Madani S, Boukortt F, Cherkaoui-Malki M, Belleville J, Prost J:
Fructose-enriched diet modifies antioxidant status and lipid metabolism in spontaneously hypertensive rats. Nutrition 2006,
22:758-766.
4. Avramoglu RK, Basciano H, Adeli K: Lipid and lipoprotein dysregulation
in insulin resistant states. Clin Chim Acta 2006, 368:1-19.
5. Hayden MR, Tyagi SC: "A" is for amylin and amyloid in type 2 diabetes
mellitus. J Pancreas 2001, 2(4):124-139.
6. Çengel A, Sahinarslan A: Nitric oxide and cardiovascular system.
Anadolu Kardiyol Derg 2006, 6:364-368.
7. Najib s, Sanchez-Margalet V: Homocysteine thiolactone inhibits
insulin-stimulated DNA and protein synthesis: possible role of mitogen-activated protein kinase (MAPK), glycogen synthase kinase-3 (GSK-3) and p70 S6K phosphorylation. J Mol Endocrinol 2005, 34:119-126.
8. Fonseca VA, Fink LM, Kern PA: Insulin sensitivity and plasma
homocysteine concentrations in non-diabetic obese and normal weight subjects. Atherosclerosis 2003, 167:105-109.
9. Oron-Herman M, Rosenthal T, Sela BA: Hyperhomocysteinemia as a
component of syndrome X. Metabolism 2003, 52:1491-1495.
10. Uehara SK, Rosa G: Association of homocysteinemia with high
concentrations of serum insulin and uric acid in Brazilian subjects with metabolic syndrome genotyped for C677T polymorphism in the methylenetetrahydrofolate. Nutrition Research 2008, 28:760-766. 11. Patterson S, Flatt PR, Brennan L, Newsholme P, McClenaghan NH:
Detrimental actions of metabolic syndrome risk factor, homocysteine, on pancreatic μ-cell glucose metabolism and insulin secretion. J Endocrinol 2006, 189:301-10.
12. Huxtable RJ: Physiological actions of taurine. Physiol Rev 2001,
72:151-163.
13. Boujendar S, Arany E, Hill D, Remacle C, Reusens B: Taurine
supplementation of a low protein diet fed to rat dams normalizes the vascularization of the foetal endocrine pancreas. J Nutr 2003,
133:2820-2825.
14. Cherif H, Reusen B, Ahn MT, Hoet JJ, Remacle C: Effects of taurine on the
insulin secretion of rat foetal islets from dams fed a low protein diet. J Endocrinol 1998, 159:341-348.
15. Lapson WG, Kramer JH, Schaffer SW: Potentiation of the actions of
insulin by taurine. Can J Physiol Pharmacol 1983, 61:457-463. 16. Kaniuk NA, Kiraly M, Bates H, Vranic M, Volchuck A, Brumell JH:
Ubiquitinated-protein aggregates form in pancreatic beta-cells during diabetes-induced oxidative stress and are regulated by autophagy.
Diabetes 2007, 56:930-939.
17. Carneiro EM, Latorraca MQ, Araujo E, Beltrá M, Oliveras MJ, Navarro M,
Berná G, Bedoya FJ, Velloso LA, Soria B, Martín F: Taurine
supplementation modulates glucose homeostasis and islet function. J Nutr Biochem 2009, 20:503-511.
18. Hung CR: Effect of taurine on gastric oxidative stress and hemorrhagic
erosion in brain ischemic rats. Chin J Physiol 2006, 49(3):152-159. 19. Shimoda I, Koizumi M, Shimosegawa T, Shishido T, Ono T, Sato K, Ishizuka
J, Toyota T: Physiological Characteris tics of Spontaneously Developed
Diabetes in Male WBN/Kob Rat and Prevention of Development of Diabetes by Chronic Oral Administration of Synthetic Trypsin Inhibitor (FOY-305). Pancreas 1993, 8(2):196-203.
20. Barham D, Trinder P: An improved colour reagent for the determination
of blood glucose by the oxidase system. Analyst 1972, 97:142-145. 21. Matthews DR, Hosker JP, Rudenski AS, Naylor BA, Treacher DF, Turner RC:
Homeostasis model assessment: insulin resistance and μ-cell function from fasting plasma glucose and insulin concentrations in man.
Diabetologia 1985, 28:412-419.
22. Nagele U, Hagele EO, Sauer G, Wiedemann E, Lehmann P, Wahlefeld WA,
Gruber W: Reagent for the enzymatic determination of serum total
triglycerides with improved lipolytic efficiency. J Clin Chem Clin Bio
1984, 22:165-174.
23. Fasce CF: Enzymatic colorimetric method determination of total
cholesterol in human serum. Clin Chem 1982, 28:901-907.
24. Assmann G, Jabs HU, Kohnert U, Nolte W, Scheriewer H: LDL-cholesterol
determination in blood serum following precipitation of LDL with polyvinylsulfate. Clin Chim Acta 1984, 140:77-83.
25. Warnick GR, Benderson JM, Albers JJ: Dextran sulphate-Mg2+
precipitation procedure or quantification of high density lipoprotein cholesterol. Clin Chem 1982, 28(6):1379-1388.
26. Koracevic D, Koracevic G, Djordjevic V, Andrejevic S, Cosic V: Method for
measuring antioxidant activity in human fluids. J Clin Pathol 2001,
54(5):356-361.
27. Gan KN, Smolen A, Eckerson HW, La Du BN: Purification of human serum
paraoxonase/arylesterase. Evidence for one esterase catalyzing both activities. Drug Metab Dispos 1991, 19:100-106.
28. Miranda KM, Espey MG, Wink DA: A, rapid simple spectrophotometric
method for simultaneous detection of nitrate and nitrite. Nitric Oxide
2001, 5:62-71.
29. Ogbera AO, Azenabor AO: Hyperuricaemia and the metabolic
syndrome in type 2 DM. Diabetol Metab Syndr 2010, 20:2-24. 30. Mangat C, Goel NK, Walia DK, Agarwal N, Sharma MK, Kaur J, Singh R,
Singh G: Metabolic syndrome: a challenging health issue in highly
urbanized Union Territory of north India. Diabetol Metab Syndr 2010,
23(2):19-26.
31. Kannappan S, Anuradha CV: Insulin sensitizing actions of fenugreek
seed polyphenols, quercetin & metformin in a rat model and metformin in rat model. Indian J Med Res 2009, 129:401-408.
32. Yadav H, Jain S, Yadav M, Sinha PR, Prasad GB, Marotta F: Epigenomic
derangement of hepatic glucose metabolism by feeding of high fructose diet and its prevention by Rosiglitazone in rats. Digest Liver Dis
2009, 41:500-508.
33. Mayes PA: Intermediary metabolism of fructose. Am J Clin Nutr 1993,
58(Suppl):754-765.
34. Hallfrisch J: Metabolic effects of dietary fructose. FASEB J 1990,
4:2652-660.
35. Stanhope KL, Havel PJ: Fructose consumption: potential mechanisms
for its effects to increase visceral adiposity and induce dyslipidemia and insulin resistance. Curr Opin Lipidol 2008, 19:16-24.
36. Bergman RN, Van Citters GW, Mittelman SD, Dea MK, Hamilton-Wessler M,
Kim SP, Ellmerer M: Central role of the adipocyte in the metabolic
syndrome. J Investig Med 2001, 49:119-126.
37. Franck N, Stenkula KG, Ost A, Lindström T, Strålfors P, Nystrom FH:
Insulin-induced GLUT4 translocation to the plasma membrane is blunted in large compared with small primary fat cells isolated from the same individual. Diabetologia 2007, 50:1716-1722.
38. Mlinar B, Marc J, Janež A, Pfeifer M: Molecular mechanisms of insulin
resistance and associated diseases. Clin Chim Acta 2007, 375:20-35.
39. White MF: IRS proteins and the common path to diabetes. Am J Physiol
Endocrinol Metab 2002, 283:E413-22.
40. Nandhini A, Thirunavukkarasu V, Anuradha CV: Taurine modifies insulin
signaling enzymes in the fructose-fed insulin resistant rats. Diabetes Metab 2005, 31:337-344.
41. Adiels M, Boren J, Caslake MJ, Stewart P, Soro A, Westerbacka J, Wennberg
B, Olofsson SO, Packard C, Taskinen MR: Overproduction of VLDL1 driven
by hyperglycemia is a dominant feature of diabetic dyslipidemia.
Arterioscler Thromb Vasc Biol 2005, 25:1697-1703.
Received: 17 March 2010 Accepted: 30 June 2010 Published: 30 June 2010
This article is available from: http://www.dmsjournal.com/content/2/1/46 © 2010 El Mesallamy et al; licensee BioMed Central Ltd.
This is an Open Access article distributed under the terms of the Creative Commons Attribution License (http://creativecommons.org/licenses/by/2.0), which permits unrestricted use, distribution, and reproduction in any medium, provided the original work is properly cited.
42. Matsuzaka T, Shimano H, Yahagi N, Amamiya-Kudo M, Okazaki H, Tamura Y, Iizuka Y, Ohashi K, Tomita S, Sekiya M, Hasty A, Nakagawa Y, Sone H,
Toyoshima H, Ishibashi S, Osuga J, Yamada N: Insulin-independent
induction of sterol regulatory element-binding protein-1c expression in the livers of streptozotocin-treated mice. Diabetes 2004, 53:560-569. 43. Aragno M, Tomasinelli CE, Vercellinatto I, Catalano MG, Collino M, Fantozzi
R, Danni O, Boccuzzi G: SREBP-1c in nonalcoholic fatty liver disease
induced by Western-type high-fat diet plus fructose in rats. Free Rad Bio
Med 2009, 47:1067-1074.
44. Yamori Y, Murakami S, Ikeda K, Nara Y: Fish and lifestyle-related disease
prevention: experimental and epidemiological evidence for anti-atherogenic potential of taurine. Clin Exp Pharmacol Physiol Suppl 2004,
31(Suppl):20-23.
45. Lam NV, Chen W, Suruga K, Nishimura N, Goda T, Yokogoshi H: Enhancing
effect of taurine on CYP7A1 mRNA expression in Hep G2 cells. Amino Acids 2006, 30:43-48.
46. Yang SF, Tzang BS, Yang KT, Hsiao YC, Chang YY, Chan CH, Fu SG, Chen YC:
Taurine alleviates dyslipidemia and liver damage induced by a high-fat/cholesterol-dietary habit. Food Chemistry 2010, 120:156-162.
47. Riederer M, Erwa W, Zimmermann R, Frank S, Zechner R: Adipose tissue
as a source of nictoniamide N-methyltransferase and homocysteine.
Atherosclerosis 2009, 204:412-417.
48. Sonoki K, Iwase M, Sasaki N, Ohdo S, Higuchi S, Matsuyama N, Iida M:
Relations of lysophosphatidylcholine in low-density lipoprotein with serum lipoprotein-associated phospholipase A2, paraoxonase and homocysteine thiolactonase activities in patients with type 2 diabetes mellitus. Diabetes Res Clin Pract 2009, 86(2):117-123.
49. Camps J, Marsillach J, Joven J: Measurement of serum paraoxonase-1
activity in the evaluation of liver function. World J Gastroenterol 2009,
15(16):1929-1933.
50. Bajnok L, Csongradi E, Seres I, Varga Z, Jeges S, Peti A, Karanyi Z, Juhasz A,
Mezosi E: Relationship of adiponectin to serum paraoxonase 1.
Atherosclerosis 2008, 197:363-367.
51. Kelley GL, Allan G, Azhar S: wHigh dietary fructose induces a hepatic
stress response resulting in cholesterol and lipid dysregulation.
Endocrinology 2004, 145:548-555.
52. Matté C, Stefanello FM, Mackedanz V, Pederzolli CD, Lamers ML,
Dutra-Filho CS, dos Santos MF, Wyse AT: Homocysteine induces oxidative
stress, inflammatory infiltration, fibrosis and reduces glycogen/ glycoprotein content in liver of rats. Int J Devl Neuroscience 2009,
27:337-344.
53. Upchurch GR, Welch GN, Fabian AJ, Freedman JE, Johnson JL, Keaney JF,
Loscalzo J: Homocyst(e)ine decreases bioavailable nitric oxide by a
mechanism involving glutathione peroxidase. J Biol Chem 1997,
272:17012-17017.
54. Stralin P, Karlsson K, Johansson BO, Marklund SL: The interstitium of the
human arterial wall contains very large amounts of extracellular superoxide dismutase. Arterioscler Thromb Vasc Biol 1995, 5:2032-2036. 55. Tyagi N, Sedoris KC, Steed M, Ovechkin AV, Moshal KS, Tyagi SC:
Mechanisms of homocysteine-induced oxidative stress. Am J Physiol Heart Circ Physiol 2005, 289:H2649-H2656.
56. Dedon PC, Tannenbaum SR: Reactive nitrogen species in the chemical
biology of inflammation. Arch Biochem Biophys 2004, 423:12-22.
57. Sahoo R, Bhattacharjee A, Majumdar U, Ray SS, Dutta T, Ghosh S: A novel
role of catalase in detoxification of peroxynitrite in S. Cerevisiae.
Biochem Bioph Res Co 2009, 385:507-511.
58. Winiarska K, Szymanski K, Gorniak P, Dudziak M, Bryla J: Hypoglycaemic,
antioxidative and nephroprotective effects of taurine in alloxan diabetic rabbits. Biochimie 2009, 91:261-270.
59. Hsu TC, Chen YC, Tsai CC, Wu JH, Li SL, Tzang BS: Protective effects of
taurine against hepatic abnormality in NZB/W F1 mice fed a hypercholesterolemic diet. Food Chem 2010, 119(1):62-68.
60. Wang BS, Yu HM, Chang LW, Yen WJ, Duh PD: Protective effects of pu-erh
tea on LDL oxidation and nitric oxide generation in macrophage cells.
LWT 2008, 41:1122-1132.
61. Yalçinkaya S, Ünlüçerçi Y, Giris M, Olgaç V, Doğru-Abbasoğlu S, Uysal M:
Oxidative and nitrosative stress and apoptosis in the liver of rats fed on high methionine diet: Protective effect of taurine. Nutrition 2009,
25:436-444.
doi: 10.1186/1758-5996-2-46