R E S E A R C H A R T I C L E
Open Access
Effects of nine weeks isokinetic training on
power, golf kinematics, and driver
performance in pre-elite golfers
James Parker
1,2*, Charlie Lagerhem
1, John Hellström
1,3and M. Charlotte Olsson
1Abstract
Background:It has previously been shown that isotonic strength training can improve driver performance among golfers, though few studies have investigated effects of strength training on swing kinematics together with driver performance. In this study we investigated whether isokinetic rotational training could improve driver performance and swing kinematic variables amongst elite golfers.
Methods:Twenty competitive pre-elite golfers (handicap better than−3.0), 13 men and 7 women, were split into two groups, one group received the isokinetic power training (IK) alongside their normal isotonic pre-season strength-training and the other group continued with their normal isotonic pre-season strength-training regime (IT). The IK group completed 12 sessions of isokinetic power training on a standing rotation exercise (10% body weight at 1 m/s) and barbell squat (25 kg plus 10% body weight at 0.5 m/s). The IT group continued with their normal isotonic pre-season strength-training regime. Participants were tested for rotational power, lower body power, golf swing kinematics, and driver performance before and after a nine-week training period.
Results: After the nine-week training period both the IK and the IT groups increased their dominant side rotational force and power (effect sizes between 0.50–0.96) and magnitude based inference indicated that IK had a likely (> 80%) more beneficial increase in dominant side rotational force and power. For swing kinematics, IK had a likely (> 80%) more beneficial improvement in lead arm speed and acceleration compared to the IT group. For driver performance, IK had a possible (65%) beneficial effect on ball speed and likely (78%) beneficial effect on carry distance when compared to IT, whereas neither of the groups improved club head speed.
Conclusion:In the present study on pre-elite golfers we found that 9 weeks of isokinetic training increased seated rotational force and power, peak arm speed and arm acceleration, ball speed, and carry distance more compared to isotonic training. Even though isokinetic training did not increase CHS, it did result in greater carry distance.
Keywords:Golf biomechanics, Isokinetic training, Power, Driver performance, Kinematics, Performance gains
Background
In competitive golf, the player’s ability to hit the ball a long distance affects the score in a positive way [1], and research highlights the importance of driving distance in relation to golf performance [2]. Initial ball velocity is dependent on centeredness of impact, club head velocity (i.e. magnitude and direction) and club face orientation
[3–5]. Most research investigating driving performance in golf report a strong correlation between club head speed (CHS), initial ball velocity and thus carry (striking distance from impact to landing, excluding roll) [6, 7]. Recent research [8] reports kinematics, segmental sequence of action, and power output as other important factors impacting on driving performance. Thus, many golfers incorporate strength and power training into their training schedule in order to positively influence their swing kinematics. However, there is a paucity of re-search into these training strategies and a better under-standing of how muscular strength and power training
* Correspondence:james.parker@hh.se 1
The Rydberg Laboratory for Applied Sciences, School of Business, Engineering and Science, Halmstad University, Box 823, 301 18 Halmstad, Sweden
2Scandinavian College of Sport, Box 11365, 494 28 Gothenburg, Sweden Full list of author information is available at the end of the article
influence golf swing kinematics and driving performance in elite golfers is required.
Many studies have investigated the correlation between physical capacities and different measures of driver per-formance including CHS, ball speed, and driving distance [9–15]. These correlational studies only measure associa-tions between variables and give little information about which variables can be improved through training. Longitu-dinal studies following changes in both physiological characteristics and driver performance in golf are better able to describe likely cause and effect relationships. Previ-ous strength training interventions in different golf popula-tions have included general strength exercises performing two to three sets of 10–12 repetitions performed two to three times a week over eight to 10 weeks and these studies found improvements in CHS and driving distance among recreational golfer [16–20], and in CHS amongst elite golfers [21]. There is a scarcity of research using fewer exer-cises and specific rotational exerexer-cises, rather than a multi-tude of general strength training exercises, despite the rotational nature of the golf swing. Only a few studies have included rotational tests or incorporated training exercises aimed to mimic the ballistic movements in the golf swing and they found marginal changes in CHS (1.5–1.6%) and in driving distance (4.3%) [16, 21]. Intervention studies using strength training in golf have received some criticism for a lack of research on skilled golfers and inclusion of control groups [1, 8]. The most common performance variable measured is CHS, however a review [8] found that ball speed was the driver performance variable most likely to increase from a strength training intervention. Outcome measures are mostly driver performance variables and do not include swing kinematic variable. Including measure-ment for swing kinematics would allow for a better under-standing of the causality of improvement in driver performance from strength training.
Most strength and power intervention studies in golf have used driver performance variables as their outcome measurements whereas swing kinematic variables are rare [17]. The ability to generate and coordinate force through hips, torso, and shoulders during the down-swing influences both down-swing kinematics and driver per-formance. It is therefore useful to understand how training influences not only driver performance but also the swing kinematics. Previous strength training [17], and motor control [22, 23] intervention studies which have investigated both changes in swing kinematics and driver performance have studied mainly male recre-ational level golfers (one female participant in total [23]). These studies found a significant reduction (−13%) in pelvis torso axial rotation at top of backswing (x-factor) [17]; a 2.7°- increase in pelvis-thorax separation during the early downswing (x-factor stretch) [22]; a 14% increase in pelvis, torso, and wrist velocity [17, 22]; and
an increase in driver performance variables including CHS [17], ball speed [17], and carry distance [17, 22]. These studies indicate that for amateur golfers, reducing x-factor and increasing x-factor stretch have a positive impact on driver performance, however, if this holds true for high-level golfers as well is not known. Bulbulian et al. [23] included one woman out of seven participants and no other training intervention investigating swing kinematics has included women golfers. Cross-sectional studies comparing men and women golfers have found a number of differences in both physiological and golf swing kinematic variables. Horan et al. [24] studied movement variability and found that women exhibited higher variability in thorax-pelvis coupling mechanics during the downswing variability when compared to men but both groups showed similar end-point trajec-tory variability (hands and clubhead). Egret et al. [25] assessed differences in swing kinematics between experi-enced (average handicap −6.3) male and female golfers and found specifically hip and shoulder joint rotation angles at top of backswing differed between groups. Interestingly, they did not find any difference in club-head speed. Zheng et al. [26], compared swing kinemat-ics between male and female golfers on the PGA and LPGA tour and found differences in particular in max-imum velocity of the wrists, right elbow extension, tim-ing of left wrist extension velocity, and club head velocity. A greater X-factor stretch is assumed to make use of the stretch-shortening cycle (SSC), where a greater stretch of the torso musculature is assumed to allow for greater forces to be developed [1, 22]. Bulbu-lian et al. [23] reported a reduced electromyography ac-tivity in the torso and no change in driver performance after an intervention to shorten the backswing. These authors proposed that performance may have been maintained by increased loading of the shoulder muscu-lature instead of torso muscumuscu-lature. Aside from the shoulder, performance maintenance may have been maintained by an increase in work done both below (lower body musculature) and/or above (upper body, shoulders, and arms) the torso. There is a paucity of re-search in physical training interventions on high-level golfers, which also study how the training intervention influence swing kinematics including the shoulder in addition to the pelvis-thorax segments.
studies using multi-joint isokinetic training showed improved peak force and performance in dynamic move-ments [28, 29]. A recent study compared isotonic and isokinetic multi-joint (squat) training in different team sports athletes [28] and found that isokinetic multi-joint training improved select performance variables such as sprint and drop jump to a greater extent than traditional isotonic training. The use of multi-joint isokinetic training in a golf-specific movement and its influence on swing kinematics and driver performance among high-level golfers has not been studied previously. Thus, the purpose of this study was to investigate if isokinetic rotational and lower body strength training over 9 weeks is more effective than isotonic strength training in improving rotational and lower body power, pelvis-thorax and shoulder kinematics, and driver performance among high-level golfers.
Methods
Participants
Twenty intercollegiate golfers (13 men and 7 women) all competing at a national level or higher participated in the study. All subjects reported a handicap of −3.0 or better registered with the Swedish golf association at the time of the study. All subjects were free of musculoskeletal injuries for the previous 12 months and had a minimum of 3 years golf-specific strength training experience. The sub-jects did not all have the same swing coach. The study design was an open trial study since the participants could choose which group to belong to. Their choices were mainly based on individual travelling schedules and distance to the training facility during the investigation period.
There were no drop-outs in the study. This study was approved by the regional Swedish ethics committee (Lund, Dnr 2016/12) and all the participants gave written consent to participate in the study.
Procedures
A training study was designed to investigate the differ-ence between isotonic and isokinetic power training in golf. The load for the isokinetic group was controlled by a computerized robotic engine system (1080 Quantum Synchro, 1080 Motion AB, Lidingö, Sweden). The advantage of computerized robotic engine system is that isokinetic resistance can be applied to functional multi-joint exercises, such as golf specific rotational exercise and loaded squats [28].
Training
The participants were divided into two groups, one group (n = 10, 6 men and 4 women) received the isokinetic (constant-speed) power training (IK) and the other group (n= 10, 7 men and 3 women) continued with their normal
isotonic (constant load) pre-season strength-training regime and served as the reference isotonic group (IT).
The training period lasted 9 weeks, with 1 week of cessation in the middle of the period to accommodate competition calendars. Both groups resistance trained on average three times a week and had individualised programs of isotonic and isometric exercises performed both with free weights and body weight resistance as well as ballistic rotation exercises performed during the nine-week period. For the IK group, two isokinetic exer-cises replaced the ballistic rotation exerexer-cises and isotonic power exercises in their regular training program, where isokinetic power training was performed on average twice a week. The two isokinetic exercises, performed in a computerised robotic engine system, consisted of an isokinetic standing rotation exercise designed to repli-cate the golf swing and a loaded isokinetic squat. Both isokinetic exercises consisted of three sets of five repeti-tions where the isokinetic rotation exercise was per-formed with 10% body weight resistance and the speed set at 1 m/s concentrically and 4 m/s eccentrically. The loaded squat was performed with 25 kg barbell plus 10% body weight resistance and the speed set at 0.5 m/s concentrically and 4 m/s eccentrically.
Tests
All tests were performed just before the beginning of the 9 week training intervention and within 1 week of the last training session.
Power testing Lower and upper body power tests were assessed using countermovement jumps with arm swing (CMJ), loaded squat jumps, and sitting abdominal rota-tion. Participants performed three repetitions on each test with 5 min rest between the repetitions; the repeti-tion with the highest value on each weight was recorded. The countermovement jumps were performed indoors, measurements of jump height were recorded with the use of infrared sensors (Ivar jump and speed analyzer, LN sport consult, Sweden). The subjects were instructed to stand in an upright position with their feet in a shoulder-width stance. The jump was initiated with a countermovement motion and continued in an explosive upward motion with the assistance of the arms. During the landing, the subjects aimed at finishing at the same position as the jump was initiated from.
conduct a technically correct and safe loaded squat jump at the higher loads.
Measurements of sitting isotonic abdominal rotational power were obtained in 1080 Quantum. The test used in this study consisted of a modified version of the test by Andre et al. [30]. The subjects were instructed to sit on a bench (height 46 cm, length 100 cm) with their feet on the floor. The bench was placed 125 cm from the handle which was set at shoulder height. The subjects were instructed to grip the handle and rotate their torso force-fully, with straight arms, and then slowly return to the starting position. Three repetitions on the left side and three repetitions on the right side were performed using a load of 10% of body weight. Rotating to the left was classi-fied as the dominant side for a right-handed golfer as this is the same direction as they perform in the golf swing, and thus of main interest in this study. The highest peak force, power, and velocity value of the three repetitions on each side was used for later analyses.
Golf Swing analysis: All golf tests were performed at a driving range where subjects hit out onto a driving range. Swing kinematic data was using a four sensor electromag-netic motion capture system at 240 Hz (Polhemus Inc. Colchester, VT, USA) together with Advanced Motion Measurement software (AMM 3D, Phoenix, Arizona, USA) equipment previously used in golf research [31, 32]. The orientation of the right-handed orthogonal global co-ordinate system was such that the positive x-axis pointed parallel to the shot direction, the positive z-axis vertically upwards, and the positive y-axis forward from the right-handed golfer. The kinematics variables are described in Table 1 and placement of the sensors and digitization are described in Table 2. Thorax and pelvis rotations were calculated using the joint coordinate system method [33]. The lead arm segment was calculated using the humerus joint coordinate system (first option) [34] relative to the thorax.
The subjects used their own golf club and premium Callaway range balls and were told to aim at a target set approximately 350 m away from the striking zone. All subjects performed a golf specific warm up of their choice for a maximum of 10 min. Subjects were then instructed to hit 5 balls with their driver and use the swing that was as‘normal‘as possible, for example when playing from a tee on a standard par-4 hole. Between each shot, subjects were instructed to walk out of the tee (strike) area and wait for 30 seconds before com-mencing their pre-shot routine for the subsequent trial. We chose to use a five trial procedure primarily due to the participants’time constraints, and such five trial pro-cedures have been used in previous research [24, 35]. The swing where highest CHS was achieved was then used for subsequent analysis. Golf ball launch analysis: CHS, ball speed, and carry distance data were collected
using a launch monitor (Trackman3e, v.3.2, Trackman, Denmark) placed 2.5 m behind the golf ball.
Statistical analysis
All results are reported as mean ± standard deviation (SD). A probability level of 0.05 was used in this study. Table 1A description of how swing kinematic variables were determined
Definitions
Transition Is determined as the point of lowest angular velocity for a segment, between initiation of the backswing and impact.
X-factor The change in amplitude of spinal rotation (difference between thorax and pelvis rotation) at pelvis transition
X-factor stretch
The maximum increase in X-factor during the downswing
X-factor stretch rate
The average speed of X-factor stretch
Shoulder stretch
The change in amplitude of lead arm horizontal adduction between thorax transition and lead arm transition
Shoulder stretch rate
The average speed of shoulder stretch
Pelvis acceleration
The average acceleration of the pelvis between pelvis transition and pelvis peak speed
Thorax acceleration
The average acceleration of the thorax between thorax transition and peak thorax speed
Lead arm acceleration
The average acceleration of the lead arm between lead arm transition and lead arm peak speed, measured around the local Z-axis at the shoulder joint
Table 2Placement of magnetic sensors and description of landmarks used to create each segment
Segment Sensor placement
Landmarks used for segment digitization
Club Below Ggrip Top of grip.
Hozel.
Club head, bottom groove at heel.
Club head, bottom grove at toe.
Club head, top groove at toe.
Left arm Posterior upper arm
Left acromion process.
Lateral epicondyle
Medial epicondyle.
Thorax/Upper-body
On T5 Left acromion process.
Right acromion process.
Right side mid thorax, high.
Right side mid thorax, low.
Pelvis Sacrum Left greater trochanter.
Right greater trochanter.
An independent t-test was performed to check for pre-test differences between IT and IK groups and between men and women. Since we could only recruit 7 female participants to this study, statistical analyses divided by sex, in the groups (IK = 4 and IT = 3 women) were not feasible. However, in the result figures below we show the individual values for each participant along with the group mean to visualise change for the men and women in the study. Magnitude based inference (MBI) was cal-culated using an online published spreadsheet [36], in-ferences were based on the disposition of the confidence limit for the mean difference to the smallest worthwhile change (0.2 between-subject SD). The probability that a change in testing score was beneficial, harmful or trivial was identified according to the magnitude-based infer-ences approach [37]. Descriptors were assigned using the following scales: 0–4.9% very unlikely; 5–24.9% unlikely; 25–74.9% possibly; 75–94.9% likely; 95– 99.49% very likely; >99.5% most likely [38]. Within group standardized mean difference effect size (ESw)
was calculated by using the mean change of the group (Δ IT or Δ IK) in the numerator of the equa-tion and using the pre-test pooled standard deviaequa-tion
in the denominator. Pre-test pooled standard devi-ation was calculated using pre-test values from the sample as whole (both IK and IT) [39]. Between-group standardized mean difference effect size (ESb)
was calculated by using the difference between IK ESw and IT ESw. An effect size of 0.20–0.50 are
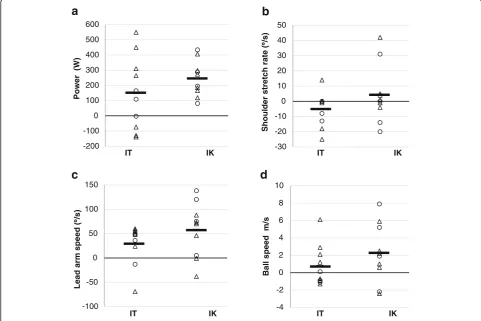
con-sidered “small” in magnitude, those > 0.50–0.80 are “medium” and those above 0.80 are “large” as sug-gested by Cohen [40]. As well as presenting ES and re-sults from MBI analysis this study presents standard deviations and figures describing change for each partici-pant (Fig. 1a–d) to improve the transparency of the results.
Results
Based on previous studies [24–26] showing cross-sectional differences in swing kinematics between men and women, we analysed the pre-training measurements variable for differences between sexes (Table 3). No dif-ferences were found before the training period began between men (n= 13) and women (n= 7) in swing kinematic-related variables (p> 0.05), whereas both
-200 -100 0 100 200 300 400 500 600
Power
(W)
IT IK -30 -20 -10 0 10 20 30 40 50
S
h
oul
d
er s
tretch rate (
/s)
IT IK
-100 -50 0 50 100 150
Lead arm
speed (
/s)
IT IK -4 -2 0 2 4 6 8 10
Bal
l speed
m/s
IT IK
a
b
c
d
power tests and performance measures differed between sexes (Table 3) as would be expected in highly skilled golfers [15, 21, 24, 26].
Differences before the training intervention between the two training groups IK and IT were also investi-gated and Table 4 shows that mean age, height, weight and handicap between the two groups were not different at the start of the study. In addition, there was no statistically significant difference be-tween groups before the training study began (p > 0.1) for any of the intervention related variables assessed, including rotational and lower body power, swing kinematics and driver performance variables (Table 4).
Table 3Descriptive statistics and an independent t-test on physical, kinematics, and driver performance variables for men and women at the start of study
Men (n= 13) Women (n= 7) Sigp-value
Anthropometrics
Age (years) 21.8 ± 2.1 22.8 ± 1.8 0.30
Height (cm) 178.7 ± 7.3 169.7 ± 5.6 0.01
Weight (kg) 76.8 ± 11.0 65.7 ± 9.6 0.04
Hhandicap +0.2 ± 1.5 +0.7 ± 1.0 0.40
Tests for power
CMJ (cm) 43.7 ± 7.1 35.0 ± 5.5 0.01
Seated rotation dominant side
Power (w) 793.8 ± 246.9 352.6 ± 96.8 0.00
Velocity (m/s) 3.5 ± 0.6 2.6 ± 0.3 0.00
Force (N) 261.8 ± 4.4 163.0 ± 27.2 0.00
Seated rotation non-dominant side
Power (w) 812.3 ± 231.7 366.9 ± 115.3 0.00
Force (N) 258.4 ± 36.6 169.3 ± 31.3 0.00
Velocity (m/s) 3.3 ± 0.6 2.6 ± 0.4 0.01
Kinematics
Pelvis speed (°/s) 458.3 ± 64.1 428.0 ± 51.3 0.30
Thorax speed (°/s) 712.5 ± 74.1 685.9 ± 62.8 0.43
Lead arm speed (°/s) 1050.5 ± 117.6 947.7 ± 87.3 0.06
Pelvis acceleration (°/s2) 2008.2 ± 556.9 1841.3 ± 316.2 0.48
Thorax acceleration (°/s2) 3310.9 ± 670.7 3392.7 ± 516.9 0.78
Lead arm acceleration (°/s2) 5433.5 ± 1196.7 5135.4 ± 947.2 0.58
X-factor (°) 49.2 ± 9.4 50.9 ± 10.4 0.71
X-factor stretch (°) 7.1 ± 5.5 11.7 ± 7.9 0.14
X-factor stretch rate (°/s) 44.0 ± 36.5 70.7 ± 38.4 0.14
Shoulder stretch (°) 1.7 ± 1.3 1.6 ± 1.5 0.85
Driver performance
Clubhead speed (m/s) 49.1 ± 3.1 41.6 ± 2.3 0.00
Ball speed (m/s) 68.5 ± 4.9 57.1 ± 3.6 0.00
Carry distance (m) 218.5 ± 22.7 179.9 ± 13.6 0.01
Values are mean ± standard deviation andp-values are from independent t-tests
Table 4Descriptive statistics for the IK and IT group at the start of study
IK Group (n= 10) IT Group (n= 10) p-value
Age (years) 22.0 ± 4.0 22.0 ± 4.0 0.45
Height (cm) 175.0 ± 13.0 178.0 ± 14.0 0.26
Weight (kg) 75.0 ± 22.0 71.0 ± 15.0 0.36
handicap +0.4 ± 1.0 +0.4 ± 1.7 0.90
Values are mean ± standard deviation andp-values are from independent t-tests.
Rotational and lower body power
In this study, both dominant and non-dominant side force, velocity, and power were measured in the seated ab-dominal rotation test. After the nine-week-training period, both the IK and the IT groups increased their dominant side rotational power to a large (ESw= 0.82) and medium
(ESw = 0.50) extent respectively (Fig. 1a, Table 5).
Between-group ES indicated a small (ESb= 0.32)
improve-ment in favor of the IK group compared to the IT, and MBI indicated that IK had a likely (85%) more beneficial increase in dominant side rotational power compared to the IT (Table 5). Similarly, both training modalities re-sulted in improvements in dominant side rotational force with a large effect (ESw= 0.96) for the IK group and a
medium effect (ESw= 0.77) for the IT group (Table 5). ESb
statistics together with MBI demonstrated a near small (ESb= 0.19) but likely (MBI = 80%) more beneficial effect
of isokinetic training on dominant side rotational force compared to isotonic strength training (Table 5). For dominant side rotational speed both groups increased with a small (ESw= 0.45, IK) to medium (ESw= 0.5, IT)
improvement. However, any difference between groups was considered none to small (Table 5).
Results for force, velocity and power in the non-domi-nant side rotations were less clear compared to the dom-inant side. Both the IK and IT groups had medium to large improvements in force and power, but in velocity the IT group increased more compared to the IK group (ESb=−0.45; Table 5). MBI statistics, on the other hand,
indicated no clear advantages for either training modal-ity in any of the non-dominant side rotational variables force, velocity or power (Table 5).
For lower body power, both groups responded simi-larly, where the nine-week-training period had no effect
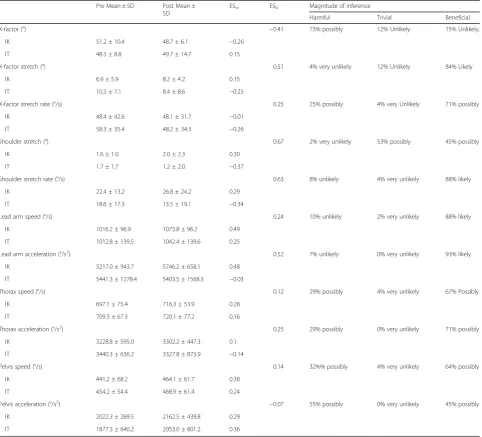
Table 5Upper body rotational force, power and velocity and lower body power measurements for pre and post training
Pre Mean ± SD
Post Mean ± SD
ESw ESb Magnitude of inference
Harmful Trivial Beneficial
Seated rotation dominant Side
Force 0.19 16% unlikely 4% very unlikely 80% likely
IK (N) 230.0 ± 53.8 287.7 ± 58.1 0.96
IT 224.4 ± 68.5 270.7 ± 48.5 0.77
Power 0.32 14% very unlikely 0% very unlikely 85% likely,
IK (w) 697.5 ± 277.5 942.0 ± 276.4 0.82
IT 581.3 ± 318.5 731.4 ± 278.7 0.5
Velocity −0.11 0% very unlikely 100% most likely 0% very unlikely
IK (m/s) 3.3 ± 0.6 3.6 ± 0.6 0.45
IT 3.0 ± 0.7 3.4 ± 0.7 0.5
Seated rotation non-dominant side
Force (N) −0.10 65% possibly 6% unlikely 29% possible
IK 239.5 ± 52.0 279.3 ± 37.8 0.71
IT 214.9 ± 58.4 260.2 ± 58.4 0.82
Power (W) 0.00 50% possibly 1% very unlikely 49% possibly
IK 725.9 ± 271.9 870.6 ± 247.0 0.5
IT 586.9 ± 310.0 732.8 ± 289.5 0.5
Velocity(m/s) −0.45 0% very unlikely 100% most likely 0% very unlikely
IK 3.28 ± 0.5 3.48 ± 0.7 0.32
IT 2.89 ± 0.7 3.36 ± 0.7 0.79
Lower body
CMJ (cm) −0.11 45% Possible 45% possibly 10% very unlikely
IK 38.2 ± 8.4 38.0 ± 9.1 −0.03
IT 43.1 ± 6.4 43.7 ± 6.6 0.08
LSJ 20 kg (W) 0.02 47% possibly 1% very unlikely 52% possibly
IK 1333.9 ± 209.4 1385.6 ± 227.2 0.22
IT 1288.4 ± 267.5 1335.5 ± 267.5 0.20
on CMJ (ESw=−0.03 IK and 0.08 IT) and a small effect
on 20 kg loaded squat jumps (ESw= 0.22 IK and 0.20 IT)
(Table 5).
Swing kinematics
Results for all measured swing kinematic variables are presented in Table 6. For a number of variables, includ-ing shoulder stretch rate (ESw= 0.29 for IK and −0.34
for IT), the groups showed different directions of change (Fig. 1b). After the nine-week training period x-factor stretch (ESb= 0.51), shoulder stretch rate (ESb = 0.63),
and arm acceleration (ESb= 0.52) had a likely (≥80%)
beneficial effect from isokinetic training compared to isotonic strength training (Table 6). Furthermore, lead
arm speed had a small increase in both IK (ESw= 0.49)
and IT (ESw= 0.24) groups, whereas lead arm
acceler-ation had a small increase only in the IK group (ESw=
0.48). Comparisons of the two groups showed that isokinetic training had a likely more beneficial (> 80%) improvement in lead arm speed and acceleration (ESb=
0.24 and ESb= 0.52, respectively) compared to isotonic
strength training (Fig. 1c, Table 6).
Driver performance variables
After the nine-week training period, CHS showed no improvements in neither the IK (ESw= 0.17) nor the IT
(ESw= 0.18) groups (Table 7). However, both IK and IT
increased ball speed and carry with isokinetic training showing a small (ESb = 0.21) and possible (65%) more
Table 6Swing kinematics measurements for pre and post training period
Pre Mean ± SD Post Mean ±
SD
ESw ESb Magnitude of inference
Harmful Trivial Beneficial
X-factor (°) −0.41 73% possibly 12% Unlikely 15% Unlikely,
IK 51.2 ± 10.4 48.7 ± 6.1 −0.26
IT 48.3 ± 8.8 49.7 ± 14.7 0.15
X-factor stretch (°) 0.51 4% very unlikely 12% Unlikely 84% Likely
IK 6.9 ± 5.9 8.2 ± 4.2 0.15
IT 10.5 ± 7.1 8.4 ± 8.6 −0.25
X-factor stretch rate (°/s) 0.25 25% possibly 4% very Unlikely 71% possibly
IK 48.4 ± 42.6 48.1 ± 31.7 −0.01
IT 58.3 ± 35.4 48.2 ± 34.3 −0.26
Shoulder stretch (°) 0.67 2% very unlikely 53% possibly 45% possibly
IK 1.6 ± 1.0 2.0 ± 2.3 0.30
IT 1.7 ± 1.7 1.2 ± 2.0 −0.37
Shoulder stretch rate (°/s) 0.63 8% unlikely 4% very unlikely 88% likely
IK 22.4 ± 13.2 26.8 ± 24.2 0.29
IT 18.6 ± 17.3 13.5 ± 19.1 −0.34
Lead arm speed (°/s) 0.24 10% unlikely 2% very unlikely 88% likely
IK 1016.2 ± 96.9 1073.8 ± 96.2 0.49
IT 1012.8 ± 139.5 1042.4 ± 139.6 0.25
Lead arm acceleration (°/s2) 0.52 7% unlikely 0% very unlikely 93% likely
IK 5217.0 ± 943.7 5746.2 ± 658.1 0.48
IT 5441.3 ± 1278.4 5403.5 ± 1568.3 −0.03
Thorax speed (°/s) 0.12 29% possibly 4% very unlikely 67% Possibly
IK 697.1 ± 75.4 716.3 ± 53.9 0.28
IT 709.3 ± 67.3 720.1 ± 77.2 0.16
Thorax acceleration (°/s2) 0.25 29% possibly 0% very unlikely 71% possibly
IK 3228.8 ± 595.0 3302.2 ± 447.3 0.1
IT 3440.3 ± 636.2 3327.8 ± 873.9 −0.14
Pelvis speed (°/s) 0.14 32%% possibly 4% very unlikely 64% possibly
IK 441.2 ± 68.2 464.1 ± 61.7 0.38
IT 454.2 ± 54.4 468.9 ± 61.4 0.24
Pelvis acceleration (°/s2) −0.07 55% possibly 0% very unlikely 45% possibly
IK 2022.3 ± 269.5 2162.5 ± 439.8 0.29
IT 1877.3 ± 640.2 2053.0 ± 801.2 0.36
beneficial effect on ball speed when compared to IT and a medium (ESb= 0.59) likely (78%) more beneficial effect
on carry distance when compared to IT (Fig. 1d, Table 7).
Discussion
The main findings of this study are that both isokinetic and isotonic strength training over a 9-week period had a moderate to large effect on improving rotational power, force, and velocity in pre-elite golfers. However, with isokinetic training rotational power and force im-proved more compared to isotonic strength training, whereas speed improved to a similar degree in the two groups. Interesting findings for swing kinematics in-cluded the between-group differences in X-factor, X-fac-tor stretch, thorax acceleration, shoulder stretch, and shoulder stretch rate. The larger improvements seen with isokinetic training in rotational power and utilisa-tion of SSC characteristics translated into a higher ball speed, but not into higher CHS, when compared to isotonic strength training.
Changes in force velocity and power
Many methods exist for increasing muscular force, velocity, and power. We chose to investigate the effects of performing a functional exercise simulating the golf swing using isokinetic training, an area less investigated. Both the IK and IT group improved dominant side rotational force, power, and velocity but IK had a likely (80–85%) larger improvement in force and power compared to IT group. No previous studies have investigated multi-joint isokinetic training in golf performance but results from a recent study using the same isokinetic device found that isokinetic lower body training in different team sport athletes resulted in superior jump and sprint performance when com-pared to isotonic training [27]. Another study looking at upper-body multi-joint isokinetic training in
beginners compared to a non-exercising control
group, found significant increases in select upper body exercises in the isokinetic group [29]. Isokinetic training has been proposed to increase the number of motor neurons recruited and produce a more syn-chronous firing of motor neurons than dynamic train-ing alone [41]. The ability to generate maximal muscular power is considered the most important neuromuscular function in sports performance [42, 43] and the isokinetic training performed by the IK group likely (85%) had a beneficial effect on their dominant side rotational peak power. Previous re-search comparing effects of resistance training among men and women suggest that, whilst men show greater absolute strength and power, both recreational and elite male and female athletes respond in a simi-lar way to resistance training and power training pro-grams [44–46].
Changes in kinematics
Improved knowledge of different physical training methods, their importance and impact on the golf swing may allow for a more efficient use of training time. This study implemented only two training exercises into the regular training program of the IK group, one of which was a golf-specific isokinetic rotational movement aimed to mimic the ballistic movements in the golf swing and improve driver performance. Our results presented mod-erately sized between group differences (ESb) for x-factor
(0.41), x-factor stretch (0.51), thorax acceleration (0.25), shoulder stretch (0.67), and shoulder stretch rate (0.63) in support of isokinetic training. Further analysis of SSC characteristics showed that IT generally worsened slightly at both the torso and shoulder whilst the IK group showed improvement at the shoulder whilst maintaining SSC parameters in the trunk. Our results for the IT group where small decreases in several swing kinematic variables Table 7Pre and post training period measurements of club head speed, ball speed, and carry distance
Pre Mean ± SD
Post Mean ± SD
ESw ESb Magnitude of inference
Harmful Trivial Beneficial
Carry distance (m) 0.31 16% unlikely 6% unlikely 78% likely
IK 197.2 ± 28.6 213.2 ± 34.4 0.59
IT 212.7 ± 24.8 220.4 ± 23.3 0.28
Ball speed (m/s) 0.21 4% very unlikely 32% possible 65% possible
IK 63.4 ± 7.6 65.6 ± 6.6 0.32
IT 65.6 ± 6.7 66.3 ± 6.4 0.11
Club head speed (m/s) −0.01 9% Unlikely 84% Likely 7% Unlikely
IK 46.1 ± 4.4 46.9 ± 4.2 0.17
IT 46.8 ± 5.0 47.7 ± 4.4 0.18
(ESw0.25–0.34) were found was rather unexpected since
the IT group did improve force, power, and speed in addition to maintaining CHS and BS. The reason for this decrease is difficult to explain but may highlight that a number of different swing techniques are able to maintain CHS and BS. Nevertheless, previous research has shown that increases in strength and power through isotonic training can influence swing kine-matics (mechanics) including changes in thorax vel-ocity [21] and x-factor stretch rate [21] and these findings support our results for the IK group, but not for the IT group. Our results demonstrate isokinetic and isotonic strength training programs can modify swing kinematics differently, and IK training appears to be superior for maintaining or improving SSC characteristics among pre-elite golfers with previous experience of isotonic training methods.
Changes in driver performance
Our results revealed that isokinetic training may have a beneficial effect on carry distance and ball speed, whereas CHS showed no change over the training period for either group. The isotonic training group in the current study saw no increase in either CHS or ball speed, and only a small (ESw= 0.28) increase in carry
distance. This is in contrast to strength and plyometric intervention studies on recreational golfers where im-provements in CHS, ball speed or driving distance have been found [16–19]. However, it is well documented that eliciting changes amongst an elite population is more difficult [21] and the negligible change in ball speed (1.1%) and CHS (1.9%) found amongst the IT group are similar to findings by Doan et al. [21] who reported a trivial increase of 1.6% in CHS among intercollegiate level golfers after 11 weeks of strength training. Pre-elite golfers with a history of strength training, as in our study, may have already adapted to isotonic training methods and further isotonic training may not elicit fur-ther improvements in driver performance.
All participants in this study had an extensive back-ground in isotonic strength training and plyometric train-ing, but little to no prior experience of isokinetic training. The isokinetic group increased in carry distance (7.6%) with no change in CHS (1.7%), which is similar to Fletcher et al. [16] results who also found a greater increase in carry distance (4.3%) compared to CHS (1.5%) from weight and plyometric training among good club golfers with very little prior strength and conditioning experience. We cannot exclude the possibility that the training adapta-tions seen in our study are in part due to an unaccustomed exercise modality. Nevertheless, we show that isokinetic training elicits additional responses in golfers already well adapted to plyometrics and isotonic training. This is similar to a previous multi-joint isokinetic intervention study in
athletes with considerable experience in strength and power training [28]. Carry distance and ball speed are not only dependent on club head velocity, but also centered-ness of impact, and clubface orientation [4, 5]. An explan-ation for the improvement in ball speed and carry distance in the IK group could be that their greater lead arm accel-eration resulted in reaching lead arm peak speed earlier in the downswing which may allow for improved centered-ness of impact, clubhead path, or clubface orientation at impact. Our results reported increased force development characteristics in both a seated rotation test for power and in the golf swing, possibly suggesting that this increase may transfer into improved centeredness of impact or clubface orientation at impact, greater ball speed, longer carry dis-tance and improved driver performance.
In the current study we included a reference group of highly skilled golfers to account for natural occurring changes in performance during this training period, using an open trial method design, which permitted the participants to self-select experimental group to allow for international competition schedules; both the IK and IT groups had average handicaps better than scratch. There are some uncontrolled variables that may have in-fluenced the training adaptations; for example, the current study did not investigate load and intensity of the normal pre-season training regimens. Both these var-iables are well known to influence strength and power training adaptations [14, 28]. Furthermore the individua-lised pre-season training programs or technical swing changes could influence results and should be investi-gated in future studies. Analyses of the change in size of standard deviation can help describe the change in homogeneity of a group. For instance the IK group showed a decrease in size of standard deviation in pre to post X-factor whilst the IT groups’ standard deviation showed the opposite trend. This suggests that despite individualised training program and different coaches for each participant the IK group became more similar after the training period.
research on isotonic resistance training. However, there is a paucity of research investigating change in swing kinematics among golfers and even fewer studies com-paring change in swing kinematics between men and women, an area in need of further investigation.
Conclusion
Isokinetic training among pre-elite golfers with a history of strength and conditioning training increased rota-tional power development, SSC characteristics around the shoulder, lead arm peak speed, ball speed, and carry distance more compared to isotonic training. Even though isokinetic training did not increase CHS, it did result in greater carry distance and thus improved driver performance.
Abbreviations
CHS:Club head speed; CMJ: Countermovement jump; ESb: Between-group
effect size; ESw: Within group effect size; IK: Isokinetic power training group;
IT: Isotonic strength training group; MBI: Magnitude-based inference; SSC: Stretch-shortening cycle
Acknowledgements
We are grateful to the participants who volunteered in the study.
Funding
This study was supported by the Knowledge Foundation (KK-stiftelsen) of Sweden under Grant 2012/0319 to MCO. The KK provided the funding for the present study but was not involved in the analysis, interpretation or the right to approve or disapprove publication of the research.
Availability of data and materials
The datasets used and analysed during the current study are available from the corresponding author on reasonable request.
Authors’contributions
JP was responsible for the original study design and contributed to all parts of the work of this study. CL was involved in the data collection, data analysis, and manuscript preparation. MCO was involved in the study design, data analysis, and manuscript preparation. MCO,
JP, and JH were involved in the theoretical conceptualization and in the interpretation of the study data. All authors commented on the draft, read and approved the final manuscript.
Ethics approval and consent to participate
This study was approved by the Regional ethics committee in Lund, Sweden (Dnr 2016/12) and all the participants provided written consent to participate in the study.
Consent for publication Not applicable.
Competing interests
The authors declare that they have no competing interests.
Publisher’s Note
Springer Nature remains neutral with regard to jurisdictional claims in published maps and institutional affiliations.
Author details 1
The Rydberg Laboratory for Applied Sciences, School of Business, Engineering and Science, Halmstad University, Box 823, 301 18 Halmstad, Sweden.2Scandinavian College of Sport, Box 11365, 494 28 Gothenburg, Sweden.3Swedish Golf Federation, Stockholm, Sweden.
Received: 26 May 2017 Accepted: 30 November 2017
References
1. Hellström J. Competitive elite golf: a review of the relationships between playing results, technique and physique. Sports Med. 2009;39(9):723–41. 2. Hellström J, Nilsson J, Isberg L. Drive for dough. PGA tour golfers’tee shot
functional accuracy, distance and hole score. J Sport Sci. 2013;35(2):462–9. 3. Joyce C, Burnett A, Cochrane J, Ball K. Three-dimensional trunk kinematics in
golf: between-club differences and relationships to clubhead speed. J Sports Biomech. 2013;12(2):108–20.
4. Miura K, Sato F. The initial trajectory plane after golf ball impact. In science and golf III: proceedings of the 1998 world scientific congress of golf. USA: Human Kinetics; 1998.
5. Neal R, Lumsden R, Holland M, Mason B. Body segment sequencing and timing in golf. Int J Sports Sci Coach. 2007;2:25–36.
6. Healy A, Mora K, Dickson J, Hurley C, Smeaton A, O’Connor, Kelly P, Haahr M, Chockalingham N. Analysis of the 5 iron golf swing when hitting for maximum distance. J Sport Sci. 2011;29(10):1079–88.
7. Loock HV, Grace J, Semple S. The influence of Corepower training on golfers’physical and functional fitness as well as golf performance: a pilot study. J Sport Sci. 2012;18(2):404–12.
8. Torres-Ronda L, Sánchez-Medina L, González-Badillo JJ. Muscle strength and golf performance: a critical review. J Sports Sci Med. 2011;10:9–18. 9. Gordon B, Moir G, Davis S, Witmer C, Cummings DM. An investigation into
the relationship of flexibility, power, and strength to club head speed in male golfers. J Strength Cond Res. 2009;23(5):1606–10.
10. Read PJ, Miller SC, Turner AN. The effects of postactivation potentiation on golf club head speed. J Strength Cond Res. 2013;27(6):1579–82. 11. Yoon S. The relationship between muscle power and swing speed in
low-handicapped golfers. Provo: Masters’thesis. Brigham Young University; 1998.
12. Read PJ, Lloyd RS, De Ste CM, Oliver JL. Relationships between field-based measures of strength and power and golf club head speed. J Strength Cond Res. 2013;27(10):2708–13.
13. Keogh J, Marnewick M, Maulder P, Nortje J, Hume A, Bradshaw E. Are anthropometric, flexibility, muscular strength, and endurance variables related to clubhead velocity in low-and high-handicap golfers? J Strength Cond Res. 2009;23(6):1841.
14. Torres-Ronda L, Delextrat A, Gonzalez-Badillo JJ. The relationship between golf performance, anthropometrics, muscular strength and power characteristics in young elite players. Int Sports Med J. 2014;15(2):155–64. 15. Wells GD, Elmi M, Thomas S. Physiological Correlates of Golf Performance J
Strength Cond Res. 2009;23(3):741–50.
16. Fletcher IM, Hartwell M. Effect of an 8-week combined weights and plyometrics training program on golf drive performance. J Strength Cond Res. 2004;18(1):59–62.
17. Lephart SM, Smoliga JM, Myers JB, Sell TC, Tsai YS. An eight-week golf-specific exercise program improves physical characteristics, swing mechanics, and golf performance in recreational golfers. J Strength Cond Res. 2007;21(3):860–9.
18. Hetu FE, Christie CA, Faigenbaum AD. Effects of conditioning on physical fitness and club head speed in mature golfers. Percept Motor Skills. 1998; 86(3):811–5.
19. Thompson CJ, Cobb KM, Blackwell J. Functional training improves club head speed and functional fitness in older golfers. J Strength Cond Res. 2007;21(1):131.
20. Pinter M. Effects of strength training and flexibility on club head speed and accuracy in the golf drive. [dissertation]. Starkville (MI): Mississippi State University; 1992.
21. Doan BK, Newton RU, Kwon YH, Kraemer WJ. Effects of physical conditioning on intercollegiate golfer performance. J Strength Cond Res. 2006;20(1):62–72.
22. An JJ, Wulf G, Kim S. Increased carry distance and X-factor stretch in golf through an external focus of attention. J Mot Learn Dev. 2013;1:2–11. 23. Bulbulian R, Ball KA, Seaman DR. The short golf backswing: effects on
performance and spinal health implications. J Manipulative Physiol Thera. 2001;24(9):569–75.
25. Egret C, Nicolle B, Dujaridin F, Weber J, Chollet D. Kinematic analysis of the golf swing in men and women experienced golfers. Int J Sports Med. 2006; 27:463–7.
26. Zheng N, Bsrrentine S, Fleisig G, Andrews J. Kinematic analysis of swing in pro and amateur golfers. Int J Sports Med. 2008;29:487–93.
27. Pereira MI, Gomes PS. Movement velocity in resistance training. Sports Med. 2003;33(6):427–38.
28. Helland C, Hole E, Iversen E, Olsson MC, Seynnes O, Solberg PA, Paulsen G. Training stratagies to improve muscle power: is olympic-style weightlifting relevant? Med Sci Sport Exerc. 2017;49(49):736–45.
29. Ratamess N, Beller N, Gonzalez A, Spatz G, Jay R, Hoffman J, Ryan E, Ross R, Avery D, Faigenbaum A, Jie Kang J. The effects of multiple-joint Isokinetic resistance training on maximal Isokinetic and dynamic muscle strength and local muscular endurance. J Sports Sci Med. 2016;15:34–40.
30. Andre MJ, Fry AC, Heyrman MA, Hudy A, Holt B, Roberts C, Vardiman JP, Gallagher PM. A reliable method for assessing rotational power. J Strength Cond Res. 2012;26(3):720–4.
31. Cheetham P, Rose G, Hinrichs R, Neal R, Mottram R, Hurrion P, Vint P. Comparison of kinematic sequence parameters between amateur and professional golfers. In: Crews D, Lutz R, editors. Science and golf V: proceedings of the world scientific congress of golf. Arizona: LPGA Foundation. p. 30–6.
32. Hellström J, Tinmark F. The association between stability and swing kinematics of skilled High School golfers. in Science and Golf V: Proceedings of the World Scientific Congress of Golf. 2008. LPGA foundation.
33. Grood ES, Suntay WJ. A joint coordinate system for the clinical description of three-dimensional motions: application to the knee. J Biomech Eng. 1983;105(2):136–44.
34. Wu G, Van der Helm F, Veeger H, Makhsous M, Van Roy P, Anglin C, Wang X. ISB recommendation on definitions of joint coordinate systems of various joints for the reporting of human joint motion—part II: shoulder, elbow, wrist, and hand. J Biomech. 2005;38(5):981–92.
35. Farber A, Smith J, Kvitne R, Mohr K, Shin S. Electromyographic analysis of forearm muscles in professional and amateur golfers. Am J Sports Med. 2009;37(2):396.
36. Hopkins WG A spreadsheet for analysis of straightforward controlled trials [Online]. Sport Science. 2003. https://www.sportsci.org/jour/03/wghtrials. htm. Accessed 20 July 2016.
37. Batterham A, Hopkins W. Making meaningful inferences about magnitudes. Int J Sports Physiol Perf. 2006;1(1):50–7.
38. Hopkins W, Marshall S, Batterham A, Hanin J. Progressive statistics for studies in sports medicine and exercise science. Med Sci Sports Exerc. 2009;41(1):3–12. 39. Durlak JA. How to select, calculate, and interpret effect sizes. J Pediatric
Psychol. 2009;34(9):917–28.
40. Cohen J. Statistical power analysis for the behavioral sciences (2nd ed.), Hilllsdale, NJ: Erlbaum; 1988.
41. Komi PV, Viitasalo JT, Rauramaa R, Vihko V. Effect of isometric strength training on mechanical, electrical, and metabolic aspects of muscle function. Eur J Appl Physiol Occup Physiol. 1978;40(1):45–55. 42. Cormie P, McGuigan M, Newton R. Developing maximal neuromuscular
power: part 2 training considerations for improving maximal power production. Sports Med. 2011;41(2):125–46.
43. Álvarez M, Sedano S, Cuadrado G, Redondo JC. Effects of an 18-week strength training program on low-handicap Golfers’performance. J Strength Cond Res. 2012;26(4):1110–21.
44. Gentil P, Steele J, Pereira M, Castanheira R, Paoli A, Bottaro M. Comparison of upper body strength gains between men and women after 10 weeks of resistance training. PeerJ. 2016;4:e1627.
45. Staron R, Karapondo D, Kraemer W, Fry A, Gordon S, Falkel J, Hagerman F, Hikida R. Skeletal muscle adaptations during early phase of heavy-resistance training in men and women. J Appl Phys. 1994;76:1247–55.
46. Newton R, Rogers R, Volek J, Häkkinen K, Kraemer W. Four weeks of optimal load ballistic resistance training at the end of season attenuates declining jump performance of women volleyball players. J Strength Cond Res. 2006; 20:955–61.
• We accept pre-submission inquiries
• Our selector tool helps you to find the most relevant journal
• We provide round the clock customer support
• Convenient online submission
• Thorough peer review
• Inclusion in PubMed and all major indexing services
• Maximum visibility for your research
Submit your manuscript at www.biomedcentral.com/submit