R E S E A R C H A R T I C L E
Open Access
Independent external validation of cardiovascular
disease mortality in women utilising Framingham
and SCORE risk models: a mortality follow-up
study
Louise Gek Huang Goh
1, Timothy Alexander Welborn
2and Satvinder Singh Dhaliwal
1*Abstract
Background:We conducted an independent external validation of three cardiovascular risk score models
(Framingham risk score model and SCORE risk charts developed for low-risk regions and high-risk regions in Europe) on a prospective cohort of 4487 Australian women with no previous history of heart disease, diabetes or stroke. External validation is an important step to evaluate the performance of risk score models using discrimination and calibration measures to ensure their applicability beyond the settings in which they were developed.
Methods:Ten year mortality follow-up of 4487 Australian adult women from the National Heart Foundation third Risk Factor Prevalence Study with no baseline history of heart disease, diabetes or stroke. The 10-year risk of cardiovascular mortality was calculated using the Framingham and SCORE models and the predictive accuracy of the three risk score models were assessed using both discrimination and calibration.
Results:The discriminative ability of the Framingham and SCORE models were good (area under the curve > 0.85). Although all models overestimated the number of cardiovascular deaths by greater than 15%, the
Hosmer-Lemeshow test indicated that the Framingham and SCORE-Low models were calibrated and hence suitable for predicting the 10-year cardiovascular mortality risk in this Australian population. An assessment of the treatment thresholds for each of the three models in identifying participants recommended for treatment were found to be inadequate, with low sensitivity and high specificity resulting from the high recommended thresholds. Lower treatment thresholds of 8.7% for the Framingham model, 0.8% for the SCORE-Low model and 1.3% for the SCORE-High model were identified for each model using the Youden index, at greater than 78% sensitivity and 80% specificity. Conclusions:Framingham risk score model and SCORE risk chart for low-risk regions are recommended for use in the Australian women population for predicting the 10-year cardiovascular mortality risk. These models demonstrate good discrimination and calibration performance. Lower treatment thresholds are proposed for better identification of individuals for treatment.
Keywords:Cardiovascular disease, Risk estimation, Discrimination, Calibration, Model performance, Primary prevention
* Correspondence:[email protected] 1
School of Public Health, Curtin Health Innovation Research Institute (CHIRI), Curtin University, Perth, Australia
Full list of author information is available at the end of the article
Background
Cardiovascular disease (CVD) is one of the leading causes of death worldwide and in Australia [1,2]. There were 45622 CVD deaths recorded in 2011, more deaths oc-curred in Australian females (23755) than Australian males (21867) [2]. Effective primary prevention strategies targeted at the individuals“at risk” are needed to reduce the num-ber of CVD deaths [3]. The recent American College of Cardiology and American Heart Association guidelines [4] stress that both primary and secondary prevention should be directed at those most likely to benefit.
Multivariable CVD risk score models enable the quanti-fication of CVD risk. These models determine the prob-ability of an individual experiencing a CVD event within a predefined time period by assessing the entire risk-factor profile [5]. It identifies“at risk”individuals for intervention and is a cost-effective approach to CVD prevention [6]. The 2010 American College of Cardiology Foundation and American Heart Association Guidelines [7] recom-mends all asymptomatic women to undergo a global CVD risk assessment. CVD risk factors for women include age, race/ethnicity, obesity, poor diet, excessive alcohol con-sumption, physical inactivity, smoking, high blood pres-sure, high cholesterol, diabetes, chronic kidney disease, genetics, coronary artery calcium and psychological fac-tors, and also the interactions between some of these risk factors [8,9]. It should be noted that not all of these risk variables have been incorporated into risk score models. Recommended treatment thresholds are used to identify individuals at increased CVD risk for treatment.
Commonly used risk score models and treatment thresholds include, the Framingham risk score model for 10-year CVD incidence or death [10] (20% treatment threshold) [11,12], SCORE risk chart for 10-year CVD death (3%, 5%, 7% and 10% treatment thresholds) [13], Reynolds risk score model for 10-year CVD incidence and death [14], ASSIGN risk score model for 10-year CVD in-cidence and death (20% treatment threshold) [12], general CVD risk score model for 10-year CVD incidence and death [15] (10% and 20% thresholds) [16,17], simplified general CVD risk score model for 10-year CVD incidence and death [15] (10% and 20% thresholds) [16,17] and QRISK score model for 10-year CVD incidence and death [18]. These risk score models were developed in the USA (Framingham, Reynolds and general CVD) and Europe (SCORE, ASSIGN and QRISK). Age, sex, systolic blood pressure (SBP), total cholesterol (TC) level, high-density lipoprotein cholesterol (HDL-C) level and smoking status were included in all six models. Diabetes status was in-cluded in all the models except the SCORE model. The Reynolds risk score model was the only model initially de-veloped from a female population and it contains bio-markers in its calculation of the 10-year CVD risk [14]. The QRISK score model includes more risk variables i.e.
body mass index (BMI) (which is also found in a simpler version of the general CVD risk score model), family his-tory (also found in the Reynolds and ASSIGN model), Townsend deprivation score (a measure of social deprivation is also found in the ASSIGN model), use of antihypertensive medication (also found in the general CVD model), self-assigned ethnicity, rheumatoid arthritis, chronic renal disease and atrial fibrillation, compared with other models [18].
The Framingham and SCORE models were selected and validated in this study as they have similar end-points. Both models predict 10-year CVD death risk. In addition, the risk variables used to calculate the 10-year CVD risk for the Framingham and SCORE models were collected in the National Heart Foundation (NHF) Risk Factor Prevalence Study. Some risk score models did not have recommended treatment thresholds for identifying women at increased risk of CVD and their performance could not be assessed.
Performance of risk score models is typically overesti-mated in the original data which they were developed [19]. External validation is an important step to evaluate the performance of risk score models using discrimin-ation and calibrdiscrimin-ation measures to ensure their
applic-ability beyond the settings in which they were
developed. The Framingham, SCORE and general CVD risk score models have been utilised to predict risk in an Australian population [20,21]. Risk score models have also been developed for use in Australia i.e. from the Busselton Health Study and Dubbo Study. These models, however, are limited in applicability. The former model predicts the risk of coronary heart disease (CHD) hos-pitalisation or death while the latter predicts the CVD risk of older Australians aged 60 years and older [22,23]. The National Vascular Disease Prevention Alliance recommends the use of the Framingham risk score model for estimating the 5-year CVD risk of disease-free Australians and an individual with a risk score of more than 15% is identified as high risk of developing CVD and is targeted for treatment [24].
The objective of this study was to conduct an inde-pendent external validation of the Framingham risk score model, SCORE model for low-risk regions (which was developed from European countries with low CVD rates: Belgium, Italy and Spain) and SCORE model for high-risk regions (European countries with high CVD rates: Denmark, Finland and Norway), using a mortality follow-up cohort of 4487 Australian women from the NHF Risk Factor Prevalence Study.
Methods
Study participants
electoral rolls of December 1988 in North and South Syd-ney, Melbourne, Brisbane, Adelaide, Perth, Hobart, Dar-win and Canberra were recruited for the Risk Factor Prevalence Study by systemic probability sampling of sex and 5-year age groups. A representative sample of 4487 women aged 20–69 years with no previous history of heart disease, diabetes or stroke at baseline were included for analysis. Participants taking medications to reduce their CVD risk factors were excluded.
Ethics statement
Ethical approval for the NHF data was obtained in ad-vance from the Australian Institute of Health Interim Ethics Committee, after consultation with the Com-monwealth Privacy Commissioner. Participation was entirely voluntary. Those who participated signed an in-formed consent form [25]. Participant information was anonymised prior to analysis. This study was approved by the Human Research Ethics Committee at Curtin University. The linkage and analysis of the NHF data with the National Death Index were approved by the current Ethics Committee of the Australian Institute of Health and Welfare (AIHW), and complies with the Declaration of Helsinki.
Risk factor measurements
A self-administered questionnaire was completed and information on demographic and clinical characteristics and smoking status were collected. Physical measure-ments were also taken: weight (to the nearest tenth of a kilogram), height (to the nearest centimetre), waist cir-cumference and hip circir-cumference were measured twice to the nearest centimetre according to standardised methodologies [26,27], and systolic and diastolic blood pressure were recorded on the right arm of seated par-ticipants five minutes apart using mercury sphygmoma-nometers. The average of the two readings of blood pressure was used in the analysis [25]. Fasting blood samples were also collected in EDTA tubes and des-patched to the central laboratory at the Division of Clin-ical Chemistry, Institute of MedClin-ical and Veterinary Science, Adelaide each week for cholesterol levels to be assayed. Participants were classified as non-smokers, previous smokers or current smokers [25].
Cardiovascular disease outcomes
Mortality was ascertained to 31 December 1999 using the National Death Index maintained by the AIHW. The demographic data of the participants who were free from CVD and diabetes at baseline were submitted to AIHW. These data were then matched with the National Death Index using a probabilistic record linking package (“Automatch”). This provided data on the 10 year mor-tality follow-up. Causes of death were coded according
to the International Classification of Diseases (ICD) 9th or 10th revision. ICD-9 codes 3900–4589 or ICD-10 codes I00.0-I99.9 were used for CVD deaths [28,29]. The calculation of 10-year CVD risk from baseline data en-abled assessment and comparison of the three risk score models and CVD death events were used because these events were determined, unlike non-fatal CVD events which are usually self-reported [9].
Risk score models
The Framingham risk score model predicts the 10-year risk of CVD death [10]. It was developed using partici-pants aged 30–74 years who were free of CVD and can-cer from the American Framingham Heart Study. Age, sex, SBP, diastolic blood pressure, TC level, HDL-C level, smoking status and diabetes status were used in the calculation of the 10-year CVD risk [10]. Although electrocardiogram-left ventricular hypertrophy (ECG-LVH) is included in the Framingham model for the calcu-lation of the 10-year CVD risk, participants were assumed not to have LVH as ECG was not undertaken in the NHF third Risk Factor Prevalence Study. The most commonly used treatment threshold for the Framingham risk score model was 20% [9]. This denotes that an individual who has a risk score of more than 20% is considered to be“at risk”of experiencing a CVD event within the next 10 years and should be targeted for treatment. Treatment includes lifestyle intervention (quit smoking, diet and exercise) as well as drug therapy (for lipids, hypertension and dia-betes). Later versions of the Framingham risk score models include the National Cholesterol Education Pro-gram’s Third Adult Treatment Panel (ATP-III) risk assess-ment tool for the prediction of 10-year CHD risk, general CVD risk score model to predict the 10-year risk of CVD incidence and death and the Framingham risk pre-diction algorithm to quantify the 30-year risk of CVD [15,30-33]. A new sex- and race-specific risk equation for predicting the 10-year atherosclerotic CVD risk, for fatal and non-fatal CVD events, for African-American and White men and women aged 40–79 years has also been published in the 2013 American College of Cardiology Foundation and American Heart Association Guidelines on the Assessment of Cardiovascular Risk [4].
high-risk regions compared to the Framingham model. A lar-ger cohort was used to develop the SCORE risk chart than the Framingham model. Age, sex, mean SBP, mean TC level, mean HDL-C level and smoking status were included in the calculation of the 10-year risk of CVD death for the SCORE models. Commonly used treatment thresholds for the SCORE risk chart included 3% and 5% for low-risk regions, and 3%, 5%, 7% and 10% for high-risk regions [13].
Statistical analysis
The data on the representative sample of 4487 Australian females were described using mean ± standard deviation or median (inter-quartile range) for continuous variables, while counts and percentages were used for categorical variables. Ten-year predicted CVD mortality risk was cal-culated for each participant using the Framingham and the two SCORE risk models and these were compared against observed actual CVD mortality. The predictive ac-curacy of the CVD risk score models were assessed using both discrimination and calibration.
Calibration was assessed by ranking the cohort into quintiles of risk and comparing the number of predicted and observed deaths within each quintile. The Hosmer-Lemeshow chi-squared goodness-of-fit test was used to measure the agreement between predicted and observed events across the quintiles of predicted risk for each of the models [35]. A chi-squared p-value that is greater than 0.05 indicates a well-calibrated model. Graphically, calibration is represented as a plot of observed and pre-dicted risk by quintiles of risk, arranged from low risk to high risk as determined by the CVD risk score models.
Discrimination was assessed by plotting the receiver operating characteristic (ROC) curve and calculating the area under the ROC curve (AUC) or c statistic. The ROC curve is a plot of true positives (sensitivity) against false positives (1-specificity) that provides a summary of sensitivity and specificity across a range of cut points for a continuous predictor [36]. The c statistic refers to the probability that the predicted risk is higher for a case than for a non-case and a c statistic of 1 indicates per-fect discrimination and the predicted risks are higher for all cases than non-cases even if the predicted risk score differs from the observed risk [36-38]. Sensitivity, specificity, likelihood ratio and Youden index [39] were calculated at the respective recommended treatment thresholds of the risk score models, and at the proposed cut-off. P-values of less than 0.05 were considered to be statistically significant. All statistical analyses were per-formed with IBM SPSS Statistics Version 21.
Results
The demographic and clinical characteristics of the cohort of 4487 women without baseline heart disease, diabetes or
stroke are presented in Table 1. The predicted 10-year CVD death risk calculated using the Framingham risk score model, and SCORE risk chart for low-risk and high-risk regions are also presented. There were 152 deaths from all causes and 28 deaths due to CVD observed dur-ing the 10 years of follow-up. These 152 deaths repre-sented approximately 3.4% of the sample and 0.3% of the total deaths in the Australian female population in 1989 [40], at the start of the study, and 0.2% in 1999 [41], at the end of the 10-year follow-up.
In Figure 1, the observed 10-year CVD death risk is compared with the Framingham, SCORE-Low and SCORE-High predicted risks across the range of ages in the cohort. The risk score models generally underesti-mated the 10-year CVD death risk in those below 50 years of age and overestimated the risk in those aged 50 years and above. The Framingham risk score model and SCORE risk chart for low-risk regions predicted similar risk levels in the age categories while the SCORE-High model predicted higher risk levels compared to the other two models.
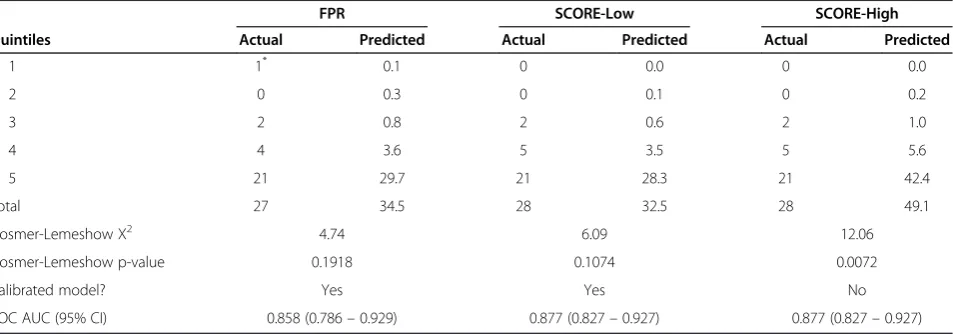
The Framingham, SCORE-Low and SCORE-High risk score models accurately predicted the 10-year risk of CVD death in the first four quintiles of risk (Figure 2). For the highest quintile of risk, however, all three models overestimated the 10-year risk. The overestimation was higher in the SCORE-High model than the Framingham and SCORE-Low models.
Table 2 presents the discrimination and calibration model performance statistics for the Framingham, SCORE-Low and SCORE-High models. The ratio of the 10-year CVD predicted risk to the observed risk in the highest quintile was 1.41 for the Framingham model, 1.35 for the SCORE-Low model and 2.02 for the SCORE-High model. The observed number of deaths is 28 (Table 2). The Framingham risk score model pre-dicted the total number of deaths to be 34.5, an overesti-mation of approximately 23%. The SCORE-Low model predicted the total number of deaths to be 32.5, an over-estimation of about 16% while the SCORE-High model overestimated the number of CVD deaths by approxi-mately 75%. Calibration, as assessed using the Hosmer-Lemeshow test, indicated that the overestimation was not significant for the Framingham and SCORE-Low models and that the models were calibrated. All models reported high ROC AUC (≥0.858).
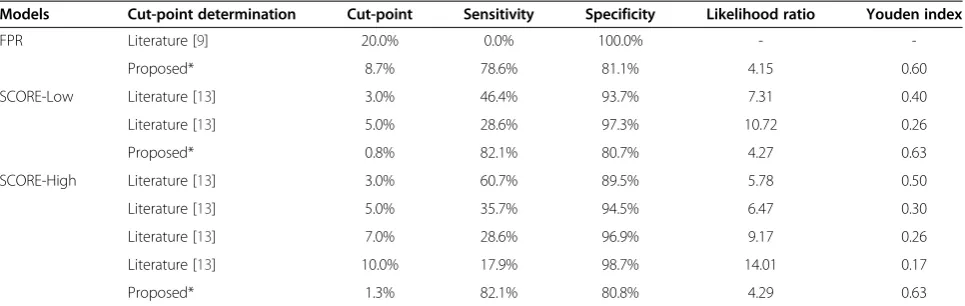
Framingham model, 0.8% for the SCORE-Low model and 1.3% for the SCORE-High model, to identify those at an increased 10-year CVD death risk, at greater than 78% sensitivity and 80% specificity.
Discussion
In this cohort of 4487 Australian females, the Framing-ham, SCORE-Low and SCORE-High models performed well in discriminating those who died from CVD from those who did not. However, only the Framingham and SCORE-Low models indicated that they were well-calibrated (p> 0.05) in this population, although risk was generally overestimated. The calibration statistics reported
in previous study also indicated that the Framingham model was well-calibrated, consistent with our study, but not the SCORE risk chart [20].
Overestimation was observed in the highest risk quin-tile in our study, where the ratio of the 10-year CVD predicted risk to the observed risk was 1.41 for the Fra-mingham risk score model, 1.35 for the SCORE-Low model and 2.02 for the SCORE-High model. It had also been suggested previously that the accuracy of risk pre-diction at the extremes of risk needs to be improved [42]. A systematic review study on the external valid-ation of the Framingham risk score model for predicting the 10-year CHD or CVD risk reported that the ratio of Table 1 Characteristics of the cohort of 4487 women without heart disease, diabetes or stroke at baseline
Variables Total cohort Survivors Deaths (all-cause) CVD deaths
n = 4487 n = 4335 n = 152 n = 28
Age (years) 42.8 ± 13.2 42.3 ± 13.0 56.0 ± 11.9 60.8 ± 8.1
BMI (kg/m2) 24.8 ± 4.7 24.8 ± 4.7 26.2 ± 5.0 26.5 ± 3.8
WC (cm) 76.2 ± 11.1 76.0 ± 11.0 81.2 ± 10.7 82.5 ± 10.3
WHR 0.76 ± 0.06 0.76 ± 0.06 0.79 ± 0.07 0.80 ± 0.06
SBP (mmHg) 122.1 ± 18.4 121.6 ± 18.0 134.2 ± 23.4 143.7 ± 29.4
TC (mmol/L) 5.5 ± 1.2 5.4 ± 1.1 6.0 ± 1.2 6.5 ± 1.2
HDL-C (mmol/L) 1.5 ± 0.4 1.5 ± 0.4 1.5 ± 0.4 1.5 ± 0.4
Ratio of TC to HDL-C 3.9 ± 1.3 3.9 ± 1.3 4.3 ± 1.5 4.9 ± 2.2
Non-smoker 2652 (59.1%) 2570 (59.3%) 82 (54.0%) 13 (46.4%)
Previous smoker 880 (19.6%) 854 (19.7%) 26 (17.1%) 4 (14.3%)
Current smoker 955 (21.3%) 911 (21.0%) 44 (28.9%) 11 (39.3%)
FPR (%) 0.8 ± 1.8 0.7 ± 1.7 2.9 ± 3.7 5.2 ± 5.8
SCORE-Low (%) 0.7 ± 1.9 0.7 ± 1.6 3.1 ± 5.2 6.1 ± 9.9
SCORE-High (%) 1.1 ± 2.8 1.0 ± 2.4 4.5 ± 7.3 8.9 ± 13.8
FPR (%) 0.1 (0 , 0.6) 0.1 (0 , 0.5) 1.5 (0.2 , 4.1) 3.1 (1.0 , 6.6)
SCORE-Low (%) 0.1 (0 , 0.6) 0.1 (0 , 0.5) 1.8 (0.2 , 3.7) 2.9 (1.0 , 5.7)
SCORE-High (%) 0.1 (0 , 0.9) 0.1 (0 , 0.8) 2.8 (0.4 , 5.6) 4.3 (1.5 , 8.6)
Abbreviations: BMI, body mass index; WC, waist circumference; WHR, waist to hip ratio; SBP, systolic blood pressure; TC, total cholesterol; HDL-C, high-density lipoprotein cholesterol; FPR, Framingham 10-year predicted risk for CVD death; SCORE-Low, SCORE-Low 10-year predicted risk for CVD death; SCORE-High, SCORE-High 10-year predicted risk for CVD death.
Framingham predicted risk
SCORE-Low predicted risk
SCORE-High predicted risk
Observed risk
10-year CHD predicted to observed risk ranged from an under-prediction of 0.43 in a high-risk population to an over-prediction of 2.87 in a lower-risk population [43]. There was a similar trend for the prediction of 10-year CVD risk [43]. An under-prediction of risk was reported in Malaysian women using the SCORE risk chart [44].
In our study, the Framingham risk score model overes-timated the total CVD deaths by 23%, the SCORE-Low model overestimated by about 16% and the SCORE-High model overestimated the number of CVD deaths by approximately 75%. In a study of Australian men free of heart disease, stroke and diabetes, the Framingham risk score model significantly over-predicted the risk of CHD and CVD death in all quintiles [45]. A study on two German prospective cohorts found that the Framingham predicted risk substantially exceeded the observed risk in the cohorts, with an overestimation of at least 50% [46]. An overestimation of risk was also
observed in another study, the expected CHD deaths was 162, however, only 148 CHD deaths were observed [47]. A study which compared the performance of the Framingham model and the SCORE model in predicting the 10-year CHD and CVD mortality risk in a non-diabetic population aged 40–65 years from a Spanish healthcare centre found that the SCORE model over-predicted the risk by 40% while the Framingham model over-predicted the risk by 64% (33% in men and 150% in women) [48]. Using the SCORE risk chart for low-risk regions to predict the 10-year risk of CVD death, a study observed that the model over-estimated the CVD mortality risk in women [49]. Overestimation was also reported for the SCORE risk chart for high-risk regions and the over-estimation increased with age in women from Norway, consistent with our study findings [50]. Similarly, the Framingham risk score model over-predicted the 5-year CVD risk (p< 0.05) in the Australian Diabetes, Obesity and
Predicted risk
Observed risk
Figure 2Comparison of predicted and observed 10-year CVD death risk by quintiles of risk (Predicted risk–red line and observed risk–black dotted line).
Table 2 Discrimination and calibration performance statistics for risk score models in estimating the 10-year risk of CVD death
FPR SCORE-Low SCORE-High
Quintiles Actual Predicted Actual Predicted Actual Predicted
1 1* 0.1 0 0.0 0 0.0
2 0 0.3 0 0.1 0 0.2
3 2 0.8 2 0.6 2 1.0
4 4 3.6 5 3.5 5 5.6
5 21 29.7 21 28.3 21 42.4
Total 27 34.5 28 32.5 28 49.1
Hosmer-Lemeshow X2 4.74 6.09 12.06
Hosmer-Lemeshow p-value 0.1918 0.1074 0.0072
Calibrated model? Yes Yes No
ROC AUC (95% CI) 0.858 (0.786–0.929) 0.877 (0.827–0.927) 0.877 (0.827–0.927)
*An outlier was excluded from quintile 1 (1 death) in the calculation of the Hosmer-Lemeshow test, owing to its undue influence on the test. Including this outlier would result in the Hosmer-Lemeshow X2
= 14.35, p-value = 0.0025, and the risk score model being assessed as not calibrated. This outlier did not represent a woman with elevated risk factors associated with increased CVD risk, on further examination.
Lifestyle study, evaluated against the general CVD risk score model [21]. The risk was also overestimated using the general CVD risk score model. Another study assessed the performance of the Framingham risk score model and a general practice model in a cohort of 3582 women aged 60–79 years who were initially free of CHD in the British Women’s Heart and Health Study and observed that the Framingham model accurately predicted the 5-year CHD risk but over-predicted the CVD risk [51]. Similar to our study, the model overestimated CVD risk in higher-risk groups. The Framingham higher-risk score model also over-predicted the 10-year CVD risk in another study by 35% [52]. It over-estimated the risk less than the ASSIGN model but more than the QRISK model. Its performance was also compared with the QRISK score model in two United Kingdom (UK) cohorts and the Framingham model over-predicted the risk as well [53].
Similar to our study findings, a systematic review study which assessed the performance of the Framing-ham risk score model using 25 validation cohorts of dif-ferent population groups in the analysis reported that it accurately predicted CHD risk in populations from the United States, Australia and New Zealand [54]. In the Dubbo study, the Framingham risk score model for CHD risk also accurately predicted the 10-year CHD in-cidence in men and women aged 60–79 years who were free of CVD or diabetes at baseline [22]. Another study comparing the performance of ASSIGN, Framingham and general CVD risk score models in predicting the 10-year CVD risk in a UK cohort of patients from general practice reported that the Framingham model predicted the risk accurately but some over-prediction was observed in women of higher risk [55]. The Fra-mingham CVD model was also compared with the ATP-III score and Reynolds risk score using a case-cohort sample of the multi-ethnic Women’s Health Initiative
Observational Cohort. Contrary to our study findings, the calibration performance of the Framingham CVD and ATP-III models were poor, however, the Reynolds model was calibrated [56].
It is important to extensively evaluate the applicability of risk models to each population, in order to avoid under-prediction or over-prediction [57]. Possible causes of differences in estimation include differences in the populations used to develop the risk score models and different risk variables used to estimate risk. Generally, age, sex, SBP, TC level, HDL-C level and smoking status are included into risk score models. The incorporation of additional risk variables such as race/ethnicity, obes-ity, poor diet, excessive alcohol consumption, physical inactivity, chronic kidney disease, family history of CVD, coronary artery calcium and psychological factors, and also interactions between some of these risk factors could improve risk estimation in women. Recalibration has also been shown to improve the performance of risk score models after accounting for differences in the preva-lence of risk factors and underlying CVD rates [58,59]. Another option would be to quantify the amount of over-estimation and adjust accordingly [46].
Existing studies generally reported good discrimination, consistent with our study findings. Our study reported AUC≥0.858. High AUC (0.866) has also been reported for the Framingham risk score model in predicting CVD death in Australian men and women [60]. AUC of 0.880 and 0.770 were also reported in women using the Framingham risk score model for predicting myocardial infarction and CHD death, in two German prospective studies [46]. A study also found that the SCORE risk chart for low-risk regions for predicting the 10-year risk of CVD death discriminated Austrian women well (AUC = 0.780) [49]. The discrimination performance of the SCORE risk chart for high-risk regions to predict the 10-year CVD Table 3 Diagnostic measures for the prediction of 10-year CVD death using Framingham, SCORE-Low and SCORE-High models
Models Cut-point determination Cut-point Sensitivity Specificity Likelihood ratio Youden index
FPR Literature [9] 20.0% 0.0% 100.0% -
-Proposed* 8.7% 78.6% 81.1% 4.15 0.60
SCORE-Low Literature [13] 3.0% 46.4% 93.7% 7.31 0.40
Literature [13] 5.0% 28.6% 97.3% 10.72 0.26
Proposed* 0.8% 82.1% 80.7% 4.27 0.63
SCORE-High Literature [13] 3.0% 60.7% 89.5% 5.78 0.50
Literature [13] 5.0% 35.7% 94.5% 6.47 0.30
Literature [13] 7.0% 28.6% 96.9% 9.17 0.26
Literature [13] 10.0% 17.9% 98.7% 14.01 0.17
Proposed* 1.3% 82.1% 80.8% 4.29 0.63
mortality was also evaluated in Norway and the AUC values ranged from 0.660 to 0.720 in women [50]. Another study which assessed the validity and utility of cardiovas-cular risk score models in a Malaysian population found that the Framingham risk score model and SCORE risk chart for low-risk and high-risk regions demonstrated good discrimination for predicting the 5-year cardiovascu-lar mortality risk (AUC ranged from 0.758 to 0.763) in women [44].
The discriminative ability of the Framingham risk score model and SCORE risk chart have also been com-pared to other models. The Framingham risk score model was evaluated against the general CVD risk score model in the Australian Diabetes, Obesity and Lifestyle study and reported an AUC of 0.740, which is lower than the general CVD risk score model (AUC=0.760) [21]. Another study compared the performance of the Framingham, QRISK and ASSIGN models and reported that the Framingham model had lower ROC statistic (0.774) in women than QRISK and ASSIGN models [52]. Similar results were observed in two UK cohorts with the Framingham risk score model reporting lower ROC statistics (approximately 0.776 and 0.760) than the QRISK score model [53]. The performance of the Fra-mingham CVD model was also compared with the ATP-III score and Reynolds risk score in a multi-ethnic Women’s Health Initiative Observational Cohort. The c statistics of the Framingham model and ATP-III score were 0.750 and 0.757, respectively, and were both lower than the Reynolds model [56].
The threshold discrimination is also an important as-pect to consider, particularly in clinical practice [61]. The sensitivity and specificity of CVD risk score models at different cut points or treatment thresholds should be reported [62]. In our study, participants at increased risk of CVD were not adequately identified for treatment at the respective recommended treatment thresholds of the three risk score models. Low sensitivity and high specifi-city were reported as the recommended treatment thresholds were high. The higher treatment thresholds currently used for risk score models, under-treat individ-uals in higher risk groups. Our study identified lower treatment thresholds for the Framingham risk score model (8.7%) and SCORE risk chart for low- (0.8%) and high-risk (1.3%) regions, to improve the identification of individuals who require treatment with high sensitivity and specificity. Previous studies have also reported that it is difficult for individuals to exceed the recommended treatment thresholds even with markedly elevated risk factors. The Framingham risk score model was com-pared against the ASSIGN risk score using the Scottish Heart Health Extended Cohort. At the 20% cut point, the sensitivity of the Framingham risk score model was low (45.6%), while the specificity was 82.5% [12]. In
another study, the Framingham model for predicting the 10-year CHD risk classified only 33% of all CHD events occurred in women as high risk, using a threshold of 20% [63]. The Framingham risk score model and SCORE model to predict CVD mortality was also evaluated in the Netherlands and the Framingham model only identi-fied 0.7% of the population for treatment while the SCORE model assigned 0.4% for treatment, at a thresh-old of 10% [64]. Among those identified for treatment using the Framingham and SCORE models, their ob-served risk was 6.2% and 10.2%, respectively, indicating that the recommended threshold was inadequate for identifying individuals for treatment. The 10-year pre-dicted risk was < 10% or low across age groups and risk factor levels using the ATP-III risk assessment tool [32]. Similarly, all men < 30 years with substantial risk factor burden using the Framingham risk score model also re-ported low risk using existing threshold [65]. In addition, the 10-year predicted risk was also found to be < 10% in most men < 50 years and most women < 70 years [66]. An approach to lower treatment thresholds would seem appropriate. A new threshold of≥10% has been recom-mended for identifying women at high CVD risk for treatment as it is difficult for a woman below 75 years of age with several markedly elevated risk factors to exceed a 10% (let alone a 20%) with the ATP-III risk assessment tool [16]. The most recent guidelines released by the American College of Cardiology and American Heart Association Task Force on Practice Guidelines have rec-ommended an even lower threshold of 7.5% for the 10-year risk of atherosclerotic CVD for identifying indi-viduals for treatment [4]. Lower treatment thresholds, as proposed, would improve the identification of indi-viduals who require treatment, at the expense of in-creasing the numbers to treat and inin-creasing associated costs. Determining thresholds using diagnostic mea-sures to maximise sensitivity and specificity is still the preferred approach.
Study strengths and limitations
Framingham risk score model. It has been reported that while baseline ECG data to determine LVH were not avail-able, this is unlikely to have a significant impact on risk prediction as ECG-diagnosed LVH is very rare in the gen-eral population without CVD [67]. Only one set of base-line measurements was recorded for some risk variables but important variables were measured twice. Menopausal status of women was not recorded at time of survey. Low number of CVD events limits the ability for further de-tailed analyses to assess other risk factors currently not in-cluded in the risk score models discussed.
Conclusions
In this study, we have provided an independent external validation of the Framingham risk score model and the SCORE risk chart for low-risk and high-risk regions on a cohort of 4487 Australian females. The use of the Framingham risk score model and SCORE risk chart for low-risk regions, for predicting the 10-year CVD mortal-ity risk in the Australian women population is recom-mended. These models demonstrate good discrimination and calibration performance. Lower treatment thresh-olds are needed, in order to better identify individuals for treatment.
Abbreviations
CVD:Cardiovascular disease; CHD: Coronary heart disease; NHF: National Heart Foundation; AIHW: Australian Institute of Health and Welfare; ICD: International Classification of Diseases; SBP: Systolic blood pressure; ECG-LVH: Electrocardiogram-left ventricular hypertrophy; ATP-III: National Cholesterol Education Program’s Third Adult Treatment Panel; ROC: Receiver operating characteristic curve; AUC: Area under the curve; UK: United Kingdom; BMI: Body mass index; WC: Waist circumference; WHR: Waist to hip ratio; TC: Total cholesterol; HDL-C: High-density lipoprotein cholesterol; FPR: Framingham 10-year predicted risk for CVD death; SCORE-Low: SCORE-Low 10-year predicted risk for CVD death; SCORE-High: SCORE-High 10-year predicted risk for CVD death; CI: Confidence interval; Proposed*: Cut-point identified from our study using the Youden index for high sensitivity and specificity.
Competing interests
The authors declare that they have no competing interests.
Authors’contributions
LGHG was involved in drafting the manuscript, performing the analysis, interpreting the data and revising the manuscript critically for important intellectual content. TAW participated in the study design, acquired the data and revised the manuscript critically for important intellectual content. SSD conceived the study, performed the analysis and data interpretation and revised the manuscript critically for important intellectual content. All authors read and approved the final manuscript.
Author details
1School of Public Health, Curtin Health Innovation Research Institute (CHIRI),
Curtin University, Perth, Australia.2Department of Endocrinology and Diabetes, Sir Charles Gairdner Hospital, Perth, Australia.
Received: 29 April 2014 Accepted: 22 September 2014 Published: 26 September 2014
References
1. World Health Organization:Global Status Report on Noncommunicable Diseases 2010. InBook Global Status Report on Noncommunicable Diseases.
Geneva: WHO; 2011.
2. 3303.0 Causes of Death, Australia, 2011.http://www.abs.gov.au/ AUSSTATS/[email protected]/DetailsPage/3303.02011?OpenDocument.
3. Michos ED, Blumenthal RS:How accurate are 3 risk prediction models in US women?Circulation2012,125:1723–1726.
4. Goff DC, Lloyd-Jones DM, Bennett G, O’Donnell CJ, Coady S, Robinson J, D’Agostino RBS, Schwartz JS, Gibbons R, Shero ST, Greenland P, Smith SC, Lackland DT, Sorlie P, Levy D, Stone NJ, Wilson PWF:ACC/AHA guideline on the assessment of cardiovascular risk: a report of the American College of Cardiology/American Heart Association Task Force on Practice Guidelines.J Am Coll Cardiol2013,2014:63.
5. Australian Institute of Health and Welfare:Cardiovascular Disease: Australian Facts 2011. Cardiovascular Disease Series. Cat. no. CVD 53. In
Book Cardiovascular disease: Australian facts 2011. Cardiovascular Disease Series. Cat. no. CVD 53, Cardiovascular Disease Series. Canberra: AIHW; 2011. 6. Barzi F, Patel A, Gu D, Sritara P, Lam TH, Rodgers A, Woodward M, Asia
Pacific Cohort Studies Collaboration:Cardiovascular risk prediction tools for populations in Asia.J Epidemiol Community Health2007,61:115–121. 7. Greenland P, Alpert JS, Beller GA, Benjamin EJ, Budoff MJ, Fayad ZA,
Foster E, Hlatky MA, Hodgson JM, Kushner FG, Lauer MS, Shaw LJ, Smith SC, Taylor AJ, Weintraub WS, Wenger NK:ACCF/AHA Guideline for
Assessment of Cardiovascular Risk in Asymptomatic Adults: A Report of the American College of Cardiology Foundation/American Heart Association Task Force on Practice Guidelines Developed in Collaboration With the American Society of Echocardiography, American Society of Nuclear Cardiology, Society of Atherosclerosis Imaging and Prevention, Society for Cardiovascular Angiography and Interventions, Society of Cardiovascular Computed Tomography, and Society for Cardiovascular Magnetic Resonance.Circulation2010, 2010(122):e584–e636.
8. Australian Institute of Health and Welfare:Women and Heart Disease: Cardiovascular Profile of Women in Australia. Cardiovascular Disease Series no. 33. Cat. no. CVD 49. InBook Women and Heart Disease: Cardiovascular Profile of Women in Australia. Cardiovascular Disease Series no. 33. Cat. no. CVD 49, Cardiovascular Disease Series no. 33. Cat. no. CVD 49. Canberra: AIHW; 2010.
9. Goh LGH, Dhaliwal SS, Lee AH, Bertolatti D, Della PR:Utility of established cardiovascular disease risk score models for the 10-year prediction of disease outcomes in women.Expert Rev Cardiovasc Ther2013,11:425–435. 10. Anderson KM, Odell PM, Wilson PW, Kannel WB:Cardiovascular disease risk
profiles.Am Heart J1991,121:293–298.
11. Neil HAW, Perera R, Armitage JM, Farmer AJ, Mant D, Durrington PN: Estimated 10-year cardiovascular risk in a British population: results of a national screening project.Int J Clin Pract2008,62:1322–1331. 12. Woodward M, Brindle P, Tunstall-Pedoe H, for the SIGN group on risk estimation:
Adding social deprivation and family history to cardiovascular risk assessment: the ASSIGN score from the Scottish Heart Health Extended Cohort (SHHEC).Heart2007,93:172–176.
13. Conroy RM, Pyörälä K, Fitzgerald AP, Sans S, Menotti A, De Backer G, De Bacquer D, Ducimetière P, Jousilahti P, Keil U, Njølstad I, Oganov RG, Thomsen T, Tunstall-Pedoe H, Tverdal A, Wedel H, Whincup P, Wilhelmsen L, Graham IM:Estimation of ten-year risk of fatal cardiovascular disease in Europe: The SCORE project.Eur Heart J2003,24:987–1003.
14. Ridker PM, Buring JE, Rifai N, Cook NR:Development and validation of improved algorithms for the assessment of global cardiovascular risk in women.JAMA2007,297:611–619.
15. D’Agostino RBS, Vasan RS, Pencina MJ, Wolf PA, Cobain M, Massaro JM, Kannel WB:General cardiovascular risk profile for use in primary care: the Framingham Heart Study.Circulation2008,117:743–753.
16. Mosca L, Benjamin EJ, Berra K, Bezanson JL, Dolor RJ, Lloyd-Jones DM, Newby LK, Piña IL, Roger VL, Shaw LJ, Zhao D, Beckie TM, Bushnell C, D’Armiento J, Kris-Etherton PM, Fang J, Ganiats TG, Gomes AS, Gracia CR, Haan CK, Jackson EA, Judelson DR, Kelepouris E, Lavie CJ, Moore A, Nussmeier NA, Ofili E, Oparil S, Ouyang P, Pinn VW,et al:Effectiveness-based guidelines for the prevention of cardiovascular disease in women—2011 update: a guideline from the American Heart Association.J Am Coll Cardiol2011, 57:1404–1423.
prevention of cardiovascular disease in the adult–2009 recommendations.Can J Cardiol2009,2009(25):567–579.
18. Hippisley-Cox J, Coupland C, Vinogradova Y, Robson J, Minhas R, Sheikh A, Brindle P:Predicting cardiovascular risk in England and Wales: prospective derivation and validation of QRISK2.BMJ2008,336:1475–1482.
19. Altman DG, Royston P:What do we mean by validating a prognostic model?Stat Med2000,19:453–473.
20. Chen L, Tonkin AM, Moon L, Mitchell P, Dobson A, Giles G, Hobbs M, Phillips PJ, Shaw JE, Simmons D, Simons LA, Fitzgerald AP, De Backer G, De Bacquer D:Recalibration and validation of the SCORE risk chart in the Australian population: the AusSCORE chart.Eur J Cardiovasc Prev Rehabil
2009,16:562–570.
21. Zomer E, Owen A, Magliano DJ, Liew D, Reid C:Validation of two Framingham cardiovascular risk prediction algorithms in an Australian population: the‘old’versus the‘new’Framingham equation.Eur J Cardiovasc Prev Rehabil2011,18:115–120.
22. Simons LA, Simons J, Palaniappan L, Friedlander Y, McCallum J:Risk functions for prediction of cardiovascular disease in elderly Australians: the Dubbo Study.Med J Aust2003,178:113–116.
23. Knuiman MW, Vu HTV, Bartholomew HC:Multivariate risk estimation for coronary heart disease: the Busselton Health Study.Aust N Z J Public Health1998,22:747–753.
24. National Vascular Disease Prevention Alliance:Guidelines for the Assessment of Absolute Cardiovascular Disease Risk. InBook Guidelines for the Assessment of Absolute Cardiovascular Disease Risk.City: 2009.
25. Australian Risk Factor Prevalence Study Management Committee:Survey No. 3 1989. InBook Survey No. 3 1989.Canberra: National Heart Foundation of Australia and Australia Institute of Health; 1990.
26. Boyle CA, Dobson AJ, Egger G, Benault SA:Waist-to-hip ratios in Australia: a different picture of obesity.Aust J Nutr Diet1993,50:57–64.
27. Alexander H, Dugdale A:Which waist-hip ratio?Med J Aust1990,153:367–368. 28. World Health Organization:International Classification of Diseases. Manual
of the International Statistical Classification of Diseases, Injuries and Causes of Death, 9th Revision (ICD-9). InBook International Classification of Diseases. Manual of the International Statistical Classification of Diseases, Injuries, and Causes of Death, 9th Revision (ICD-9).Geneva: WHO; 1977. 29. World Health Organization:International Classification of Diseases. Manual
of the International Statistical Classification of Diseases, Injuries and Causes of Death, 10th Revision (ICD-10). InBook International Classification of Diseases. Manual of the International Statistical Classification of Diseases, Injuries and Causes of Death, 10th Revision (ICD-10).Geneva: WHO; 1998. 30. Expert Panel on Detection Evaluation and Treatment of High Blood
Cholesterol in Adults:Executive summary of the third report of the National Cholesterol Education Program (NCEP) expert panel on detection, evaluation, and treatment of high blood cholesterol in adults (Adult Treatment Panel III).JAMA2001,285:2486–2497.
31. National Cholesterol Education Program (NCEP) Expert Panel on Detection Evaluation and Treatment of High Blood Cholesterol in Adults (Adult Treatment Panel III):Third Report of the National Cholesterol Education Program (NCEP) Expert Panel on Detection, Evaluation, and Treatment of High Blood Cholesterol in Adults (Adult Treatment Panel III) Final Report. NIH Publication No. 02–5215.Circulation2002,106:3143–3421.
32. Cavanaugh-Hussey MW, Berry JD, Lloyd-Jones DM:Who exceeds ATP-III risk thresholds? Systematic examination of the effect of varying age and risk factor levels in the ATP-III risk assessment tool.Prev Med2008, 47:619–623.
33. Pencina MJ, D’Agostino RBS, Larson MG, Massaro JM, Vasan RS:Predicting the 30-year risk of cardiovascular disease: the Framingham heart study. Circulation2009,119:3078–3084.
34. Sans S, Kesteloot H, Kromhout D, on behalf of the Task Force:The burden of cardiovascular diseases mortality in Europe: Task Force of the European Society of Cardiology on Cardiovascular Mortality and Morbidity Statistics in Europe.Eur Heart J1997,18:1231–1248. 35. Hosmer DW, Lemeshow S:Applied Logistic Regression.John Wiley & Sons,
Inc: NJ, USA; 2000.
36. Cook NR:Use and misuse of the receiver operating characteristic curve in risk prediction.Circulation2007,115:928–935.
37. Hanley JA, McNeil BJ:The meaning and use of the area under a receiver operating characteristic (ROC) curve.Radiology1982,143:29–36. 38. Cui J:Overview of risk prediction models in cardiovascular disease
research.Ann Epidemiol2009,19:711–717.
39. Youden WJ:Index for rating diagnostic tests.Cancer1950,3:32–35. 40. Commonwealth of Australia:3302.0 - Deaths, Australia, 1993. InBook 3302.0
-Deaths, Australia, 1993.Canberra: Australian Bureau of Statistics; 1994. 41. Australian Bureau of Statistics:3302.0 - Deaths, 1999. InBook 3302.0 - Deaths,
1999.Canbera: Australian Bureau of Statistics; 2000.
42. Orford JL, Sesso HD, Stedman M, Gagnon D, Vokonas P, Gaziano JM: A comparison of the Framingham and European Society of Cardiology coronary heart disease risk prediction models in the normative aging study.Am Heart J2002,144:95–100.
43. Brindle P, Beswick A, Fahey T, Ebrahim S:Accuracy and impact of risk assessment in the primary prevention of cardiovascular disease: a systematic review.Heart2006,92:1752–1759.
44. Selvarajah S, Kaur G, Haniff J, Cheong KC, Hiong TG, van der Graaf Y, Bots ML: Comparison of the Framingham Risk Score, SCORE and WHO/ISH cardiovascular risk prediction models in an Asian population.Int J Cardiol
2014,176:211–218.
45. Dhaliwal SS, Welborn TA:Central obesity and multivariable cardiovascular risk as assessed by the Framingham prediction scores.Am J Cardiol2009, 103:1403–1407.
46. Hense H-W, Schulte H, Löwel H, Assmann G, Keil U:Framingham risk func-tion overestimates risk of coronary heart disease in men and women from Germany—results from the MONICA Augsburg and the PROCAM cohorts.Eur Heart J2003,24:937–945.
47. Thomsen TF, McGee D, Davidsen M, Jørgensen T:A cross-validation of risk-scores for coronary heart disease mortality based on data from the Glostrup Population Studies and Framingham Heart Study.Int J Epidemiol
2002,31:817–822.
48. Barroso LC, Muro EC, Herrera ND, Ochoa GF, Hueros JIC, Buitrago F: Performance of the Framingham and SCORE cardiovascular risk prediction functions in a non-diabetic population of a Spanish health care centre: a validation study.Scand J Prim Health Care2010,28:242–248. 49. Ulmer H, Kollerits B, Kelleher C, Diem G, Concin H:Predictive accuracy of
the SCORE risk function for cardiovascular disease in clinical practice: a prospective evaluation of 44 649 Austrian men and women. Eur J Cardiovasc Prev Rehabil2005,12:433–441.
50. Lindman AS, Veierod MB, Pedersen JI, Tverdal A, Njolstad I, Selmer R:The ability of the SCORE high-risk model to predict 10-year cardiovascular disease mortality in Norway.Eur J Cardiovasc Prev Rehabil2007,14:501–507. 51. May M, Lawlor DA, Brindle P, Patel R, Ebrahim S:Cardiovascular disease
risk assessment in older women: can we improve on Framingham? British Women’s Heart and Health prospective cohort study.Heart2006, 92:1396–1401.
52. Hippisley-Cox J, Coupland C, Vinogradova Y, Robson J, May M, Brindle P: Derivation and validation of QRISK, a new cardiovascular disease risk score for the United Kingdom: Prospective open cohort study.BMJ2007, 335:136.
53. Hippisley-Cox J, Coupland C, Vinogradova Y, Robson J, Brindle P: Performance of the QRISK cardiovascular risk prediction algorithm in an independent UK sample of patients from general practice: a validation study.Heart2008,94:34–39.
54. Eichler K, Puhan MA, Steurer J, Bachmann LM:Prediction of first coronary events with the Framingham score: a systematic review.Am Heart J2007, 153:722–731. e728.
55. de la Iglesia B, Potter JF, Poulter NR, Robins MM, Skinner J:Performance of the ASSIGN cardiovascular disease risk score on a UK cohort of patients from general practice.Heart2011,97:491–499.
56. Cook NR, Paynter NP, Eaton CB, Manson JE, Martin LW, Robinson JG, Rossouw JE, Wassertheil-Smoller S, Ridker PM:Comparison of the Framingham and Reynolds risk scores for global cardiovascular risk prediction in the multiethnic Women’s health initiative / clinical perspective.Circulation
2012,125:1748–1756.
57. Hense H-W:Observations, predictions and decisions—assessing cardiovascular risk assessment.Int J Epidemiol2004,33:235–239.
58. D’Agostino RBS, Grundy S, Sullivan LM, Wilson P, for the CHD Risk Prediction Group:Validation of the Framingham coronary heart disease prediction scores: results of a multiple ethnic groups investigation.JAMA2001, 286:180–187.
60. Dhaliwal SS, Welborn TA:Central obesity and cigarette smoking are key determinants of cardiovascular disease deaths in Australia: a public health perspective.Prev Med2009,49:153–157.
61. Cooney MT, Dudina A, D’Agostino R, Graham IM:Cardiovascular risk-estimation systems in primary prevention.Circulation2010,122:300–310.
62. Jackson R:Cardiovascular risk prediction: are we there yet?Heart2008, 94:1–3.
63. Koller MT, Steyerberg EW, Wolbers M, Stijnen T, Bucher HC, Hunink MGM, Witteman JCM:Validity of the Framingham point scores in the elderly: results from the Rotterdam study.Am Heart J2007,154:87–93. 64. Scheltens T, Verschuren WMM, Boshuizen HC, Hoes AW, Zuithoff NP, Bots
ML, Grobbee DE:Estimation of cardiovascular risk: a comparison between the Framingham and the SCORE model in people under 60 years of age. Eur J Cardiovasc Prev Rehabil2008,15:562–566.
65. Berry JD, Lloyd-Jones DM, Garside DB, Greenland P:Framingham risk score and prediction of coronary heart disease death in young men.Am Heart J2007,154:80–86.
66. Ford ES, Giles WH, Mokdad AH:The distribution of 10-Year risk for coronary heart disease among U.S. adults: Findings from the National Health and Nutrition Examination Survey III.J Am Coll Cardiol2004,43:1791–1796. 67. Milne R, Gamble G, Whitlock G, Jackson R:Framingham Heart Study risk
equation predicts first cardiovascular event rates in New Zealanders at the population level.N Z Med J2003,116:U662.
doi:10.1186/1472-6874-14-118
Cite this article as:Gohet al.:Independent external validation of cardiovascular disease mortality in women utilising Framingham and SCORE risk models: a mortality follow-up study.BMC Women's Health
201414:118.
Submit your next manuscript to BioMed Central and take full advantage of:
• Convenient online submission
• Thorough peer review
• No space constraints or color figure charges
• Immediate publication on acceptance
• Inclusion in PubMed, CAS, Scopus and Google Scholar
• Research which is freely available for redistribution