An investigation on the energy saving
potential of mini-sprinkler irrigation systems.
Svubure1 Oniward, Mbavarira2 Hardleeand Mutengu3 Sherman
1
Department of Irrigation and Water Engineering, Chinhoyi University of Technology, Off Harare-Chirundu Highway, P. Bag 7724, Chinhoyi, Zimbabwe. Tel.: +263 67 2203-5 or 29053-5; fax: +263 67 28957; Mobile: +263
912 662 122 2
Ministry of Agriculture, Mechanization & Irrigation Development, Department of Irrigation (Division of Research, Testing & Training), 10th Floor, Kaguvi Building, Corner 4th St. & Central Av. Private Bag 7724 Causeway, Harare,
Zimbabwe. Tel.: +263 4 731632. 3
International Organization for Migration, 142 King George Road, Avondale, Harare Tel: +263 4 335044/335048, Mobile: +263 913555729/ +263 733 321246
E-mail addresses:
[email protected], [email protected] (Oniward Svubure), [email protected] (Hardlee Mbavarira), [email protected] (Sherman Mutengu)
Abstract:
Single leg tests and hydraulic calibration experiments were done indoors to determine the water distribution uniformities for both the mini-sprinkler and conventional sprinkler spacing combinations operating at 10-30m head that produce optimum, uniform coverage and analyze the energy consumption. Results were analyzed using the software package SPACE from which the DU, CU, and SC for the two sprinkler types combinations at selected operating pressures. Densograms were obtained and appropriate spacing selected for comparison of the two systems. Mini-sprinklers have significantly higher water distribution uniformities than conventional sprinklers when operating at the same pressure of less than 30m. At less than 30m pressure heads, conventional sprinklers consume significantly more electrical energy than the mini-sprinklers. Therefore mini-sprinklers can replace conventional sprinkler systems at less than 30m pressure heads using both the (9m x12m) and (12m x12m) sprinkler spacing and reduce energy consumption by over 50% without compromising water application uniformity.
Key words: Mini-sprinkler, conventional sprinkler, Distribution Uniformity, Scheduling Coefficient, Christiansen’s Uniformity, Application Rate, Pumping energy
___________________________________________________________________________
1.0 Introduction
A sprinkler irrigation system generally includes sprinklers, laterals, main and sub-main pipelines, pumping plants and other accessories required for efficient water application. The planning and designing of irrigation systems normally endeavors to minimize both the initial capital outlay and the cost of applying a unit volume of water used1. In developing countries irrigated agriculture is touted as the vehicle for rural development. In Zimbabwe most of the irrigated agriculture uses the conventional sprinkler irrigation systems that are prone to high energy consumption2. Little research has been done on other less power consuming techniques. Since the beginning of Zimbabwe’s widely disputed fast track land resettlement programme at the turn of the millennium, the country has been experiencing severe power outages. The continuing economic downturn caused ever dwindling investment in the energy sector leading to power shortages. Consequently, it has become vital to look into other energy saving options which utilizes less power without compromising the water application efficiency of the irrigation systems. This paper investigated the potential of mini-sprinkler irrigation systems which is a water application system using low head none rotating or rotating mini-sprinklers3.
proportional to the discharge head and the efficiency of the pumping system as demonstrated by the formula used to calculate the kilowatt (kW) power requirements:
kW = Q x TDH x C x E Pump;
where: Q = discharge in l/s with
C = 102 (or Q in m3/hr with C = 360) TDH = Total Dynamic Head (m)
E Pump = pump efficiency
The kilowatt (kW) power formula above shows that reducing the total dynamic head will reduce the pumping energy hence the overall energy bill. Consequently systems with lower operating pressures or total dynamic head utilize significantly lower energies than those operating at high pressures. In addition, the annual or seasonal energy requirement increases with the increase of the total volume of water pumped annually or seasonally, and is therefore affected by the overall irrigation efficiency. Motor efficiency also has a bearing on energy requirement calculations. According to Longenbaugh and Duke4, motor efficiencies are in the range of 0.88 - 0.92. Motors of 7.5 kW or less have motor efficiencies usually below 0.88. For motors of 75 kW or larger the efficiency is 0.9 -0.92, hence there is the tendency to use higher motor efficiency factors in large size irrigation schemes as compared to smaller size irrigation schemes.
Ideally an irrigation system would apply water in a completely uniform manner so that each part of the irrigated area receives the same amount of water. Unfortunately there seems to be no way to achieve this. Even natural rainfall is not completely uniform. So the phrase irrigation uniformity actually refers to the variation or non-uniformity in the amounts of water applied to the locations within the irrigated area5. Significant effort in sprinkler irrigation system design and management is directed towards the dealing with problems related to irrigation uniformity and the lack of it. Several measures of uniformity are used. One of them is the distribution uniformity (DU) which measures how uniformly the irrigation system is applying water to the crop. It is calculated as the ratio of the average irrigation volume applied to the driest quarter (25%) of the field (or grid) and the average volume applied across the whole field (or grid). The minimum DU value required is 75%. The Coefficient of Uniformity (CU) is another long used calculated measure of non-uniformity in water application for a given sprinkler head, nozzle type, operating pressure, and spacing combination. It is based on the Christiansen’s distribution coefficient6. This is a statistical formula that examines the deviations from the average over the entire field and provides an evaluation in percentage7. The minimum acceptable value is 80%. The scheduling coefficient (SC) is another measure of uniformity. It is the ratio between the average precipitation rate (application rate) and the lowest precipitation rate in the sprinkler layout8. Thus the SC looks at the water application rate of the critical dry areas and compares it to the average water application rate over the entire irrigated area. The scheduling coefficient has a value equal to or greater than 1.0 but a value closer to 1.0 is desirable indicating a more uniform irrigation system.
2.0 Research objectives
The problem of erratic power supply and high energy costs in Zimbabwe has partly contributed to the steep decline in irrigated crop production. It is against this backdrop that this research study on mini-sprinklers was carried out to asses their potential to replace conventional sprinklers and reduce energy consumption in pressurized sprinkler irrigation systems. An investigation was therefore undertaken to determine if there was any significant difference between the amount of energy consumed in conventional and mini-sprinkler systems at predetermined low pressure ranges without compromising the system efficiency. The specific objectives of the study were to determine the Christiansen’s Uniformity (CU), distribution uniformity (DU), application rate and scheduling coefficient (SC) for both the mini-sprinkler and conventional sprinkler spacing combinations operating at pressure ranges of 10-30m that produce optimum, uniform coverage and analyze the energy consumption.
3.0 Materials and methods 3.1 Study area
sprinklers. Other materials used in the experiments included the sprinkler hanger, pump test panel, flow meter, rate meter, pressure gauges, stopwatch, identical catch cans, thermometer, trajectory height rule and data sheets. The sprinkler hanger is the building that encloses the cage and the catch cans to eliminate the effects of wind. Its length is large enough to accommodate more than 100 catch cans. The pump testing panel is connected to the pump and the sprinkler hanger; it is where the voltage, current, and power factor readings are obtained. The flow rate meter is meant to measure the rate of flow at a certain section of the pipe and its size depends on the size of the pipeline. The height of throw of the sprinkler (trajectory height) was measured by a specially graduated upright bar. Identical catch cans were used to collect water along the radius of sprinkler throw so as to measure uniformity (or unevenness) of water application by the sprinkler. The measurements show any unevenness in water distribution along the radius of throw which arises due to the layout (sprinkler positions) and system design. All the catch cans must be water tight and identical in shape and size. The height of the cans must be at least twice the average depth of irrigation water application if the run is to be done in the field. The specifications of the sprinklers used are summarized in table 1 below.
Table 1. Specifications of the mini-sprinkler and conventional sprinklers studied, 2009.
Type Mini- sprinkler Conventional sprinkler
Manufacturer Nelson Irrigation Corporation None Ferrous Irrigation Company
Material Heavy duty plastic Brass
Nozzle diameter 4mm 4mm
Rotation 3600 3600
3.2 Experimental procedure
Using four replicates for each mini-sprinkler and conventional sprinkler, the following sprinkler characteristics were measured indoors under no wind conditions: the radius of throw, flow rate, CU, DU and the application rate. The information was also used in the production of densograms (i.e. water distribution maps) indicating the least wetted area, a feature described quantitatively by the calculated scheduling coefficient (SC). The parameters were tested in turn at the sprinkler operating pressures of 100, 150, 200, 250 and 300kPa following the experimental protocols recommended by the International Network of Irrigation Testing Laboratories (INTL) and the International Standard for sprinkler testing (ISO) 15886-3.
3.2.1 Single leg test
The single leg test involved mounting the sprinkler on a 0.7m riser enclosed in a cage fitted with a pressure gauge placed a few centimeters away from the sprinkler. Identical catch cans were placed along the length of the sprinkler throw at an equal spacing of 0,3m to measure the amount of water that falls at various distances from the sprinkler head (application rate). The pump was then ‘switched on’ on the testing panel. Using the pressure control valves, pressure was adjusted up to the required test level. The was sprinkler left to run for 30 minutes before the initial readings are taken to allow it to self-adjust to the operating conditions. The operating pressure, rotational speed, height and radius of throw, and water temperature readings were recorded on the data sheet. These readings are repeatedly taken after every 30 minutes for 2hrs. Power readings (voltage, current, power factor) were also read and recorded from the testing panel each time. The pressure was monitored and maintained throughout the process. Effectively each sprinkler was run for 2½ hrs including the first 30 minutes of test run. At each 30 minute interval, the volumes of water that would have collected in the catch cans were measured using graduated measuring cylinders and entered in the data sheet. The procedure was repeated four times for each sprinkler type.
3.2.2 Hydraulic calibration
The hydraulic calibration included mounting the sprinkler on a riser connected to a water supply line. A flow rate meter was then connected to the riser just before the sprinkler. The sprinkler was run for not less than 5 minutes at each selected pressure level while the flow rate readings were taken. Water was taken from the sprinkler using a catch can and its temperature recorded on the available data sheets. The procedure was repeated 4 times for each sprinkler and the readings recorded.
4.0 Results and discussion
circular sprinkler head patterns, and then "overlapped" to simulate the irrigation coverage of multiple sprinkler heads positioned using specific spacing. Graphical presentations in form of densograms were obtained and appropriate spacing selected for the purpose of comparison of the two types of systems. From the data captured, the DU, CU, SC and the application rate were obtained using SPACE FOR WINDOWS programme and appropriate formulae.
4.1 Sprinkler single leg tests.
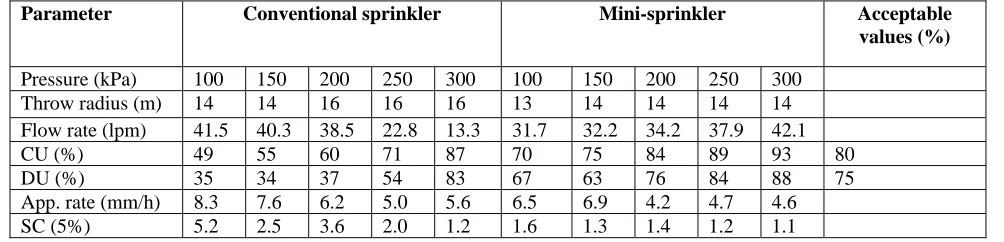
Tables 2 to 5 profiles both the conventional and mini-sprinkler sprinkler performance at different pressure levels at several selected sprinkler spacing. The data shows that the mini-sprinkler attains the minimum acceptable DU, CU and SC uniformity values at 200kPa operating pressure for the ‘9m X 12m’ and ‘12m X12m’ sprinkler spacing. On the other hand, the conventional sprinkler attains the minimum acceptable DU, CU and SC uniformity values at a higher operating pressure value of 300kPa for the ‘9m X 12m’ and ‘12m X12m’ sprinkler spacing. For the conventional and mini-sprinkler, the uniformity values are decreasing for larger spacing, but are evidently approaching the expected values as the pressure is increased.
Table 2. Conventional and mini-sprinkler performance at selected test pressures at 9m x 12m sprinkler spacing.
Parameter Conventional sprinkler Mini-sprinkler Acceptable
values (%)
Pressure (kPa) 100 150 200 250 300 100 150 200 250 300
Throw radius (m) 14 14 16 16 16 13 14 14 14 14
Flow rate (lpm) 41.5 40.3 38.5 22.8 13.3 31.6 32.2 34.2 37.9 42.1
CU (%) 52 62 67 77 91 77 81 86 88 93 80
DU (%) 38 57 53 70 87 69 73 78 80 90 75
App. rate (mm/h) 8.8 8.4 8.3 6.7 7.4 7.3 7.1 6.9 6.3 6.1
SC (5%) 5.6 2.5 2.0 1.5 1.1 1.9 1.5 1.7 1.4 1.1
Table 3.Conventional and mini-sprinkler performance at selected test pressures at 12m x 12m sprinkler spacing.
Parameter Conventional sprinkler Mini-sprinkler Acceptable
values (%)
Pressure (kPa) 100 150 200 250 300 100 150 200 250 300
Throw radius (m) 14 14 16 16 16 13 14 14 14 14
Flow rate (lpm) 41.5 40.3 38.5 22.8 13.3 31.7 32.2 34.2 37.9 42.1
CU (%) 49 55 60 71 87 70 75 84 89 93 80
DU (%) 35 34 37 54 83 67 63 76 84 88 75
App. rate (mm/h) 8.3 7.6 6.2 5.0 5.6 6.5 6.9 4.2 4.7 4.6
SC (5%) 5.2 2.5 3.6 2.0 1.2 1.6 1.3 1.4 1.2 1.1
Table 4.Conventional and mini-sprinkler performance at selected test pressures at 15m x 18m sprinkler spacing.
Parameter Conventional sprinkler Mini-sprinkler Acceptable
values (%)
Pressure (kPa) 100 150 200 250 300 100 150 200 250 300
Flow rate (lpm) 41.5 40.3 38.5 22.8 13.3 31.6 32.2 34.2 37.9 42.1
CU (%) 47 46 51 69 72 63 68 72 80 86 80
DU (%) 30 30 31 51 68 51 65 61 72 77 75
App. rate (mm/h) 6.5 7.2 3.3 2.7 3.0 3.9 4.1 2.8 2.5 2.4
SC (5%) 3.6 2.1 5.3 2.8 1.2 1.6 1.4 1.4 1.6 1.5
Table 5.Conventional and mini-sprinkler performance at selected test pressures at 18m x 18m sprinkler spacing.
Parameter Conventional sprinkler Mini-sprinkler Acceptable
values (%)
Pressure (kPa) 100 150 200 250 300 100 150 200 250 300
Throw radius (m) 14 14 16 16 16 13 14 14 14 14
Flow rate (lpm) 41.5 40.3 38.5 22.8 13.3 31.7 32.2 34.2 37.9 42.1
CU (%) 44 43 45 70 75 65 66 74 79 85 80
DU (%) 26 35 41 62 55 49 59 56 65 76 75
App. rate (mm/h) 4.9 5.9 2.8 2.2 2.5 3.5 3.7 2.3 2.1 2.0
SC (5%) 2.5 2.3 2.6 1.8 2.2 1.7 1.4 1.9 1.5 1.4
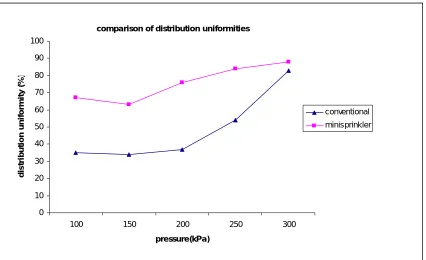
Figure 1 below shows that the DU for the mini-sprinkler is higher than that of the conventional sprinkler but however the differences become negligible as the pressure increases. At this instance it must be remembered that at very high pressure levels, the uniformity is affected as the sprinkler becomes susceptible to wind under windy conditions as the spray becomes fine. The CU (figure 2) follows a similar trend as the DU. It must be noted that low irrigation uniformity often produces large variations in crop yields and quality. Improving water application uniformities to at least the minimum required levels leads to better economic returns.
comparison of distribution uniformities
0 10 20 30 40 50 60 70 80 90 100
100 150 200 250 300
pressure(kPa)
di
s
tr
ib
ut
ion
un
if
o
rm
it
y
(
%
)
conventional minisprinkler
christiansens uniformities 0 10 20 30 40 50 60 70 80 90 100
100 150 200 250 300
pressure (kPa) ch ri st ian sen 's u n if o rmi ty ( % ) conventional sprinkler minisprinkler
Fig. 2. Christiansen’s uniformities for the conventional and mini-sprinkler compared
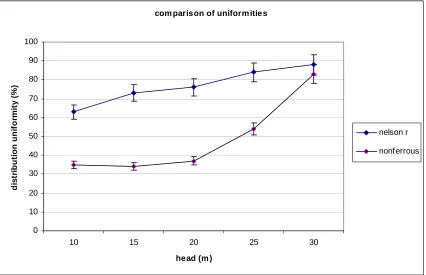
Figure 3 below shows the statistical comparison of only the DUs for the two sprinkler types. At 5% significance level, the graph shows that there is a significant difference in the distribution uniformities at the same pressure in the lower pressure ranges as evidenced by the error bars which are not overlapping. The error bars begin to overlap at a head of 30m and this indicates that the performance becomes almost the same (insignificant) from that pressure level such that no significant differences can be noticed in terms of the uniformity parameters.
Fig. 3. Statistical analysis for distribution uniformities for conventional and mini-sprinkler. com parison of uniform ities
0 10 20 30 40 50 60 70 80 90 100
10 15 20 25 30
head (m )
4.2 The hydraulic calibration and energy consumption
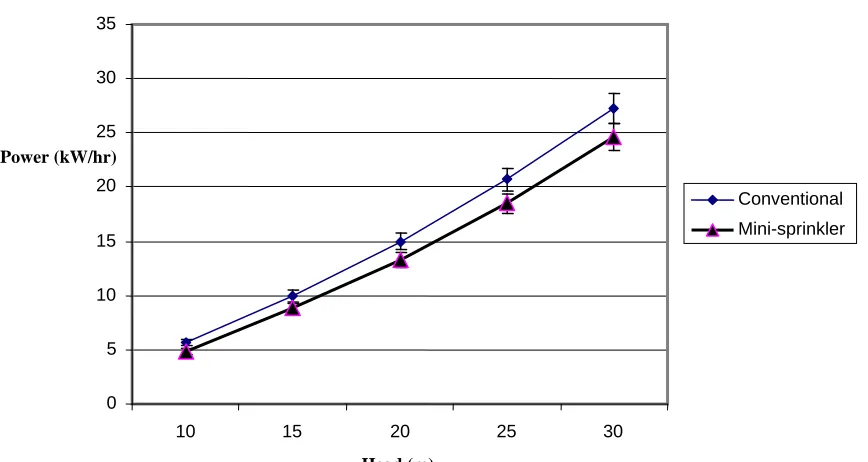
It was observed that conventional sprinklers consume more electrical energy as compared to the mini-sprinklers when operating at the same pressures (table 6). For example, operating a mini-sprinkler at a pressure of 200 kPa consumes an average of 13.32Kw as compared to a conventional sprinkler which consumes an average of 15Kw at that same pressure. A mini-sprinkler consumes less energy without compromising on the uniformities of irrigation water application (irrigation efficiency in the broadest sense) at these low pressures. Tables 2 to 5 above shows that to achieve minimum acceptable values of CU and DU, theconventional sprinkler has to be operated at pressure of not less that 300kPa while the mini-sprinkler can be operated at a pressure of 200 kPa which is a 100 kPa lower than the minimum requirements for conventional sprinklers. At a pressure of 300 kPa a conventional sprinkler consumes energy of 23.7Kw/hr while a mini-sprinkler consumes 13.3Kw/hr at a pressure of 200 kPa. The difference of 14Kw/h (27.3-13.3) in power consumed is above 50% and this suggests that by using mini-sprinklers, energy costs may be reduced by approximately half at that pressure level without compromising water application uniformity.
Table 6.Hydraulic calibration and power consumption for conventional and mini-sprinkler sprinkler.
Pressure (kPa)
Conventional sprinklers
Mini-sprinklers
Discharge (m3/h) Power (Kw/h) Discharge (m3/h) Power (Kw/h)
50 1.31 2.13 1.13 1.83
100 1.73 5.62 1.50 4.86
150 2.04 9.95 1.81 8.84
200 2.31 15.00 2.05 13.32
250 2.55 20.75 2.28 18.48
300 2.80 27.26 2.53 24.62
350 3.00 34.08 2.69 30.57
400 3.17 41.22 2.87 37.32
450 3.37 49.30 3.04 44.48
500 3.52 57.14 3.19 51.86
550 3.70 66.06 3.36 60.10
600 3.83 74.67 3.48 67.84
Fig.4. Statistical analysis for power consumption for conventional and mini-sprinkler
Densograms (water distribution maps) are an effective visual method which can be used to show
the variation in distribution uniformity or the water application uniformity. The densograms
show the effect of sprinkler head spacing in terms of overlap at different selected operating
pressures assisting in the selection of the desired water application uniformities. The edges of the
densograms are taken as sprinkler positions
with the square representing the least wetted area. Figures 5 to 8 shows that at the low pressure ranges of 200kPa to 250kPa, the mini-sprinkler densograms exhibit a more even water distribution uniformity than the conventional sprinklers at both the (9m x12m) and (12m x12m) sprinkler head spacing.
Mini-sprinkler: Conventional sprinkler:
(CU=84%, DU=76%, SC = 1.4) (CU = 60%, DU = 37%, SC = 3.6)
Fig. 5. Densograms for 12m x 12m convectional and mini-sprinkler at 200kPa
Comparison in power consumption
0 5 10 15 20 25 30 35
10 15 20 25 30
Head (m) Power (kW/hr)
Conventional
Mini-sprinkler: Conventional sprinkler:
(CU = 89%, DU = 84%, SC = 1.2) (CU = 71%, DU = 54%, SC = 2.0)
Fig. 6. Densograms for 12m x12m convectional and mini-sprinkler at 250kPa
Mini-sprinkler: Conventional sprinkler:
(CU = 86%, DU = 78%, SC = 1.7) (CU = 67%, DU = 53%, SC = 2.0)
Fig. 7. Densograms for 9m x12m convectional and mini-sprinkler at 200kPa
Mini-sprinkler: Conventional sprinkler:
(CU = 88%, DU = 80%, SC = 1.4) (CU = 77%, DU = 70%, SC = 1.5)
Fig. 8. Densograms for 9m x12m convectional and mini-sprinkler at 250kPa
5.0 Conclusion and recommendations
under wind conditions in an open field. At low operating pressure heads of less than 30m, conventional sprinklers consume significantly more electrical energy at 5% significance level as compared to the mini-sprinklers when operating at the same pressure. Therefore mini-sprinklers can be used in place of conventional sprinkler systems at low operating pressure ranges of 200kPa to 250kPa at both the (9m x12m) and (12m x12m) sprinkler head spacing and effectively reduce energy consumption by over 50% without compromising water application uniformity. It is recommended to opt for the (12m x12m) sprinkler head spacing because while it conforms to the minimum acceptable water distribution uniformities, less material is used as compared to the (9m x 12m) spacing which also satisfies the minimum required values of uniformity.
6.0 References
1 FAO 45, Guidelines for designing and evaluating surface irrigation systems, Prof. W. R. Walker, consultant to FAO, Department of
Agricultural and Irrigation Engineering, Utah State University, Logan, Utah 84322-4105.FAO, United Nations, Rome, Distribution and sales, FAO, Via delle Terme Caracalla, 00100, Rome, Italy, 1989.
2 M. Rukuni, Makadho J. “Irrigation Development”, In: M Rukuni and CK Eicher (eds), Zimbabwe’s agricultural revolution, University of
Zimbabwe Publications, Harare, 1994, pp. 127-38.
3 B. Withers and S. Vipond. Irrigation: Drainage and practice. BT Batsford limited London, 1988
4 R. A. Longenbaugh and H.R. Duke. Farm Pumps. Design and Operation of Farm Irrigation Systems. Ed. M.E. Jensen. A.S.A.E. Monograph
No. 3, St. Joseph, MI., USA, 1980.
5 B. Ashcroft, Filtration of micro jets/mini-sprinkler and trickle irrigation systems department of natural resources and environment, Victoria
Australia, [online] URL: http:www.wca-infornet org/id/17473 [accessed: 5 July 2008], 1995.
6 J.E. Christiansen, The uniformity of application of water by sprinkler systems, Agric Eng 22: 89-92, 1941. 7 I. Broner, Micro irrigation for orchard and row crops. Colorado State University,
Cooperation and extension. Colorado USA. [online] URL: http://www.ext.colostate.edu. [accessed: 15 July 2008], 2002.
8 A. G. Smajstrla, B.J. Boman, G.A. Clark, D.Z. Haman, D.J. Pitts, F.S. Zazueta, Field
Evaluation of Irrigation Systems: Solid Set or Portable Sprinkler Systems. IFAS Ext. Bul. 266, University of Florida, Gainesville, FL., 1990.