Procedia - Social and Behavioral Sciences 186 ( 2015 ) 790 – 799
1877-0428 © 2015 The Authors. Published by Elsevier Ltd. This is an open access article under the CC BY-NC-ND license (http://creativecommons.org/licenses/by-nc-nd/4.0/).
Peer-review under responsibility of Academic World Education and Research Center doi: 10.1016/j.sbspro.2015.04.075
ScienceDirect
5th World Conference on Learning, Teaching and Educational Leadership, WCLTA 2014
Reflection on Teaching IT for Non-Computing Students
Shirley Gibbs
a*, Patricia Anthony
a, Stuart Charters
aaDepartment of Informatics and Enabling Technologies, Faculty of Society, Environment and Design,
P O Box 85084, Lincoln University, Lincoln 7647, Christchurch, New Zealand
Abstract
This paper reflects on the first semester of teaching an introductory computing courses using a non-traditional approach. For several years’ the institution offered two computing courses, introduction to computing and introductory programming to first year students from a variety of degree programmes. In 2014, due to a qualification reform, a new computing course (computing fundamentals) was introduced as the only first year computing course. There were 55 students in this class of whom the majority (84%) were non-computing majors. To ensure that students are still getting the IT skill required for their degrees, we developed a curriculum that combines topics on data management and programming. We have taught this course for a semester. At the beginning of the semester, students were given a pre-course questionnaire which included self-rating of knowledge and also some skill questions related to the material to be covered in the new course. At the end of the semester, we compared the results from the skill questions with the results of the final examination. There was overall improvement in both spreadsheet and the programming knowledge. The final results indicated that students were more likely to struggle with the programming component than they were the spreadsheet component. The average final mark for the spreadsheet component was 70% whereas the average final mark for the programming was only 16%. Students failed to make a connection between these two areas and did not relate the creation of complex spreadsheet formula to writing simple expressions in a programming environment. Although, our study indicated that students were struggling with the programming, they seemed to be more receptive to learning programming using an interactive environment rather than the traditional code writing environment.
© 2015 The Authors. Published by Elsevier Ltd.
Peer-review under responsibility of Academic World Education and Research Center.
Keywords: computing; teaching; data management; programming; curriculum
* Shirley Gibbs. Tel.: +64 34230418
E-mail address: [email protected]
© 2015 The Authors. Published by Elsevier Ltd. This is an open access article under the CC BY-NC-ND license (http://creativecommons.org/licenses/by-nc-nd/4.0/).
1.Introduction
There has, recently, been a perception that it is unnecessary to teach any form of introductory computing to first year undergraduate students as they are considered to be much more computer literate than previously (Grant, Malloy & Murphy, 2009). However, studies have found that these perceptions are not always accurate (Grenci, 2013). Increasingly students are being exposed to a digital environment at younger ages than in the past. They have access to computers at home and at school. The majority of them possess smart phones, tablets and other digital technology devices. Students appear to be at ease in a rapidly changing environment, and embracing technology and its associated quickening of life (McLennan & Gibbs, 2008). Research has shown students to be more adept at using internet resources such as social networking for communication, however this does not equate to them having have good skills in basic calculations or the management and manipulation of data (Kline & Strickland, 2004; Bartholomew, 2004; Hoffman & Vance, 2005; McLennan & Gibbs, 2008; Dyer, MacKinnon, Han & Elder, 2013).
Generally, introductory computing courses at university level are those courses which teach digital literacy. These courses are often organised by the level of knowledge it is expected new students will bring with them as well as what it is deemed necessary for students finishing an introductory course should need to know. Introductory level computing courses at universities often are found in the Computer Science or Information Technology department and are concerned with the teaching of programming languages to students heading toward a career in Information Technology. However institutions may offer some kind of introductory digital literacy course, without credit, for incoming students as a way of ensuring that students are familiar with the computing environment in which they will study. Students in traditional IT courses are seldom from disciplines other than those associated with Information Technology, partly this may be due to the commonly assumption that computer programming is complex and hard to learn (Mason & Cooper, 2014).
This new course, developed, necessary due to an institution wide qualification-structuring, is a combination of an introductory spreadsheet, introductory programming and technology social issues. The course was delivered to first year students from a range of degrees for the first time in 2014.
Prior to the qualification restructuring, students were able to take two courses, Comp101, compulsory for many students teaching IT literacy, data management, WEB and social issues. Comp102, compulsory for computing students, teaching an introduction to programming. Higher level computing courses required one or both of these courses as prerequisites. Comp111, the new course, was developed from a drive to reduce to research the number of courses offered and provide a streamline pathway to higher level courses. The course was designed to cover 45% data management, 45% introductory programming and 10% social issues. Data management topics were delivered first and included spreadsheet and decision making formulas. It was anticipated that learning about decision making formulas including IF’s would allow students to transfer knowledge to the programming material. The programming module used Scratch* to introduced concepts and then got students to further develop their skills using Visual
Basic.NET. The initial cohort of students enrolled in February 2014, in total 55 students, 36 males and 19 females, ranging in age from 17 to 49 years.
We describe an investigation to ascertain if the new course imparts the necessary IT knowledge required for academic study (Section 3). The result of the investigation were analysed (Section 4) to identify shortcomings and course revisions required. Our overall thoughts and changes for the future are then discussed (Section 5).In order to set the scene for our computing course we first discuss previous work on teaching introductory computing.
2.Literature Review
Introductory computing courses usually teach material concerned with digital literacy. These courses are often bound by the demands and requirements of non-computing departments in an institution who have expectations of student outcomes. In a review of such courses Dyer et al., (2013) reports that the educational implications of the student’s background in computing are not inconsequential. They say that the confidence and familiarity students enter the classroom with, have an impact on the instructor and the material chosen for teaching. Likewise, they say that students’ level of confidence using technology is likely to influence the instructor’s expectations for course
*
outcomes. They found that on entering the course, student’s claimed knowledge of basic computer concepts and terminology as well as online use, however, more than half of their students were incapable of answering questions about basic computing.
Dixon (2013) warns that although it is acceptable to assume that incoming students will have had exposure to modern technology, it is wrong to assume that they will have all the necessary IT skills necessary to complete their studies and to progress into the workplace. Dixon recommended that instead of just assuming skill level it would be more prudent for institutions to adopt a model of pre-testing so as to ensure that skills being taught were at an appropriate level.
Often the assumptions of ability are enhanced by the student’s level of confidence and self-perception of skill and knowledge. Students entering university from high school generally have a high perception of their own computer knowledge and competency (McLennan & Gibbs, 2008; van Braak, 2004; Ballantine, Larres, & Oyelere, 2007). Frequently these perceptions do not correlate with actual knowledge and competence (Grant et al., 2009). Students typically over-estimate their ability. These perceptions or self-ratings have been found in previous studies to be inaccurate, yet this method is still one which is used as a method of assessment (Easton & Easton, 2004; Ballantine et el, 2007; Karsten & Roth, 1998; Wallace & Clariana, 2005).
The teaching of computer programming has long been seen as a challenge, complicated by low pass rates and a multitude of languages to choose from (Rountree, Rountree, Robins & Hannah, 2004). In reporting on the factors influencing the uptake of IT study, Kori, Atlin, Pedaste, Palts and Tonisson (2014) say that although there are many opportunities in this field the retention rate in many courses is low. They say that this is influenced, in part, by the mathematics requirement embedded in many IT qualifications. They also suggested another reason for low uptake in these courses and a possible reason for low retentions rates was that incoming students have had high exposure to technology. This exposure may mean that their confidence levels are at a point where they either do not consider they need any more computing education or they are surprised by their lack of knowledge in an area they considered easy.
Forte & Guzdial (2003) examined the fail grades and withdrawal rates of students in an introductory computing course. These students were from three different study backgrounds, computing, engineering and communication. They found that those in courses tailored for their disciplines were more likely to complete the course than those in less tailored courses.
Another reason that students fail to prosper in first year programming courses, according to Garner (2009) is the cognitive load they experience, especially those with no exposure to writing computer programs. Garner successfully attempted to address this issue by using the language Scratch to teach novices. Scratch is a drag and drop language where students are not initially overwhelmed with a lot of new terms and processes. Instead the idea of languages such as Scratch is that students learn concepts before they interact directly with the language. Although Scratch was primarily designed for younger programmers (8 – 16 years) it is and has been used in University programs as an introduction to programming. In the new course described in this paper Scratch was used as the initial introduction to computer programming.
3.Research Method
Data for this were collected from three different sources.
1. A pre-course questionnaire to establish the baseline of students perceptions of knowledge and actual knowledge
2. Final exam marks were evaluated to see change in actual knowledge. 3. Course evaluation to see student perception of the course.
3.1.Pre-course questionnaire
terms of computing knowledge (in particular data management and programming). We compare this result with the students’ performance in the final exam as well as the course evaluation conducted at the end of the semester.
The questionnaire collected information about students’ genders, schooling including previous computing education, and current computer usage. The questionnaire also asked respondents to rate their knowledge in computing, spread-sheeting and programming and their confidence in using computers. These ratings were given on a 5 point Likert type scale where 1 equated to absolute beginner and 5 to expert. The method of self-rating is frequently used to estimate a person’s computer ability. It is used in situations such as job applications where an employer might take the word of the candidate, rather than test them. While self-rating is common it has been found not to be accurate (Easton & Easton, 2004; Ballantine et al., 2007; McLennan & Gibbs, 2008; Wallace & Clariana, 2005). Often it is found that those who have a lower level of knowledge are the ones who are most likely to give themselves a higher rating (Ballantine et al., 2007).
Three knowledge based questions were included to give an estimate of students’ competencies in using a spreadsheet. There was one similar knowledge based programming question. The programming question, required the students to understand an IF expression and apply the same logic similar to a question in the spreadsheet section. Computer competency has been defined in several different ways (see for example Yoon & Lee, 2007). In this study the authors use the term competency to mean having knowledge and capability to complete specified spreadsheet or programming tasks. The number of correct answer for these questions was also calculated.
3.2.Final Examination
Results from the end of semester exam were also scrutinised. Student marks were divided into three sections, spreadsheets (45%), programming (45%) and social issues (10%). In this paper we are focusing on the spreadsheet and the programming and not the social issues as this section only contributed 10% to the final mark.
3.3.Course Evaluation
An online evaluation was conducted for the new course near the end of the semester. Student perceptions from these evaluations were taken into account in the final analysis of this course.
4.Results and Discussion
In the section that follows, we present the results from the pre-course questionnaire and discuss these along with our analysis of the final exam marks.
There were 55 students in this course with 38 questionnaires returned giving a response rate of 70% The non-computing students made up 84% (n = 31) of this population. The age range of respondents was 17 – 49 (m = 23.3, sd = 7.3), there were 14 female respondents and 24 male respondents.
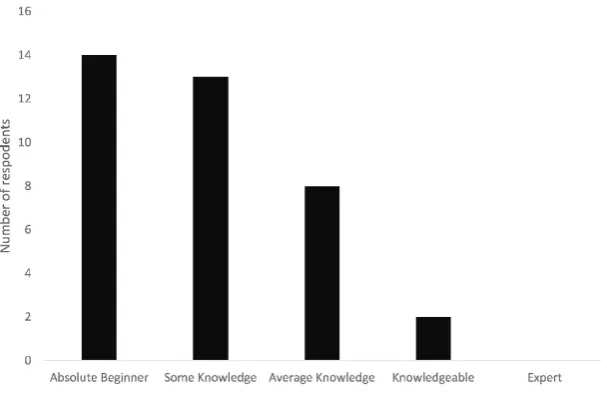
Fig. 1. Self-rating of computer knowledge
As the domain of computing is very broad, the question may have been ambiguous to some. When we compare these results to the results of question two (Fig. 2), (What computer devices do you own or have regular access to?), we could draw the conclusion that the respondents have based their estimation of their knowledge on their usage of technology. We can see that the majority of respondents have both a smartphone and a laptop and some also have access to a desktop computer or a tablet.
Confidence using computers often increases as use of such technology increases (McLennan & Gibbs, 2008). We can see that the majority of respondents (90%) rated their level of confidence using computers as average or greater (M = 3.4, sd = 0.82) (Fig. 3). This rating may be related to the high incidence of device ownership and use as shown in Fig. 2 and also to regular use of the Internet and all it has to offer.
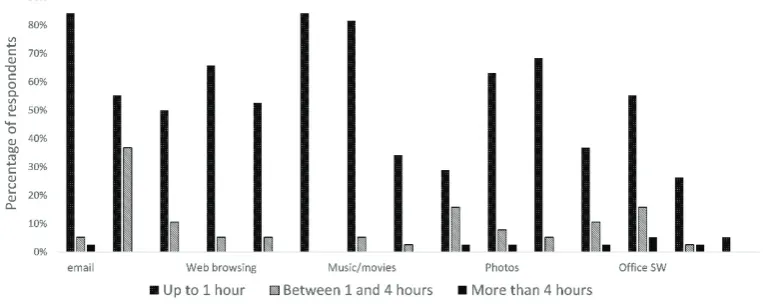
When asked how they spent their computer time, the results pointed toward a high usage of the Internet in some way. The result, shown in Fig. 4, confirm that the majority of interaction with technology involves some type of connectivity and often relating to some type of social interaction.
Aside from the general computer knowledge and confidence questions, respondents were also asked to self-rate their spreadsheet knowledge. Generally, respondents rated their knowledge using spreadsheets as between having some knowledge to having average knowledge (M= 2.7, sd = 0.9). These results are shown in Fig. 5 in which 63%
of respondents have average knowledge or more in spreadsheet. There was a weak (r = 0.51) correlation between respondents self-rating of computing knowledge and spreadsheet knowledge (Fig. 5).
Fig. 3. Self-rating of computer confidence
As expected the majority (89%) of respondents rated their computer knowledge the same or greater than their spreadsheet knowledge. Many of these respondents would have used spreadsheets already in their education, so are likely to feel comfortable with this application. However, only 45% of respondents were able to correctly answer a simple Excel SUM question. This kind of result is not uncommon given that self-assessments are often higher than actual results (Ballantine et al., 2007). The respondents in this paper are first year university students and it may be unrealistic to expect them to be able to accurately estimate their level of knowledge. Gibbs, Steel and McKinnon (2014) found that people regularly using spreadsheets in the workplace were also unable to accurately estimate their skill level and that even a simple sum calculation was outside the skill level of some in their study. The results for the spreadsheet skill questions are shown in Fig. 6.
Although there was no significant correlation between a respondent’s self-rated spreadsheet knowledge and the number of spreadsheet tasks they got correct in the pre-course questionnaire (r = 0.41). The results of the spreadsheet section of the final exam were pleasing with a class average of 70%. When we compare these results with the average of the spreadsheet questions from the questionnaire (21%) we can see an overall improvement in spreadsheet knowledge. This is substantial in that there has been an average improvement in spreadsheet knowledge of about 50%. This might mean that students, who have used an application before, respond well in a guided learning environment where they can use what they already know and extend these skills further.
Respondents were also asked to self-rate their programming knowledge. These results are shown in Fig. 7. As expected, 26% of the respondents rated themselves as having average knowledge or higher in programming. Respondents were asked if they were aware that there were a number of different languages available to write computer programs. 70% were aware of different languages. This result supports the response from the self-rating of programming knowledge in which 60% of respondents have some awareness of computer programming (Fig. 7).
Although 84% respondents to the questionnaire indicated that they had heard of computer programming most of them (82%) had no prior experience in programming. Given that the majority (84%) of the class were non-computing students the class average for the programming section of the final was only 16%. Respondents were asked just one knowledge section in this section of the questionnaire. This question required them to understand the logic of an IF expression. This was the same logic used in the IF formula question in the spreadsheet section. The results for this programming question were poor with only 3 respondents (8%) knowing the correct answer. This result is not a lot different from the same question in the spreadsheet section. This suggests that respondents did not understand the decision making logic regardless of if the expression was presented as a spreadsheet formula or a statement in computer code.
As mentioned, we began the programming part of the course by using the Scratch programming environment. Scratch is a drag and drop application that allows students to learn by experience rather than confusing them with the syntax and semantics of a language. Students seemed to enjoy using Scratch and the results from the scratch question in the final exam supports this with a class average of 46%. The results from the programming part of the course, both the scratch and the VB sections, suggest that non-computing students more receptive to a more interactive environment such as Scratch where it is not necessary to remember a lot of syntax to write code. These
results clearly support the findings of Garner (2009) in that with Scratch students are not distracted by learning and remembering syntax and are almost learning by playing.
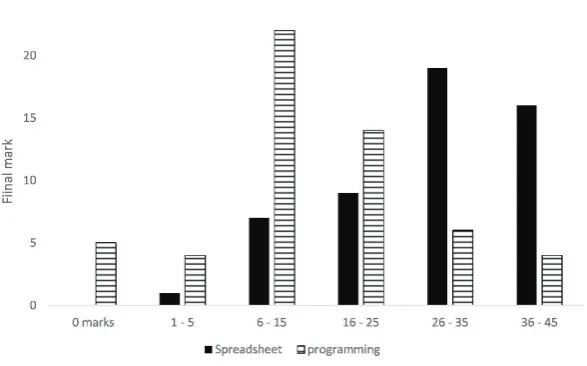
When we look at a comparison of mark distribution for final results we see that most of the students received a mark between 6 and 15 for the programming section. This is not uncommon in introductory programming where often the result is an inverse normal distribution, with students either knowing or not knowing the material (Rountree et al., 2004).
The marks distribution for the spreadsheet questions shows that students did better in this section of the course than they did in the programming section. There was significant correlation (r= 0.60) between the spreadsheet and the programming results in that the strong students did well in both sections just as the weak students did not perform in either. This is shown in Fig. 8.
We can say that the students seems to find learning spreadsheets to be easier than they do programming. What is surprising is that the students do not seem to see the link between writing quite complex spreadsheet formulae and writing simple expressions in a computer language. This finding suggests that there is a need for us to bridge this gap and to come up with creative ways to make students realise that when they write an IF expression in a spreadsheet, for example, the formation of the selection logic is similar in programming.
Students also seemed more comfortable with Scratch as a programming language rather Visual Basic.Net. Unfortunately, during the delivery of the course, students only had one lab session using Scratch as opposed to four lab sessions in Visual Basic. We also had two hours lectures of Scratch and ten hours of Visual Basic lectures. This seems to indicate that perhaps there is a need to revise the programing module of the course and put more emphasis on Scratch.
The course evaluation supports our findings in that majority of the students seemed to think that writing program is hard and that they have difficulty familiarising themselves with the Visual Studio environment.
5.Conclusion and Future Work
Overall, the delivery of this new course went well. The exam results were not dissimilar to the previous two courses this one replaced. The student retention throughout the semester was good at 95%. Of the 55 students who enrolled in the course 53 sat the final exam. Often in introductory programming the attrition rate is higher, for example in the previous programming courses attrition rate was 14%, and in this course it was 5%.
The results from the questionnaire show that a student’s perception of their computer knowledge may be greater than the reality. However, when we compared the results from the skill questions on the questionnaire to results from similar exam questions we see a marked improvement in skill and knowledge. There was a 50% overall improvement in the spreadsheet section of the final exam compared to the spreadsheet knowledge questions in the pre-course questionnaire. Although the average mark for programming section of the final exam was lower than the spreadsheet section it was higher than the result from the programming knowledge question in the pre-course questionnaire. However we have found that students seem to have more affinity for working in a drag and drop type environment such as Scratch as opposed to actually writing computer code.
Our experience this year has led us into thinking about how we can link the teaching of spreadsheets with the teaching of computer programming in such a way that students are able to see the similarities of both of these skill sets. If we can successfully convince students of the relationship between what they see as unrelated skills we believe that we will see a marked improvement in the programming section of the course.
This year we had only a minimal amount of exposure to the Scratch language before moving into a more traditional programming environment. In the future we will extend the time spent using Scratch in order to expose students to more of the programming concepts such as IF statements and Loops before moving into a traditional language.
References
Ballantine, J., McCourt, L. P., Oyelere, P. (2007). Computer Usage and the validity of self assessed computer competence among first year business students. Computers and Education,49, 976-990.
Bartholomew, K. (2004) Computer Literacy: Is the Emperor Still Exposed After All these Years?. Consortium for Computing Sciences in Colleges, 323-331.
Caputo, D., & Dunning, D. (2005). What you don’t know: The role played by errors of omission in imperfect self-assessments. Journal of
Experimental Social Psychology, 41, 488-505.
Dixon, N. (2013). Scaffolding Fully Online First Year Computer Literacy Students for Success. Irish Journal of Academic Practice, 2(1), 5. Garner, S. (2009). Learning to Program from Scratch. In proceedings of Ninth IEEE International Conference on Advanced Learning
Technologies (ICALT 2009), 451-452.
Gibbs, S., Steel, G., & McKinnon, A. (2014). Are workplace end-user computing skills at a desirable level? A New Zealand perspective. In proceedings of Twentieth Americas Conference on Information Systems, Savannah,USA.
Grant, D., Malloy, A., & Murphy, M. (2009). A comparison of student perceptions of their computer skills to their actual abilities. Journal of Information Technology Education: Research, 8(1), 141-160.
Grenci, R. (2013). Positioning computer literacy as a value-added business core course. Business Education and Accreditation, 5(1), 67-80. Hoffman M., & Vance, D. (2005). Computer Literacy: What Students know and from whom they learned it. SIGCSE 05, 356-360.
Karsten R., & Roth R., (1998). The Relationship of Computer Experience and computer Self-Efficacy to Performance in Introductory Computer Literacy Courses. Journal of Research on Computing Education 31(1), 14 -24.
Kline, D., & Strickland, T. ( Skill Level Assessment and Multi-Section Standardization for an Introductory Microcomputer Applications Course.
Issues in Information Systems, V(2), 572-578.
Kori, K., Altin, H., Pedaste, M., Palts, T., & Tõnisson, E. (2014). What influences students to study information and communication technology. In Proceedings INTED2014, 1477-1486.
McCourt, L. P., Ballantine, J., Whittington, M. (2003). Evaluating the validity of self assessment: measuring computer literacy among entry level undergraduates with accounting degree programmes at two UK universities. Accounting Education, 12, 97-112.
McLennan, T., & Gibbs, S. (2008). Has the computing competence of first year university students increased during the last decade? In Proceedings 25th Annual ASCILITE Conference, Melbourne, Australia.
Rountree, N., Rountree, J., Robins, A., & Hannah, R. (2004). Interacting factors that predict success and failure in a CS1 course. ACM SIGCSE Bulletin Vol. 36, No. 4, 101-104).
Van Braak J. (2004). Domains and determinants of university students’ self-perceived computer competence. Computers &Education, 43, 299 – 312.
Wallace, T., Clariana, R. B. (2005). Perception versus Reality –Determining Business Students’ Computer Literacy Skills and Need For
Instruction in Information Concepts and Technology, Journal of Information Technology Education, 4, 141-151.