Lincoln
University
Digital
Thesis
Copyright
Statement
The
digital
copy
of
this
thesis
is
protected
by
the
Copyright
Act
1994
(New
Zealand).
This
thesis
may
be
consulted
by
you,
provided
you
comply
with
the
provisions
of
the
Act
and
the
following
conditions
of
use:
you
will
use
the
copy
only
for
the
purposes
of
research
or
private
study
you
will
recognise
the
author's
right
to
be
identified
as
the
author
of
the
thesis
and
due
acknowledgement
will
be
made
to
the
author
where
appropriate
you
will
obtain
the
author's
permission
before
publishing
any
material
from
the
thesis.
Effects of aspects of
terroir
on the
phenolic composition of New Zealand
Pinot noir wines
A thesis
submitted in partial fulfilment
of the requirements for the Degree of
Master of Applied Science
at
Lincoln University
by
Wei Liu
ii
Abstract of a thesis submitted in partial fulfilment of
the requirements for the Degree of Master of Applied Science.
Effects of aspects of
terroir
on the phenolic composition of New Zealand
Pinot Noir wines
By
Wei Liu
Phenolic content is an important dimension of Pinot noir wine quality. This study aimed
to find generic relationships between the phenolic content of Pinot noir wines produced
from well-defined locations (single vineyards) in New Zealand, as determined from
various chemical analyses, and aspects of terroir relating to local climate, soils and
methods of production and information collected from questionnaires.
Two New Zealand Pinot noir wines were stored at room temperature (with and
without headspace sparging with N2), at 4°C (with and without sparged N2), at - 20°C,
and at - 80°C following flash freezing with liquid nitrogen, after the original, sealed
bottles were opened. The changes in total phenolics, total tannins, anthocyanins and
colour parameters over 134 days were quantified. Results showed that the
colour-related parameters were more sensitive to storage conditions and time compared with
the other parameters. Storage at - 80°C could be the optimal way to preserve colour
parameters, as it generally caused the least change in values and induced the least
precipitation over the whole experimental period, followed by storage at 4°C.
A total of 86 single-vineyard Pinot noir wines were collected from the 2013 Bragato
wine competition. Analyses, using standard methods for total phenolics, total tannins
and colour measurements, and HPLC (high-performance liquid chromatography)
analysis of monomeric species separated using a published SPE (solid-phase extraction)
method, were carried out on these wines. Some strong correlations were found
between the different ways of taking measurements on the same, or similar,
compounds in wines. Generally, the regional or vintage differences in total phenolics
content and total tannins, were not dramatic, but there were evident regional and
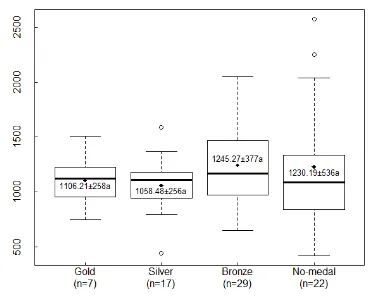
vintage differences in the colour parameters. Wines awarded different medals grades
iii
tended to have deeper colour densities and were higher in total anthocyanins than the
bronze and no-medal wines, but were not necessarily lower in colour hue. The overall
phenolic content differences investigated using PCA (principal component analysis),
showed separations between Otago wines and Marlborough wines, and also between
vintage 2012 wines, 2011 wines and 2010 wines, although there were some overlaps in
these separations.
A total of 41 viable questionnaires were returned. Viticulture, winemaking and barrel
ageing practices were all quite similar among wines and influences for these
parameters on individual phenolics were not able to be drawn. In contrast, soils
differed considerably between regions and there were consistent negative and linear
correlations between vine potential vigour as affected by soil parameters (carbon
content, potential rooting depth and profile readily available water) and key colour
parameters (total anthocyanins, total red pigments, ionised anthocyanins, and
malvidin-3-glucoside), while positive correlations with some hydroxybenzoic acids were
also found.
Keywords: anthocyanin, colour, flavanol, flavonol, Folin-Ciocalteu, HPLC,
hydroxybenzoic acid, hydroxycinnamic acid, malvidin-3-glucoside, MCP, PCA, phenolics,
iv
Acknowledgements
Thanks to all the people involved in the project, as the project would not be completed
without your involvement. I would like to thank Dr. Roland Harrison who is my main
supervisor, and it is too much to list all the things he helped with me and all the good
resources he provided. I would like to thank Dr. Glen Creasy, my co-supervisor, who
also provided me with endless help.
Thanks also to New Zealand Winegrower who generously allowed us to sample wines
from the 2013 Bragato wine competition. I would also like to thank the following
individuals and groups: Janette McKibbin for verifying the single-vineyard wines so
fast; Caitriona Cameron who assist me to improve my writing; Simon Hodge who
helped with me in data analysis; Richard Hider for assisting me with laboratory work;
Tracey Gibson who helped me sending out the questionnaires in individual letters;
Jenny Zhao and her colleagues who did a fantastic job of the LC-MS analysis on all the
86 wine samples; Kirsten Creasy for coming to have meetings with us to exchange
ideas; the Department of Soil and Physical Sciences of Lincoln University for looking up
the soils information and gathering all the data in a nice spreadsheet; Janette Busch for
doing copy editing for the whole thesis; and finally all the industry people involved, as
your contributions to the questionnaire data base are fundamental to the study.
Finally, I would like to thank my parents for their unconditional support all along. I
would like to thank modern technology that enable me to contact my family and
v
Contents
Abstract ... ii
Acknowledgements ... iv
Contents ... v
List of Tables ... viii
List of Figures ... x
Chapter 1 Introduction ... 1
Chapter 2 Literature review ... 4
2.1 Introduction 4 2.2 Important phenolics in Pinot noir grapes and wines 4 2.2.1 Flavonoids 4 2.2.2 Flavonols and non-flavonoids 9 2.3 Effects of temperature, yield, soil and water on grape phenolics 9 2.3.1 Causes of variability in studies 9 2.3.2 Heat summation 12 2.3.3 Yield 15 2.3.4 Soil and water 19 2.4 Phenolics: from grapes into wines 26 2.4.1 Relationships between phenolics in grapes and in the resultant wines 26 2.4.2 Extractability of proanthocyanidins 27 2.4.3 Brix 28 2.4.4 Maceration time 32 2.4.5 Oak usage 35 2.5 Summary 35 2.6 Hypothesis and expected outcomes 36 Chapter 3 Pinot noir wines storage experiments ... 37
3.1 Introduction 37
vi
3.3 Results and discussion 41
3.3.1 General trends 41
3.3.2 Total phenolics 44
3.3.3 Total tannins 45
3.3.4 Colour assay 46
3.4 Conclusions 53
Chapter 4 Phenolic composition of New Zealand Pinot noir wines ... 54
4.1 Introduction 54
4.2 Materials and methods 54
4.2.1 Collection and storage of experiment wines 54
4.2.2 Total phenolics, total tannins and colour parameters on the original
wines 59
4.2.3 Wine fractionation 59
4.2.4 HPLC/MS analysis on Fraction 1 60
4.2.5 Statistical analysis 66
4.3 Results 67
4.3.1 Total phenolics 67
4.3.2 Total tannins 73
4.3.3 Wine pH and colour parameters 78
4.3.4 Results of the fractionations 87
4.3.5 HPLC/MS analysis results on fraction1 91
4.3.6 Overall phenolic profile- multivariate analysis 100
4.4 Discussion 106
4.4.1 Total phenolics 106
4.4.2 Total tannins 108
4.4.3 Colour parameters 109
4.4.4 Validation of SPE separation efficiency 111
4.4.5 Phenolic measures by HPLC/MS 111
4.4.6 Overall phenolic profile 114
vii
Chapter 5 Influences of viticultural and winemaking processes and soils on wine
phenolics ... 118
5.1 Introduction 118
5.2 Materials and methods 119
5.3 Results 122
5.3.1 Overview of data from the completed questionnaires 122
5.3.2 Influence of viticultural and winemaking processes on phenolics in
wines 123
5.3.3 Relationships between regions and sub-regions, and soil properties and
wine phenolics 128
5.4 Discussion 132
5.4.1 Influence of viticultural and winemaking processes on phenolics in
wines 132
5.4.2 Relationships between regions and sub-regions, and soil properties and
wine phenolics 133
5.5 Conclusions 135
Chapter 6 Summary ... 136
6.1 Conclusions 136
6.2 Future perspectives 138
References ... 141
Appendices ... 158
viii
List of Tables
Table 3.1 Treatments used to investigate effect of storage on wine phenolic
parameters. ... 40
Table 3.2 Summary of averaged values of two Pinot noir wines in a wine
preservation experiment across time and storage methods with least
significant difference of means at the 5% level. ... 43
Table 3.3 Averaged relative values of total phenolics of two Pinot noir wines in a
wine preservation experiment across time and storage methods ... 44
Table 3.4 Averaged relative values of total tannins of two Pinot noir wines in a wine
preservation experiment across time and storage methods ... 46
Table 3.5 Averaged relative values of total anthocyanins of two Pinot noir wines in a
wine preservation experiment across time and storage methods ... 47
Table 3.6 Averaged relative values of colour hue (nil SO2)of two Pinot noir wines in
a wine preservation experiment across time and storage methods ... 48
Table 3.7 Averaged relative values of colour density (nil SO2)of two Pinot noir wines
in a wine preservation experiment across time and storage methods. .. 49
Table 3.8 Averaged relative values of estimated SO2-resistant pigments of two Pinot
noir wines in a wine preservation experiment across time and storage
methods ... 50
Table 3.9 Visual ratings of precipitations observed in tubes on different analysis
days in wine preservation experiment. ... 52
Table 4.1 Number of experiment wines according to region, vintage and medals ... 58
Table 4.2 HPLC solvent gradient ... 61
Table 4.3 Retention time and quantification wavelength for detected compounds 62
Table 4.4 Negative channels for confirming standards and searching unknown
compounds ... 63
Table 4.5 Positive channels for confirming standards and searching unknown
compounds ... 64
Table 4.6 Average values of pH and colour parameters measured on whole wine .. 84
Table 4.7 Recovery and tannin separation efficiency values for the 86 wines based
ix
Table 4.8 Means of concentrations of phenolics in F1 according to vintage, medal
grade and region ... 99
Table 4.9 Wines containing gallocatechin ... 100
Table 4.10 Loadings of the first two components generated from selected
parameters in relation to regions. ... 102
Table 4.11 Loadings of the first two components generated from selected
parameters in relation to vintage ... 103
Table 4.12 Loadings of the first two components generated from selected
parameters in relation to medal grades ... 105
Table 5.1 Summary of wines with returned questionnaires ... 120
Table 5.2 Explanations for soil parameter categories summarised from the Land
Resource Information Systems’ data dictionary ... 121
Table 5.3 Influence of leaf-removal methods on flavonol compounds ... 124
Table 5.4 Correlations between yield, Brix, pre- and post-ferment maceration time,
length of barrel ageing, and proportions of new barrel used and wine
phenolics ... 127
Table 5.5 The significant influences of sub-region nested in region on phenolic
compounds of the 41 wines ... 129
Table 5.6 Correlations between class levels of individual soil parameters and each
x
List of Figures
Figure 2.1 Flavonoid ring structure and numbering (Kennedy et al. 2006) ... 5
Figure 2.2 Different forms of anthocyanins (Cheynier et al. 2006)... 8
Figure 2.3 Proportions of different forms of anthocyanins across pH values (Ribéreau-Gayon & Glories 1987) ... 8
Figure 3.1 Correlations between total monomeric anthocyanins and polymeric pigments in two wines from wine preservation experiment. ... 51
Figure 4.1 The room set-up for the 2013 Romeo Bragato wine competition. ... 55
Figure 4.2 Examples of squeezable plastic bottles, from left to right: empty 100 mL and 50 mL, full 100 mL and 50 mL, squeezed 50 mL. ... 56
Figure 4.3 LC-MS analysis of 16 mixed standards (100 ppm) at 250 nm ... 64
Figure 4.4 LC-MS analysis of 16 mixed standards (100 ppm) at 280 nm ... 65
Figure 4.5 LC-MS analysis of 16 mixed standards (100 ppm) at 320 nm ... 65
Figure 4.6 LC-MS analysis of 16 mixed standards (100 ppm) at 350 nm ... 66
Figure 4.7 LC-MS analysis of 16 mixed standards (100 ppm) at 520 nm ... 66
Figure 4.8 Correlation matrix of all the total phenolics measurements on the whole wines and their fractions ... 69
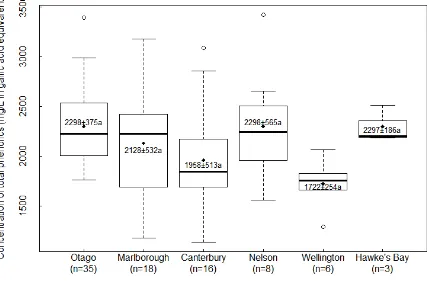
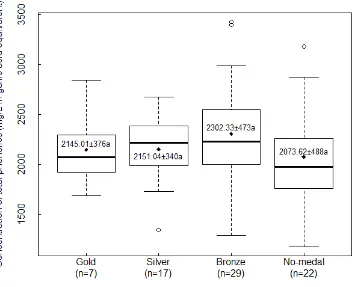
Figure 4.9 Ranges of total phenolic concentrations in wines from different regions. The band is the median value. The the bottom and top of the boxes are the first and third quartiles. The extended dotted line was 1.5 times the difference between the upper and lower quartiles. The unfilled dots indicate outliers. The diamond indicates the data point of the mean value and the numbers are the average values with standard deviations. Mean values with the same letter are not significantly different at p ≤ 0.05 using Tukey's HSD (honest significant difference) test. ... 70
Figure 4.10 Ranges of total phenolic concentrations in wines from different vintages. The boxplot and statistical analysis was the same as in Figure 4.9. ... 71
xi
Figure 4.12 Correlation matrix of MCP assay on original whole wine and their
fractions and total phenolics by Folin–Ciocalteu method ... 74
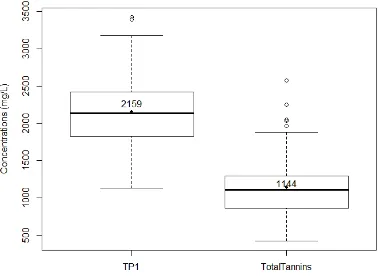
Figure 4.13 Concentrations of total phenolics and total tannins in original whole
wine. The boxplot was the same as in Figure 4.9. ... 75
Figure 4.14 Ranges of total tannin concentrations (in epicatechin equivalent) in
wines from different regions. The boxplot and statistical analysis was the
same as in Figure 4.9. ... 76
Figure 4.15 Ranges of total tannin concentrations (in epicatechin equivalent) in
wines from different vintages. The boxplot and statistical analysis was
the same as in Figure 4.9. ... 77
Figure 4.16 Ranges of total tannin concentrations (in epicatechin equivalent) in
wines with different medal grades. The boxplot and statistical analysis
was the same as in Figure 4.9. ... 78
Figure 4.17 Range of the 86 wines pH. The diamond indicates the mean value, while
3.34 and 3.95 refer to minimum value and maximum value,
respectively. ... 79
Figure 4.18 Correlation matrix of all the absorbance measurements at 520 nm. All
the parameters were related to the original whole wine, except
F1Total520nm, which was the measurement of total peak area of
Fraction1 at 520 nm in the HPLC assay. A520: absorbance at 520 nm.
A520CH3CHO: absorbance at 520 nm with added acetaldehyde. TRP:
total red pigments. PPC520nm: polymeric pigments colour at 520nm.
TAn: total anthocyanins (mg/L). IAn: ionised anthocyanins (mg/L).
IAnNS: ionised anthocyanins nil SO2 (mg/L) ... 80
Figure 4.19 Example of the appearance of fractions (wine No.28). ... 82
Figure 4.20 Colour density and hue in relation to vintages and medals ... 85
Figure 4.21 Polymeric pigments colour and total anthocyanins in relation to vintage
and medals ... 86
Figure 4.22 Total red pigments and ionised anthocyanins in relation to vintage and
medals ... 86
Figure 4.23 Concentrations of total phenolics in individual fractions. The boxplot
xii
Figure 4.24 Concentrations of total tannins in individual fractions. The boxplot was
the same as in Figure 4.9. ... 90
Figure 4.25 LC-MS analysis of wine No. 28 at 250 nm ... 91
Figure 4.26 LC-MS analysis of wine No. 28 at 280 nm ... 92
Figure 4.27 LC-MS analysis of wine No. 28 at 320 nm ... 92
Figure 4.28 LC-MS analysis of wine No. 28 at 350 nm ... 93
Figure 4.29 LC-MS analysis of wine No. 28 at 520 nm ... 93
Figure 4.30 The concentrations of individual types of phenolics in F1. The boxplot was made in the same way as Figure 4.9. ... 94
Figure 4.31 Distributions of individual flavan-3-ol monomers in F1. The boxplot was made the same way as in Figure 4.9. ... 95
Figure 4.32 The range of ratios between Malvidin-3-glucoside in F1 and total anthocyanins in original whole wine. ... 96
Figure 4.33 Plot of the first two components generated from selected parameters in relation to regions ... 102
Figure 4.34 Plot of the first two components generated from selected parameters in relation to vintage ... 104
Figure 4.35 The ratio between catechin in F1 and total tannins in whole wine. The boxplot and statistical analysis was the same as in Figure 4.9. ... 105
Figure 4.36 Plot of the first two components generated from selected parameters in relation to medal grades ... 106
1
CHAPTER 1
INTRODUCTION
Terroir is a French word that has no direct English translation. Hence, different people
have developed various understandings about it. In a traditional view, Van Leeuwen &
Seguin (2006)have suggested the scope of terroir includes climate, soil, cultivar and
human practices. In contrast, Moran (2006) demonstrated that aspects of terroir
include: oenology, identity, promotion and legalities, as well as climate and soil. In
Wikipedia, terroir has been loosely translated as ‘a sense of a place’. Due to the
numerous factors and their interactions involved in understanding the nature of terroir,
it is hard to study this system in-depth (Seguin 1986).
Generally, berry composition, including the anthocyanin content, is determined by
gene expression (Boss et al. 1996) and is also modified by the environment and
phenology (Cortell and Kennedy 2006, Ryan and Revilla 2003, Yokotsuka et al. 1999).
Soil is an important aspect of the grape growing environment. The spatial variation of
grape composition within a vineyard supports the idea that soil has an important
influence. Across a vineyard, the meso-climate is identical so differences in cultural
practices are minimised; thus, a large part of the variability in grape composition within
a vineyard can be due to soil (Bramley et al. 2011, Trought and Bramley 2011). In
addition, berry composition, including sugar and anthocyanin concentration, were
shown by van Leeuwen et al. (2004) to depend significantly on the soil composition.
The percentage of variance in grape anthocyanin concentration attributed to soil was
reported to be 30% (van Leeuwen et al. 2004).
One aspect of grape composition of particular importance is the phenolic content. The
relationship between the soil and grape phenolics is not simple. This connection may
not be direct, but occurs through several closely related factors. The influence of soil
on vine vigour, and any subsequent change in the exposure of clusters, is the most
2
stimulates phenolic synthesis (Creasy and Creasy 2009). Therefore, increasing vine
vigour is likely to decrease the phenolic concentration in the grapes.
Grapes with high concentrations of total phenolics, anthocyanins and tannins also tend
to result in wines with high concentrations of all these phenolic compounds.
Koundouras et al. (2006) showed this by comparing the composition of berries and
wines originating from three sites using the same wine-making protocols. It is not
possible to predict the concentration of phenolics in wine based solely on the
corresponding grape phenolic concentrations (Cortell et al. 2007b). However, the total
concentration of phenolics in grapes was the limiting factor for the maximum quantity
of phenolics able to be extracted into wines. In other words, the composition and
concentration of phenolics in wine was driven by those in the grapes (Cortell et al.
2005).
Despite this lack of a simple relationship between grape and wine composition,
research has shown that soils can influence the phenolic content of wines. Ubalde et al.
(2010) demonstrated that colour intensity and the concentrations of tannins,
anthocyanins and total polyphenols were significantly influenced by the soil. The
percentage variances in the concentrations of anthocyanins, tannins and total
polyphenols in wines were all reported to be greater than 60%.
Previous research that compared phenolics of wines made with grapes from different
soils was based on only a small number of sites. These case studies analysed the soil
parameters of the experimental sites in detail and attempted to explain the connection
between the soil characteristics and phenolic contents of the resultant grapes or wines.
In previous research, the relative importance of the individual soil parameters on vine
vigour was hard to determine. For example, in research by de Andrés-de Prado et al.
(2007), soil with higher proportions of coarse fractions also had lower organic matter,
while in research by Chone et al. (2001), the site with the shallowest root zone depth
also had the lowest organic matter.
Pinot noir is an important varietal wine for the New Zealand wine industry. Other
researchers have surveyed the aroma compounds in Pinot noir wines from New
3
study also examined some phenolic parameters; specifically, wine colour, MCP (methyl
cellulose precipitable) tannin, and a limited number of monomeric phenolics. However,
the commercial wines they used were only characterised by region and many would
have been blends incorporating components from a number of different vineyards.
This study, therefore, represents the first comprehensive survey of phenolics from New
Zealand Pinot noir wines. Furthermore, by using examples produced from specific sites
(so-called single vineyard wines) we anticipate that it will be possible to determine the
relative importance of the major factors (including soil) that influence the phenolic
composition of wines from this variety in New Zealand. The aim of this study is to
characterise the extent of this variation in New Zealand Pinot noir with a particular
emphasis on understanding the contribution of soil differences to the nature and
4
CHAPTER 2
LITERATURE REVIEW
2.1 Introduction
Phenolic compounds are of great importance to wine quality. However, literature
reviews on factors affecting the phenolic profile in the resultant grapes are rare (Cohen
& Kennedy 2010), maybe due to the lack of knowledge of the mechanisms relating to
phenolic synthesis, e.g. the details of tannin maturation post-veraison (He et al., 2008).
The following review of the literature aims to summarise previous studies investigating
the influence of factors selected in this study on phenolics in grapes and wines.
2.2 Important phenolics in Pinot noir grapes and
wines
2.2.1 Flavonoids
Flavonoids refer to a group of compounds, which include flavanols (also known as
flavan-3-ols), flavonols (also known as flavon-3-ols) and anthocyanins, which all share
the same C15 structure (Figure 2.1).
2.2.1.1 Flavan-3-ols (including proanthocyanidins)
Grapes and wine contain both monomer and polymer flavan-3-ols. Proanthocyanidins
(PAs), also termed tannins, exist in both the skins and seeds of grape berries. Skin
5
found in skin are catechin, epicatechin, gallocatechin, epigallocatechin, epicatechin
gallate and epigallocatechin gallate (Souquet et al. 1996). The mDP (mean degree of
polymerisation) of skin tannins was generally higher than those in seed tannins. For
example, in early research, the average mDP of skin tannins was 28, and the maximum
DP (polymerisation degree) detected was 80, while that of seed tannins was only 11
(Souquet et al. 1996). Another difference is that seed tannins have a higher percentage
of galloylation (esterification with gallic acid) than skin tannins (Lorrain et al. 2011).
Figure 2.1 Flavonoid ring structure and numbering (Kennedy et al. 2006)
Tannins are important as the astringency level of a wine is almost all attributed to
them; they also impart bitterness. The concentration of tannins and their mDP
influence astringency greatly (Wollmann & Hofmann 2013). The concentration of
tannins in wine is positively related to their perceived astringency level and is a
dominant factor in the astringency level in wine (Kennedy et al. 2006). Recent research
carried out by Weber et al. (2013) found that the bonding of anthocyanins to tannins
also decreases the perceived astringency. Moreover, condensed tannins with higher
degrees of polymerisation contribute more to astringency than to bitterness (Lorrain et
al. 2011). The quality of astringency, whether harsh or not, is related to the subunits in
the condensed tannins. An increase in galloylation increases the coarseness in wine,
while this perception declines with increased proportion of epigallocatechin (Vidal et
al. 2003).
Pinot noir wines, as surveyed by Harbertson et al. (2008), are characterised by low
tannin concentrations. They undertook a survey of 1325 commercial red wines and
reported the mean concentration of tannins in Pinot noir wines to be 384 mg/L
6
and Zinfandel wines. Hence, total tannin levels in wines of the current research are
anticipated to be low as well.
2.2.1.2 Anthocyanins
Anthocyanins are water-soluble pigments that exist mainly in the skins of black/red
grape berries, and they can be red, purple or blue in colour, and the colour is pH
dependent. Anthocyanins exist as glucosides in berries. White grape varieties do not
contain anthocyanins in their berries. Anthocyanins are formed by glycosidation at
position 3 of the C-ring, and exist in the glycoside form in grapes (Jackson 2008). There
are five anthocyanin monoglucosides produced through hydroxylation and
methoxylation of the B-ring: malvidin-3-O-glucoside, peonidin-3-O-glucoside,
delphinidin-3-O-glucoside, petunidin-3-O-glucoside and cyanidin-3-O-glucoside.
Generally, malvidin-3-O-glucoside is the major anthocyanin in Vitis vinifera (Fong et al.
1971). These anthocyanin monoglucosides can be further acylated at the C6 position of
the glucose moiety, with coumaric acid, acetic acid or caffeic acid (Jackson 2008).
However, Pinot noir only contains non-acylated anthocyanins (Fong et al. 1971, Mazza
et al. 1999).
Anthocyanins are susceptible to change during wine storage, and binding with other
molecules helps to stabilise the molecule. The binding of anthocyanin molecules to
other non-coloured organic compounds is called copigmentation, which sometimes
accounts for 30- 50% of the colour of young red wines (Boulton 2001). It reflects the
equilibrium between anthocyanins and many cofactors, mainly cinnamic acids and
quercetin glycosides (Boulton 2001). This phenomenon is expressed in two ways. First,
these associated compounds show greater colour than what could be expected from
their concentrations. Secondly, the occurrence of copigmentation enables more
anthocyanins to be retained, resulting in higher total anthocyanin concentrations in
wines (Boulton 2001). Phenolic acids and flavonoids, so-called cofactors, the
compounds binding with anthocyanin glucosides in wines, are the primary factors
influencing copigmentation. Hence, grape varieties, including Pinot noir, that are low in
7
copigmentation in Pinot noir may be that acylated forms of anthocyanins, which are
absent in Pinot noir, are thought to be important for copigmentation (Boulton 2001).
Besides copigmentation, longer-term stability is usually via binding with
proanthocyanidins, with the association resulting in pigmented polymers (Jackson
2008). This phenomenon is of importance for Pinot noir wines, as Cortell et al. (2007a)
reported that colour density could be predominantly due to the concentration of the
pigmented polymers.
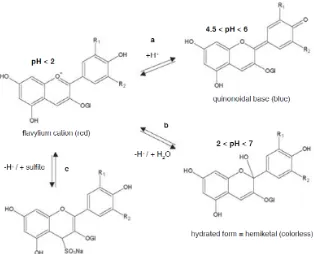
Anthocyanins have different forms in wines. The flavylium cation form (A+) shows a
red colour, but the addition of sulphur dioxide results in a colourless form of
anthocyanin. The bleaching effect of sulphur dioxide also exists in some types of
polymeric anthocyanins (Versari et al. 2007). Moreover, anthocyanins show a marked
change in colour with change in pH. An increased pH results in the colourless hydrated
(AOH) and quinonoidal base (AO) forms (Figure 2.2). Cheynier et al. (2006) has
suggested that only in very acidic conditions (pH < 2), is the flavylium cation the
dominant form. Figure 2.3 by Ribéreau-Gayon & Glories (1987) shows the relative
proportions of different forms of anthocyanins across pH values; it also shows that the
flavylium cation form becomes predominant when pH gets down to two (T-A suggests
8
Figure 2.2 Different forms of anthocyanins (Cheynier et al. 2006)
9
2.2.2 Flavonols and non-flavonoids
Flavonols, mainly kaempferol, quercetin and myricetin, contribute to copigmentation in
red wines (Boulton 2001, Jackson 2008). Furthermore, flavonols and phenolic acids
might influence bitterness and astringency in wines, but this is debated. Hufnagel and
Hofmann (2008) reported that some flavonols, such as quercetin-3-galactoside and
syringetin-3-glucoside, showed a velvety astringency and some phenolic acids, such as
caffeic and caftaric acids could result in ‘puckering’ astringency, though they looked at
these materials in water. In contrast, early research by Vèrette et al. (1988) found the
contribution of cinnamic acids to the taste of Chardonnay wines was not evident in
duo-trio difference tests.
Gallic acid is an indicator of seed and oak product contact during the wine making
process. Furthermore, ellagic acid is notably high in wines in contact with oak products
(Jackson 2008).
2.3 Effects of temperature, yield, soil and water on
grape phenolics
2.3.1 Causes of variability in studies
2.3.1.1 Season and cultivar
It is recognised that season and cultivar differences can cause variations in grape
phenolic profiles (Mazza et al. 1999, Cohen & Kennedy 2010, Bowen et al. 2011).
Seasonal differences could include differences in heat summation, rainfall (or their
respective distributions across the whole year), viticultural practices and, perhaps, vine
status. Sunlight not only provides heat but also light, and both can influence grape
phenolics. Sometimes, seasonal differences can override the factors being investigated,
10
Moreover, genetic origin affects the responses of vines to soil water conditions (Sivilotti
et al. 2005). However, information about the physiological responses of different
genotypes of Pinot noir is rare in the literature.
2.3.1.2 Extraction solvents
Extraction solvents have been recognised to be a crucial factor influencing
measurements of grape tannin composition as a result of selective extraction (Pinelo et
al. 2005, Bindon et al. 2013). Sivilotti et al. (2005) reported that in Merlot, relationships
between water stress level and total polyphenols in skins and seeds on a berry weight
basis were reversed in two different extraction solvents comprising of a mixture of
methanol and ethanol. For seed tannins, Bindon et al. (2013) reported the 70% v/v
acetone:water, used as a tannin extraction solvent resulted in different tannins
compared with tannins extracted into wines. This phenomenon still limits progress in
this area.
2.3.1.3 Soil nutrients
In general, the direct response of vines to nitrogen is growth, as this nutrient is
essential for protein synthesis (Creasy & Creasy 2009). The altered canopy microclimate
affects phenolics in grapes (Bell & Henschke 2005). Although the direct and evident
influence of nutrients may not be on phenolic concentration in grapes, Downey et al.
(2006) and Cohen & Kennedy (2010) demonstrated that nitrogen and potassium,
mainly nitrogen, of the three common macronutrients have attracted much research in
terms of their influence on grape berry phenolics.
In the literature to date, general trends between nitrogen and grape phenolics could be
hard to draw from the limited studies. First, as vines are perennial plants, the response
of vines to nitrogen application could take years, depending on the form of nitrogen
applied and the environmental conditions afterwards (Creasy & Creasy 2009).
11
amount retained in soil could be less than that applied (e.g. sandy soils retain less
nitrogen; nitrate being leached) (Creasy & Creasy 2009). Secondly, the difficulties in
measuring plant available nitrogen in soils, due to its ephemeral nature, also plays a
role (Creasy & Creasy 2009) although the nitrate form has been quantified in some
research (Perez-Alvarez et al. 2013). Thirdly, the mineralisation of nitrogen, which
means the process of converting organic nitrogen to inorganic nitrogen in the nitrogen
circle, adds available nitrogen to the soil. This process is influenced by temperature and
soil water content (Mengel 1996, Paul et al. 2003), which adds another level of
interference to the correlation between nitrogen applications and the profile of grape
phenolic families. Fourthly, the responses of vines to a nitrogen nutrient application is
influenced greatly by vine nitrogen status, as summarised by Bell & Henschke (2005). In
general, relations between nitrogen supply and phenolics in grapes are hard to draw,
other than the situation where vines high in nitrogen result in decreased phenolic
content, which was found by Keller et al. (1999), but this could be due to changes
made to fruit exposure and not nitrogen supply directly.
However, soil fertilisation history can be used to explain the data for which the other
factors cannot explain, regardless of the long ‘pathway’ between nutrient and
phenolics in the final wines (source-sink relationship and vine microclimate). A
one-vintage study reported a heavy clay soil resulted in a higher content of anthocyanins
and tannins in wines than those from gravel soils (Choné et al. 2001). This seems a
contradiction according to the effects of fine and coarse soil on phenolics (discussed in
the soil part of this review), but the lower nitrogen content in the clay soil, which gave
less vigour to the vine, compared to that in the gravel soil, could be one feasible
explanation. Recent research by Schreiner et al. (2014) found in Pinot noir that
supplying nitrogen to vines decreased the phenolic contents in grapes in various ways,
which added evidence for the circumstantial negative correlation between nitrogen
12
2.3.2 Heat summation
2.3.2.1 Flavan-3-ols (including proanthocyanidins)
Recent research has established that PAs accumulate from flowering to veraison (Bogs
et al. 2005). Heat summation during this period has been found to show a strong
positive relationship with the accumulation of PAs in grape skins and seeds, both in
vivo and in vitro (del Rio & Kennedy 2006, Cohen et al. 2008, 2012). Following veraison,
and up to harvest, tannin molecules experience a ‘maturation’ process. In general,
according to He et al. (2008), the details of ‘maturation’ remain unclear, including the
factors controlling tannin size. However, the mDP of either skin or seed PAs seems not
to be related to heat summation (del Rio & Kennedy 2006).
Cohen et al. (2008, 2012) controlled the temperature of a vineyard by forced-air
delivery, and reported a positive relationship between total PAs content in grape skins
on a per berry basis at veraison and heat summation during pre-veraison, although this
trend was only statistically significant in one of the three growing seasons. At harvest,
the cooled treatment resulted in significantly fewer PAs in skins. del Rio & Kennedy
(2006) also found the total concentration of PAs in skins of Pinot noir berries on a
berry weight basis at harvest was positively related to pre-veraison heat summation
across three vintages of the same vineyard.
del Rio & Kennedy (2006) found the concentration of seed PAs on a berry weight basis
at harvest was also positively related to heat summation before veraison across three
vintages. In contrast, Cohen et al. (2008) showed that neither pre-veraison nor
post-veraison heat summation showed statistically significant differences in either the
concentration or composition (subunits) of seed tannins. In contrast, the number of
seeds per berry, which influences the concentrations of tannins in wines, has been
reported to be positively related with pre-veraison heat summation (Ewart & Kliewer
1977, Ebadi et al. 1995, del Rio & Kennedy 2006), presumably as fertilisation was
13
In summary, several recent papers all found that pre-veraison heat summation tends
to promote PA accumulation; but for post-veraison heat summation, a general trend is
yet to be found.
2.3.2.2 Anthocyanins
Several studies supported a negative relationship between temperature and grape
anthocyanin levels (Kliewer & Torres 1972, Spayd et al. 2002, Mori et al. 2005, 2007).
Spayd et al. (2002) applied temperature treatments by air-blower and found a
consistently negative relationship between whole growing season heat summation and
total monomeric anthocyanin concentrations in grape skins in two consecutive
vintages. Under low temperature conditions, Yamane et al. (2006) observed the
enhanced accumulation of anthocyanin synthesis-related mRNA and a significant
higher concentration of abscisic acid (ABA), which has been known to increase
anthocyanin levels in berry skins (Jeong et al. 2004). At high temperatures, it is
suggested that lower anthocyanin levels were caused by the inhibition of mRNA
transcription, as well as the degradation of anthocyanins (Mori et al. 2007).
Furthermore, Mazza & Miniati (1993) reported that low accumulations of sugars under
high temperature also had an influence, as glucose is the required molecule for the
conversion from anthocyanidin to anthocyanin. However, the threshold temperature
for limiting anthocyanin production seems to differ between varieties. Kliewer & Torres
(1972) reported that a 35°C temperature during the day can inhibit the accumulation
of anthocyanins in Tokay completely, but not in Pinot noir.
When considered in a more general sense, in the context of studies comparing grapes
from different climatic regions, the general contribution of temperature to
anthocyanin levels in grapes or wines seems not to be evident. Two studies, both
conducted for three vintages in areas with different climates and located in a coastal
region of South Africa, showed inconsistent results (De Beer et al. 2006, Oberholster et
al. 2010). In the two vintages, neither study revealed any significant differences in total
anthocyanins of the resultant grapes (Oberholster et al. 2010) and wines (De Beer et
14
classified regions based on historical average February temperature, did these authors
report that the warmer region resulted in wines with lower concentrations of total
anthocyanins than the cooler regions (De Beer et al. 2006). In contrast, another study
showed the opposite finding that warmer areas produced more abundant total
anthocyanins in grapes than cooler areas (Oberholster et al. 2010). Tesic et al. (2002)
supported the positive relationship, as the growing degree days have been reported to
be linearly positively correlated (r2 = 0.61) to total anthocyanins in Cabernet Sauvignon
skins.
Contradictory results from general studies could be explained by the possible dual
effects of temperature on anthocyanins. Yamane et al. (2006) divided the post-veraison
development processes of grape berries into four stages, and exposed vines to 20°C
and 30°C throughout the day and night, respectively, during these different stages. At
harvest, the stage following the beginning of colouring was the most sensitive stage for
temperature, as anthocyanin concentration on a skin weight basis increased by more
than two-fold in the 20°C treatment than in the 30°C treatment. In contrast, the 30°C
treatment for the pre-veraison stage resulted in relatively higher concentration of
anthocyanins.
2.3.2.3 Flavonols
It seems that the concentrations of flavonols are predominantly determined by the
exposure of clusters to the sun, with little or no effect from temperature variations
(Price et al. 1995, Spayd et al. 2002). Spayd et al. (2002) reported that the
concentration of the three main glucosides of kaempferol, quercetin and myricetin,
were all dramatically higher in sun-exposed berries than in shaded berries at harvest;
while, for berries with exactly the same exposure and different temperature
treatments, the concentration differences were negligible. Price et al. (1995) also
reported that quercetin concentration in skins of exposed Pinot noir berries was ten
times more than in shaded berries, regardless of temperature variations between
shaded and exposed berries in their experiment. Even in the resultant wines, quercetin
15 berries.
2.3.3 Yield
2.3.3.1 Vine balance
As the vine is a perennial plant, in both a commercial and plant physiology sense, the
aim of grape growing is to produce a certain quantity and quality of grapes with no
reduction in vine vegetative growth over many years. Vines that achieved this aim can
be defined as balanced vines (Howell 2001). There are many methods to achieving this
balance, such as winter pruning, cluster thinning, canopy managements, application of
growth regulators, controlling soil nutrients and so on (Winkler 1974, Creasy & Creasy
2009).
Grapevines have a fixed capacity in a certain season, which means a vine can only
support the growth of a certain quantity of shoots and the ripening of a certain
number of berries. If the potential yield exceeds the vine’s cropping capacity, the first
effect is delayed maturity of berries. Further increases in crop yield will lead to low Brix
level in berries. These effects are related to partitioning of assimilates during the
growing season (Winkler 1974).
In the same vineyard, crop yield differences are mainly due to vintage, winter pruning
and cluster thinning practices, despite the influence of extreme weather and loss of
yield due to bird damage, etc. These factors potentially determine the partitioning of
assimilates during the coming growing season, which is supposed to alter phenolics in
grapes at harvest. The sections below discuss total and individual phenolics in the berry
at harvest.
2.3.3.2 Total phenolics
In general, total phenolics on a berry weight basis have been found to be negatively
16
2005, Hall et al. 2011). By using precision viticulture technology, the areas of vineyards
separated by low and high concentrations of total phenols in berries have been found
to inversely match well with those separated by low and high yields (Bramley 2005, Hall
et al. 2011). Mazza et al. (1999) even found that the removal of secondary clusters
could reveal this trend. This could be explained by assimilates being drawn more to the
primary crop. Cluster thinning at veraison increased total phenolic concentrations in
the skins on a berry weight basis around harvest in Pinot noir, Merlot, and Cabernet
Franc over two seasons. Reducing the crop during winter pruning by Bindon et al.
(2008) also revealed the same trend.
2.3.3.3 Flavan-3-ols (including proanthocyanidins)
It seems that the circumstantial observation of a generally negative relationship
between flavan-3-ols and crop yield can be support by research, although not always
(Choné et al. 2001, Esteban et al. 2001, Chapman et al. 2004, Holt et al. 2008, Bowen
et al. 2011). Without manipulating crop yield, Choné et al. (2001) found the natural
yield of grapes from four sites was negatively related to their must tannin
concentrations at harvest. Esteban et al. (2001) also found the tannin concentration at
harvest in grape skins on a berry weight basis, was significantly higher in vines with
fewer retained nodes for one vintage; however, this difference disappeared in the
following vintage. This may be due, to a great extent, to differences in yield during the
first vintage. Changes in tannin concentration do not guarantee the same effect on the
astringency of the resultant wine. Chapman et al. (2004) compared the effects of
pruning and cluster thinning at veraison on wine composition. The resultant wines
seemed more influenced by the earlier crop reduction as higher levels of bitterness
and astringency, induced by higher flavan-3-ols and tannins, were associated with vines
retaining fewer nodes. Earlier crop reduction by pruning changes the source-sink
relationship, so the leaf area and shoot lengths become less in the following season. In
contrast, cluster thinning at veraison did not necessarily change the leaf area. The
17
that case, could lead to higher concentrations of grape phenolics (Chapman et al.
2004).
However, there are always exceptions. Holt et al. (2008) found vines retaining 80 buds
resulted in higher tannin concentration, on a berry weight basis, across three vintages
than vines retaining 40 or 50 buds. This was possibly due to berry size, as the former
vines pruned by machine resulted in smaller berries than the latter hand-pruned vines.
As for the effects of cluster thinning, Bowen et al. (2011) did not find any trends
between skin or seed tannin concentrations and different crop yields in Merlot and
Cabernet Sauvignon over three vintages. Bowen et al. (2011) attributed this to seasonal
weather differences. Probably other factors except crop yield could also contribute
more to the variation of measured tannins at harvest. Alternatively, cluster thinning
regulates partitioning of assimilates later than winter pruning, hence, some assimilates
are discarded along with the thinning of clusters.
For low molecular weight flavan-3-ols, two studies reported a consistently negative
trend with berry yield (Peña-Neira et al. 2007, Zoran et al. 2010). (+)-Catechin and
procyanidin B1, were approximately four times higher in berry skins of low yield Syrah
(clusters were thinned to half at veraison) than those from high yield berry skins (8
t/ha) (Peña-Neira et al. 2007). Controlling yield by retaining eight, 16 and 24 nodes per
vine in Blaufränkisch also showed a negative relationship in terms of catechin
concentration of skins at harvest (Zoran et al. 2010). This benefits the colour of the
resultant wines through polymerisation between catechin and anthocyanins, as
discussed above.
2.3.3.4 Anthocyanins
When precision viticulture technology was used to compare the grapes from the same
vineyard over different seasons, a negative relationship existed in some studies
(Bramley 2005, Hall et al. 2011). Over two seasons, Hall et al. (2011) found the yield of
grapes at harvest was negatively correlated with total anthocyanins in the grapes.
18
and high yields and anthocyanin concentration in grapes, the yield zones and
anthocyanin concentration zones were inversely matched. However, Guidoni et al.
(2002) applied 50% cluster thinning for three consecutive years, and found
non-significant changes in grape anthocyanins on a berry weight basis in the first year, but
they were significantly more abundant in the thinned treatments in the following two
seasons, probably because responses of vines to crop adjustment may need more than
one vintage to be evident.
Some studies also found the differences in grape anthocyanin contents due to yield
were not carried into the wines. Petrie & Clingeleffer (2006) reported that a correlation
between yield and anthocyanins on a berry weight basis was significantly different
between each treatment, but in wines made from these grapes, differences in
anthocyanin concentration were not observed. King et al. (2012) showed that total
anthocyanins in the Hawke's Bay Merlot wines were not affected by a pre-veraison
crop removal experiment where 25% and 50% of all the clusters were removed.
Bramley & Hamilton (2004) separated a vineyard into low, medium, and high yield
zones by precision computer mapping, and found the low yield area produced the
highest concentration of total anthocyanins in wines, although the high yield area
produced slightly higher anthocyanin concentrations than the medium yield area. A
study on three different sites over two vintages by Koundouras et al. (2006) found
lower yield of berries at harvest consistently resulted in higher levels of total
anthocyanins in grapes in berry weight basis, and also higher colour intensity in
resultant wines. In their experiment, yield was limited by retaining 12 buds per vine.
2.3.3.5 Flavonols
A single-vintage study on Syrah found a negative trend between total flavonols and
yield of berries at harvest (Peña-Neira et al. 2007). This was an evident contrast, as the
comparison was between grapes from vines retained half of the total number of
clusters (thinned at veraison) and un-thinned control vines. In a study by Mazza et al.
(1999) which only thinned the secondary clusters at veraison, flavonols concentration
19
in the second experimental season, but did not differ in Merlot and Pinot noir due to
cluster thinning in the first season. Removing only the secondary clusters did not
impact on the yield of berries as significantly as that of randomly removing half of all
the clusters, and the removed secondary clusters were less advanced and they could
have fewer berries, so consumed fewer assimilates than the primary crop. This could
probably explain the difference in the latter study that started to appear in the second
season.
2.3.3.6 Non-flavonoids
Information in studies about the relations between yield and non-flavonoid phenolics is
rare. Mazza et al. (1999) reported a slight increase of tartaric acid esters (as caffeic acid
equivalents) in grape skins of cluster-thinned Cabernet Franc and Merlot, but not in
Pinot noir.
2.3.4 Soil and water
We hear of the conversion of water into wine at the marriage in Cana as of a miracle.
But this conversion is, through the goodness of God, made every day before our eyes.
Behold the rain which descends from heaven upon our vineyards; there it enters the
roots of the vines, to be changed into wine. - Benjamin Franklin, 1779
2.3.4.1 Overview
The connection between water and grape phenolics content is not direct. Water can
affect the phenolics content in grapes at harvest in four possible ways. The first three
effects are all related to the biosynthesis of phenolics, and the last effect, which is
indirect, occurs through vine growth. The first effect, is the influence of water on vine
vigour and any subsequent changes in the exposure of clusters that affects the cluster
20
phenolic synthesis (Creasy & Creasy 2009). Therefore, increasing vine vigour is likely to
decrease the phenolic concentration of grapes. The second effect is to alter the timing
of the ripening process, specifically, advancing phenology induced by water stress,
which improves the ripeness level of grapes (Kennedy et al. 2000, Castellarin et al.
2007). The third effect is elevated ABA levels in response to water stress, which
promotes the accumulation of anthocyanins (Deluc et al. 2009). The last effect is
altered berry size due to differences in available water, as demonstrated for vines in a
vineyard setting and potted vines (Esteban et al. 2001, Ojeda et al. 2002, Sivilotti et al.
2005, Castellarin et al. 2007, Olle et al. 2011). Hence, the concentrations of many
compounds in berries, on a berry weight basis, are modified. Reduction in berry weight
and size has been reported to be due to changed cell volume in berry pericarp from
water deficits, rather than cell numbers (Ojeda et al. 2002). This supports the
‘concentrating’ effect being brought on by water deficit, though this might also be
related with when the water stress is applied.
These effects of water on vines occur through the soil, which acts as a water reservoir
and determines the available water for vines. The role that soil plays in this case is
quantified as soil water holding capacity which, in other words, equals the field
capacity minus the permanent wilting point. Negative correlations between soil water
holding capacity and proanthocyanidin content in berries at harvest, concentrations of
tannins and pigmented polymers in wines, have been reported (Cortell et al. 2005). Soil
water status determines vine water status, which significantly alters vine vigour (Cortell
et al. 2005). Vine vigour and grape and wine phenolics have been widely reported to be
inversely related (Cortell et al. 2005, 2007a, Koundouras et al. 2006, de Andrés-de
Prado et al. 2007, Olle et al. 2011).
Many studies have suggested that it is the physical properties of soil which determines,
to a large extent, the water holding capacity of soil, which has a significant influence on
phenolics in grapes and wines. Specifically, shallow soil depths and coarse soil textures
are supposed to be the main parameters associated with low soil water holding
capacity, regardless of interference of soil structure, which is hard to measure (Jackson
2008). Besides, soil parent materials also affect water holding capacity, as a result of
21
of these studies also reported the detailed chemical composition of the vineyard soil,
but did not report any consistent relationships between these soil chemicals and the
composition of grapes (van Leeuwen et al. 2004, Cortell et al. 2005, 2007a, 2008,
Coipel et al. 2006, Koundouras et al. 2006, de Andrés-de Prado et al. 2007, Ubalde et
al. 2010, Imre et al. 2012). The section below reviews the research on the effects these
key soil parameters have on grape phenolics.
2.3.4.2 Soil depth
In general, the correlation between effective soil depth and grape or wine phenolics
has been found to be negative (Choné et al. 2001, Cortell et al. 2005, 2007b, Coipel et
al. 2006, Koundouras et al. 2006). Effective soil depth is defined as the depth from the
surface of the soil to the hardpan of the soil (Jackson 2008). Effective soil depth
provides space for vine rooting, and is sometimes associated with soil texture (e.g.
coarse fraction limits vine rooting). Moreover, soil depth to rock has also been used to
estimate soil water holding capacity (Cortell et al. 2005). For these reasons, vine
growth and vine vigour is affected, hence, the canopy development is changed, which
influences grape phenolics.
Choné et al. (2001) found the concentrations of anthocyanins and tannins in must and
wine, from four different sites, were weakly negatively correlated to the root zone
depths of 0.7, 1, 1.5 and 2 metres. Another study, using precision viticulture
techniques, found the areas within a site that were distinguished by soil depth using a
surface map were negatively matched with areas distinguished by the content of
proanthocyanidins in berries at harvest (Cortell et al. 2005), and also that of total
anthocyanins (Cortell et al. 2007a). Coipel et al. (2006) found a clear relationship
between soil depth and anthocyanins in grapes by PCA (Principal Component Analysis),
with high anthocyanin content being mostly found in berries originating from shallow
soils, with the reverse also being true. Koundouras et al. (2006) did a two-vintage study
in three non-irrigated vineyards, and found total phenolics were always significantly
higher in the resultant wines originating from the site classified as a having shallow soil
22
soils, despite differences in other soil parameters among sites like texture, geological
origin and nutrients.
Soil depth could also be related to the percentages of the five individual anthocyanins
in Pinot noir, through the soil depth vine vigour cluster exposure mechanism (Cortell et
al. 2007a). Higher peonin- and lower malvidin-glucosides levels were found both in
grapes and wines originating from the site with generally higher vigour, although no
significant difference was found in different vigour zones within either of the two sites.
Light exclusion in the site with lower vigour increased peonin approximately two times
compared with the exposed clusters (Cortell & Kennedy 2006).
However, this consistent relationship between soil depth and phenolics may
sometimes be coincidental (Bramley et al. 2011). A higher content of carbonate (CaCO3
equivalent) was found in a site with shallower soil, which makes it difficult to
distinguish individual contributions to the increasing phenolic content in grape berries
as carbonate has been demonstrated to restrict vine rooting through its salinity and
sodicity (Bramley et al. 2011).
Overall, the role of soil depth has been well researched and generally validated (Cortell
et al. 2005, Bodin & Morlat 2006, Morlat & Bodin 2006). Research has shown that the
relationship between soil depth and the resultant phenolics in grapes and wines are
more consistent than that of soil texture. This may be related to the balance between
the under- and above-ground part of vines (Creasy & Creasy 2009).
2.3.4.3 Soil texture
Soil texture refers primarily to the size and proportion of the mineral components of
soils (Jackson 2008). Clay, silt and sand are classified based on the weathering degree
of the parent materials. Clay is the finest while sand is the coarsest and silt lies in
between. Light soils means soils have a high proportion of sand, while heavy soils have
a high proportion of clay (Jackson 2008).
Generally, a significant coarse fraction in a soil shows a tendency to produce more
23
Prado et al. 2007, Ubalde et al. 2010, Imre et al. 2012). Ubalde et al. (2010) found high
gravel content greatly limited root development, mainly through reduced soil water
holding capacity, and resulted in wines with higher contents of total polyphenols
(measured as absorbance at 280 nm), tannins and anthocyanins. Sites with a higher
proportion of a coarse soil fraction resulted in wines with higher total phenolics and
higher colour intensity than wines from clay loam textured soil, and this trend was
consistent in two vintages in spite of one being a drought vintage (de Andrés-de Prado
et al. 2007). Specifically, wines from a sandy loam soil were more abundant in
anthocyanins, tannins and total phenols than that from a silt loam soil. A one-vintage
study on four sites reported that two sites, with 15% gravel content in the soil, resulted
in lower tannins and anthocyanins in must and wines than the other two sites, which
had 50% and 75% gravel content and resulted more abundant quantities of these
phenolics (van Leeuwen et al. 2004). Research in Otago on Pinot noir agreed with this
finding (Imre et al. 2012). Under the same irrigation stress, the site (Felton Road) with
lower total gravel content resulted in wines with slightly fewer total red pigments and
monomeric pigments than the site with more gravel (Mt Difficulty), and the colour
intensity was also lower.
However, the correlation between higher phenolic content in grapes or wines and
coarser soil texture has not always been observed (Choné et al. 2001, van Leeuwen et
al. 2004, Koundouras et al. 2006). Sites with 32% clay content in the first 50 cm of soil
resulted in the highest content of anthocyanins, total phenolics and tannins in wines,
followed by wines originating from soil with 14% clay and those with 38% clay,
respectively (Koundouras et al. 2006). In a five-vintage research project, gravel and clay
soils resulted in similar concentrations (on a g/kg berries basis) of grape skin
anthocyanins at harvest, while sandy soils resulted in significantly lower concentrations
of anthocyanins (van Leeuwen et al. 2004). The most obvious explanation is that the
vines in sandy soils have significantly higher vigour than either the vines in gravel or
clay soils, probably induced by the unlimited water supply in the sandy soil. A
one-vintage study reported a redoxisol with a heavy clay subsoil resulted in a higher content
of anthocyanins and tannins in wines than those from a neoluvisol on a gravel soil
24
content than the latter site. This seems to contradict other work on the effects of fine
and coarse soil on phenolics, but the lower nitrogen content in the clay soil might be an
explanation. Other research found no clear relationship between grape quality and soil
type, which included marl, deep colluvial soil, sandy soil, stony terraces and reworked
sandy marl soil (Coipel et al. 2006).
Overall, soil texture has been used to classify soils in research (Bodin & Morlat 2006)
and to estimate soil water holding capacity (Cortell et al. 2005). Therefore, it will be
necessary to take into account the influence of soil texture on Pinot noir wine
phenolics profiles. Researchers usually describe soil texture by presenting the
percentages of clay, silt and sand (Koundouras et al. 2006, Ubalde et al. 2010, Bramley
et al. 2011), and some research also presents the percentage of gravel content (Choné
et al. 2001, Imre et al. 2012).
2.3.4.4 Soil structure
Soil structure refers to the association of soil particles into complex aggregates (Jackson
2008). The binding of clay and humus, and its association with water, plant materials,
invertebrate materials, and so on, is the starting point of aggregate formation (Jackson
2008). Seguin (1986) demonstrated that soil structure plays an important role in terms
of soil porosity, which permits rapid water drainage. Clay-rich soils become porous with
the presence of humus, which could modulate pore size (Seguin 1986, Jackson 2008).
Although circumstantial, the influence of soil structure on phenolics in research may
still be difficult to reveal. In limited recent research, organic matter and organic carbon
in soils were interpreted as indicators of soil fertility, rather than soil structure (Choné
et al. 2001, de Andrés-de Prado et al. 2007). Several papers in this area have not taken
into account the effects of soil structure, which means no related information (organic
matter or structure of soils) has been presented in these papers (van Leeuwen et al.
25
2.3.4.5 Soil parent materials
When discussing the influence of parent materials on grapes, the different soils
derived from them are usually discussed (Shange & Conradie 2012a, 2012b). Three
basic rock types, igneous, metamorphic, and sedimentary, form the earth’s crust, and
each of these rocks is able to form various types of vineyard soils (Jackson 2008). For
example, granite derives from igneous rock, while shale, limestone and chalk originate
from sedimentary rock, and slate, schist and quartzite arise from metamorphic rock
(Jackson 2008). These different soils have been reported to affect grape composition
at harvest. Nitrogen in the juice of grapes from granite-derived soil was lower than
that from shale-derived soil (Shange & Conradie 2012a). The content of sugars and
acids in mature Chenin blanc grapes grown in three sites with different parental
materials were significantly different (Morlat & Bodin 2006).
For two reasons, it could be speculated that phenolics in grapes are influenced by
different types of parent materials. First, soil from different parent materials differs in
texture, nutrients and other parameters (Shange & Conradie 2012a). For example, soils
originating from shale have been reported to have less coarse sand and more fine sand
than those from granite, which influences water drainage. The former soil also has a
higher total potassium content (Shange & Conradie 2012a). Secondly, besides the type
of parent material, the level of weathering of the parent materials has been reported
as resulting in Cabernet berries of different anthocyanin content (in g/kg berries basis)
and total phenolics (Morlat & Bodin 2006). The site with weakly weathered rock
resulted in higher concentrations of these two compounds compared to that of
strongly weathered rock. Morlat & Bodin (2006) attributed this to the different water
holding capacity of these two soils, with weakly weathered rock soil was associated
with lower water holding capacity than strongly weathered rock soil.
In fact, the various types of soils and the different degrees of weathering are the result
of the interaction between parent materials and the climate of the area, which
influences the nutrients (e.g. the mineralisation of nitrogen) and water holding
capacity of the soil. Nutrients and water holding capacity of soil contribute to changes