http://www.sciencepublishinggroup.com/j/ijctc doi: 10.11648/j.ijctc.20190701.14
ISSN: 2376-7286 (Print); ISSN: 2376-7308 (Online)
Analysis of CI Engine Parameters with Used Temple Oil
Biodiesel Using Taguchi Method
Sharanabasappa Saddu
1, *, Sangshetty Kivade
2, Ramesha Devarahalli Kempe Gowda
31
VTU Belagavi, Karnataka, India 2
Mechanical Engineering, Basavakalyan Engineering College, Basavakalyan, Karnataka, India 3
Mechanical Engineering, UVCE, Bangalore University, Bangaluru, Karnataka, India
Email address:
*Corresponding author
To cite this article:
Sharanabasappa Saddu, Sangshetty Kivade, Ramesha Devarahalli Kempe Gowda. Analysis of CI Engine Parameters with Used Temple Oil Biodiesel Using Taguchi Method. International Journal of Computational and Theoretical Chemistry. Vol. 7, No. 1, 2019, pp. 22-27. doi: 10.11648/j.ijctc.20190701.14
Received: January17, 2019; Accepted: March2, 2019; Published: March 25, 2019
Abstract:
Today’s world is facing major environmental issue called global warming, the emissions of diesel fuel is one of the major source for the global warming and also for air pollution. The use of biodiesel can reduce diesel fuel consumption and emission of diesel engine, because biodiesel has been considered as a potential alternative fuel for CI (Compression Ignition) engines. Out of many biodiesel derived from various resources, present study deals with usage of Used Temple Oil have been considered as fuel for analysis. The transesterfication process was adopted to condition the raw oil to suit its properties. Properties are evaluated according ASTM standard and properties are found to be computable with diesel. The present work Used Temple Oil biodiesel bends are used to the run thesingle cylinder four strokes diesel engine at different injection opening pressure. To optimize thethree opening pressure, Taguchi method adopted. For forming orthogonal array the experiments have been designed using DOE in Minitab 18 and Taguchi’s L9 array is employed. For identifying the contribution of various factors which significantly affects the response followed by regression analysis to validate the results at optimum set of selected control factors. This study deals with optimal values of BTE and NOx emission. From the results it reveals that NOx reduction is maximum at 200 bar injection pressure, B30 methyl ester blend at 50% load.Keywords:
Injection Pressure, UTO Biodiesel, Taguchi Method, ANOVA, Performance Parameters1. Introduction
Various resources like non edible oil, animal fats and waste oil are the main sources of biodiesel. The best quality of all these sources is that, they all are renewable and do not influence any food security supply for human beings [1]. Biodiesel is considered as promising alternative fuel for CI engines, due to reduced smoke emission and with rich oxygen content. The 10% of oxygen content in biodiesel provides better combustion of fuel. To optimize operating and design variables of diesel engine for maximum Brake Thermal Efficiency, peak pressure, Temperature, IMEP, BMEP Taguchi method is used and improvement in above said parameters at optimal condition is reported [2]. Taguchi method is good to find optimal operating parameters for high
BTE and low BSFC, NOx and smoke [3]. In investigation process Taguchi method was used to optimize three parameters such as injection pressure, injection timing and blend proportion [4].
good agreement of additive blended castor biodiesel blends [6]. Optimization of Taguchi method predicted optimum level of parameters within a trial and the 40 eucalyptus blend seen satisfactorily working at optimum setting slighter more in emission of NOx was seen [7].
Forimplementing operating parameters and to obtain best results Taguchimethod is well known. It is amethod of statistical and mathematical collection to optimum system performance. To solve the different types of problems of industries, this method is oftenly used. One of the main benefit to use of this method is the reductionof cost and time compared to the full factorial design experimentation [8-9]. From Sesame oil, it was found that Taguchi method (L9 parameter design) given the optimize process of biodiesel production. The contribution factor is higher for molar ratio is 78.09% for ester recoveryin transestrification process [10]. Taguchi analysis proved that methanol to oil ratio has maximum effect followed by temperature reaction and catalyst concentration [11].
To identify the order of contribution of each parameter (Injection opening pressure, fuel injection timing and compression ratio) on BTHE, BSFC and emission, further they reported that confirmation test results were good agreement with predicted values. Taguchi method along with grey relational and ANOVA was able [11-13].
Sesame oil yield 97.27% biodiesel production process parameters optimized using Taguchi method L9 parameter design with a 8:1 molar ratio and 0.34 catalyst concentration at 55°C reaction temperature [14].
The Taguchi and ANOVA techniques are used to determine
the effect of experimental parameter and optimum level for load, injection pressure and blend percentage. And it identifies thatblend 40 of Jatrophacurcasmethyl ester at 25% of engine load and 220 bar injection pressure are the optimum parameters [15].
The single and combined effects of engine operating parameters on performance and characteristics of emission of the diesel engine employing Used Temple Oil bio diesel blend as fuel using approach in order to determine the optimal levels of load, biodiesel blend, injection pressure and optimal value of BTE, SFC, C, HC, NOx and smoke are the main objectives of this study.
2. Materials Method
The fuel used in this present study was Used Temple Oil Methyl Ester (UTOME). The Used temple Oil collected from Hanuman and Marikamba Temple Sirasi, Uttarkannada, Karnataka. Used Temple Oil free fatty acid (FFA) content was found to be below 2%. Therefore direct transesterification with alkali catalyst was performed.
The physical properties of UOME (Used Temple Methyl ester) at different blends are determined at Bangalore Test House (An ISO 9001 Certified and NABL accredited laboratory) according to IS 1448 (P6, P66, P25, P32, and P66) and were compared with fossil diesel fuel as shown in the Table 1. The Values of UTOME have almost same properties as that of the diesel fuel and shows it can be used as an alternate fuel.
Table 1. Physical properties of UTOME at differentblends.
Properties B20 B30 B40 B100
Density(kg/m3) 825 830 840 870
Kinematic Viscosity@ 40°C cSt 2.8 3.0 3.2 5.1
Flash point °C 54 58 60 164
Calorific Value (MJ/kg) 42.881 40.231 39.423 39.080
Fire point °C 57 60 65 167
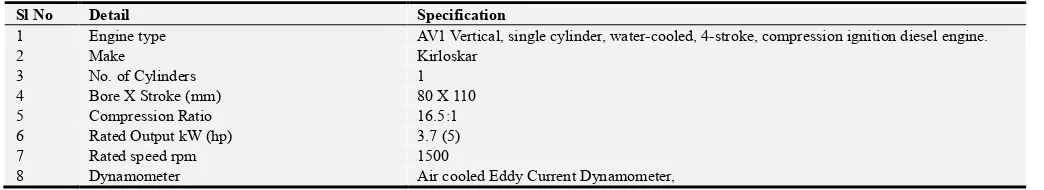
The experiments were carried out on AV1 Vertical, single cylinder, water cooled, 4-stroke, and compression ignition diesel engine was for the experiment. The technical specification of the engines is given in Table 2. Engine was operated at a constant speed of 1500 rpm. The load variation was done with the help of eddy current dynamometer.
Initially the engine was tested with local diesel then with different blends like 20% UTOME+80% diesel fuel (denoted B20), 30% UTOME+70% diesel fuel (denoted B30) and40% UTOME+60% diesel fuel (denoted B40) at different engine loads from 25% to 100% and at Injection Opening Pressure (IOP) of 180 bar, 200bar and 220 bar.
Table 2. Engine parameters.
Sl No Detail Specification
1 Engine type AV1 Vertical, single cylinder, water-cooled, 4-stroke, compression ignition diesel engine.
2 Make Kirloskar
3 No. of Cylinders 1
4 Bore X Stroke (mm) 80 X 110 5 Compression Ratio 16.5:1 6 Rated Output kW (hp) 3.7 (5)
7 Rated speed rpm 1500
8 Dynamometer Air cooled Eddy Current Dynamometer,
Taguchi orthogonal array method has been used for BTE and NOx for UTOME. Different parameters influencing the BTE and NOx of UTOME, the three most influencing
Table 3. Factor and Levels for BTE of UTOME.
Factors Level 1 Level 2 Level 3 IOP (bar) 180 200 220
Load (%) 50 75 100
Blend (%) 20 30 40
3. Results and Discussion
The adequacy and signification of the developed regression model was tested using Analysis of variance (ANOVA) method. In ANOVA factors with 95% is considered as significant. This provided information on relative influence of parameters and their interactions with respect to the various results. According to this analysis, the
most effective parameters with respect IOP (bar), Load (%) and Blend (%) are mentioned. The effects of the three chosen parameters at three different levels have been studied by conducting only nine experiments as per L9 orthogonal array for BTE shown in Table 4.
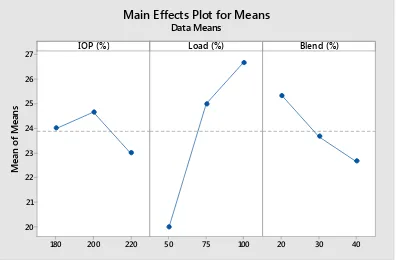
Response table for S/N ratio generated using Minitab software and for analysis purpose in Taguchi Design the condition “Larger is better” is selected. The effects of each parameter on BTE at three different levels are shown in Figure 1 and the Table 5 shows the Response table for Means of Brake Thermal Efficiency. The maximum value in each graph specifies the optimum level of that particular parameter on the BTE.
Figure 1. Main Effect Plot for Means for the effectof Each Parameter at different levels.
Table 4. L9 Orthogonal Array for Design of Experiments with Three Parameters at Three levels for BTE of UTOME.
IOP (bar) Load (%) Blend (%) BTE (%) S/N ratio
180 50 20 22 26.8484
180 75 30 25 27.9588
180 100 40 25 27.9588
200 50 30 20 26.0206
200 75 40 25 27.9588
200 100 20 29 29.2479
220 50 40 18 25.1054
220 75 20 25 27.9588
220 100 30 26 28.29947
The above Figure 1 shows that S/N ratio is maximum 24.67, 26.67 and 25.33 for 200 bar IOP, 100% load and 20% biodiesel blend respectively. And S/N ratio is minimum 23.00, 20.00 and 22.67 for 220 bar IOP, 50% load and 40% blend respectively.
Table 5. Response Table for Means of Brake Thermal Efficiency.
Level IOP (bar) Load (%) Blend (%)
1 24.00 20.00 25.33
2 24.67 25.00 23.67
3 23.00 26.67 22.67
Delta 1.67 6.67 2.67
Rank 3 1 2
In the Table 5, Delta is the difference from maximum value and minimum value of mean of means for a particular parameter. The highest difference suggests that particular parameter has a greater effect. From the table it can see that load has maximum effect after that biodiesel blend ratio and lastly IOP on BTE.
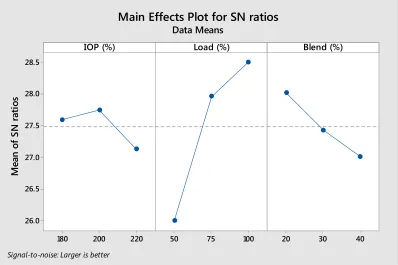
The Figure 2 shows the Main Effect Plot for S/N ratio for the effectof each Parameter at different levels and Table 6 shows Response Table for Signal to Noise Ratios for Larger is better.
220 200
180 27
26
25
24
23
22
21
20
100 75
50 20 30 40
IOP (%)
M
e
a
n
o
f
M
e
a
n
s
Load (%) Blend (%)
Figure 2. Main Effect Plot for SN ratios for the effect of Each Parameter at different levels.
The above Figure 2 shows that S/N ratio is maximum 27.74, 28.50 and 28.02 for 200 bar IOP, 100% load and 20% biodiesel blend respectively. And S/N ratio is minimum 27.12, 25.99 and 27.01 for 220 bar IOP, 50% load and 40% blend respectively.
Table 6. Response Table for Signal to Noise Ratios for Larger is better.
Level IOP (bar) Load (%) Blend (%)
1 27.59 25.99 28.02
2 27.74 27.96 27.43
3 27.12 28.50 27.01
Delta 0.62 2.51 1.01
Rank 3 1 2
In Table 6, Delta is the difference between the maximum value and the minimum value and rank denotes the maximum and minimum effect of the parameters. It shows that the effect of load is more, whereas the effect of IOP is less on BTE. The Regression Equation of BTE is as follows, BTE (%) = 22.89-0.0250 IOP (bar) + 0.1333 Load (%) – 0.1333 Blend (%).
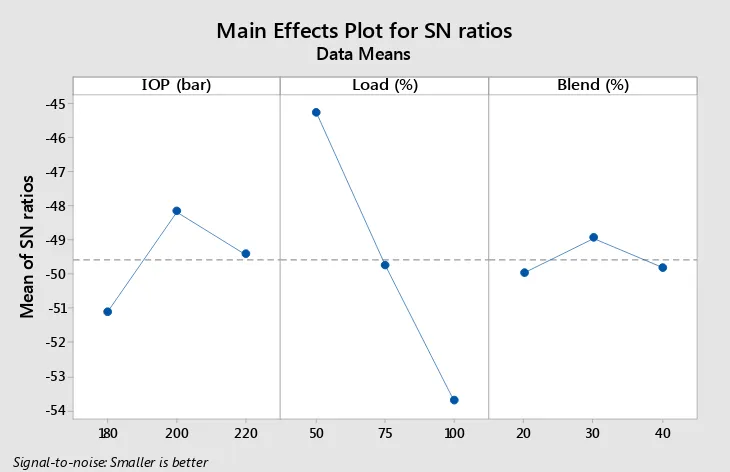
The S/N ratios and Mean values for NOx emission due to control parameters were computed using Minitab software and are presented in Table 7 and Figure 3. The S/N ratio of Smaller-is-Better option was chosen for the optimization of response parameter of NOx emission. The Table 8 shows Response table for Signal to Noise Ratios for smaller is better.
Table 7. L9 Orthogonal Array for Design of Experiments with Three Parameters at Three levels for NOx of UTOME.
IOP (bar) Load (%) Blend (%) NOx (ppm) S/N ratio
180 50 20 232 -47.3098
180 75 30 335 -50.5009
180 100 40 598 -55.534
200 50 30 145 -43.2274
200 75 40 272 -48.6914
200 100 20 425 -52.5678
220 50 40 182 -45.2014
220 75 20 316 -49.9937
220 100 30 450 -53.0643
It was noticed from the graphs of Signal-to-Noise ratio and the Mean that the NOx emission can be reduced to its lowest level when the test engine runs at 50% load condition with 200 bar IOP, when fueled with Blend 30% of UTOME.
Figure 5 shows the main Effect Plot for SN ratios for the effect of Each Parameter at different levels and Table 9 shows the Response table for Signal to Noise Ratios for smaller is better.
Table 8. Response Table for Signal to Noise Ratios for smaller is better.
Level IOP (bar) Load (%) Blend (%) 1 -55.11 -45.25 -49.96 2 -48.16 -49.73 -48.93 3 -49.42 -53.72 -49.81
Delta 1.90 9.93 0.70
Rank 2 1 3
220 200
180 28.5
28.0
27.5
27.0
26.5
26.0
100 75
50 20 30 40
IOP (%)
M
e
a
n
o
f
S
N
r
a
ti
o
s
Load (%) Blend (%)
Main Effects Plot for SN ratios
Data MeansFigure 3. Main Effect Plot for SN ratios for the effect of Each Parameter at different levels.
From the Figure 3 and Table 8, Delta is the difference between the maximum value and minimum value. Rank denotes the maximum and minimum effect of the parameters. It shows that the effect of load is more, whereas the effect of
blend is less compared IOP on NOx.
Figure 4 shows Main effect plot for Means for the effect of Each Parameter at different levels Table 9 shows Response Table for Means.
Figure 4. Main Effect Plot for Means for the effect of Each Parameter at different levels.
Table 9. Response Table for Means.
Level IOP (bar) Load (%) Blend (%)
1 388.3 186.3 324.3
2 280.7 307.7 310.0
3 316.0 491.0 350.7
Delta 107.7 304.7 40.7
Rank 2 1 3
The above Figure 4 shows that S/N ratio is maximum 388.3, 491.0 and 350.7 for 200 bar IOP, 100% load and 20% biodiesel blend respectively. And S/N ratio is minimum 280.7, 186.3 and 310.0 for 220 bar IOP, 50% load and 40% blend respectively. The Regression Equation for NOx (ppm) is = 194 - 1.81IOP (bar) + 6.093 Load (%) + 1.32 Blend (%).
220 200
180 -45
-46
-47
-48
-49
-50
-51
-52
-53
-54
100 75
50 20 30 40
IOP (bar)
M
e
a
n
o
f
S
N
r
a
ti
o
s
Load (%) Blend (%)
Main Effects Plot for SN ratios
Data Means
Signal-to-noise: Smaller is better
220 200
180 500
450
400
350
300
250
200
100 75
50 20 30 40
IOP (bar)
M
e
a
n
o
f
M
e
a
n
s
Load (%) Blend (%)
Main Effects Plot for Means
4. Conclusions
This study selected the optimum parameter for high percentage by varying parameters through Taguchi method. The Taguchi method was an accurate and one of the efficient methods of determining the optimum parameters for BTE and NOx of UTOME with an orthogonal array (L9) a total set nine experiments having three parameters each at three levels indicated. The contribution of each noise parameter estimated with the help of ANOVA. It shows that the effect of load is more, whereas the effect of IOP is less on BTE. The NOx emission can be reduced to its lowest level when the test engine runs at 50% load condition with 200 bar IOP, when fueled with Blend 30% of UTOME.
References
[1] L. E. I Zheng, L. U. Changbo, A. N. Gaojun, X. Chunhua, Z. Youjie, R. Lianling, W. Xudong, X. Lifeng, W. Gang, W, Feng, S. Limin, Procedia Engineering 84 (2014) 377-383
[2] T. Ganapathy, K. Murugesan, R. P. Gakkhar “Performance optimization of Jatropha biodiesel engine model using Taguchi approach, Applied Energy, Elsevier, 86 (2009) 2476-2486.
[3] Horng-Wen Wu, Zhan-Yi Wu “Using Taguchi method on combustion oncombustion performance of a Diesel engine with diesel/ biodiesel blend and port-inducting H2, Applied Energy, Elsevier, 104 (2013) 362-370.
[4] Karthikeyan R, Nallusamy N, Alagumoorthi N, et al “optimization of engine operating parameters for turpentine mixed diesel fueled di diesel engine using Taguchi method” Modern App Science, 4(12) (2010) 182-192.
[5] M. I. Masood, A. N. Shah, A. ASLAM, M. Gul, A. Naveed, M. Usman, “Combustion and Emission based Optimization of Turbocharged Diesel engine run on Biodiesel Using Grey Taguchi method “Technical Journal, University of Engineering and technology Taxila, Pakistan vol 20, No-III (2015).
[6] Vivek S Khachane, Amit G Bhuibhar, Dr J P Kaware,” Experimental Investigation on the Performance of the Diesel
Engine using different blends of the Castor oil “IOSR Journal of mechanical and Civil Engineering Vol- 3 (3) (2018) 88-96.
[7] Tamilvendhan D, Hangovan V and Karthikeyan R “Optimisation of Engine operating parameters for Eucalyptus oil mixed diesel fueled DI diesel engine Taguchi Method “Vol-6 (“Vol-6), (2011) 14-22.
[8] K. N. Krishamurthy, S. N. Sridhara, C. S. Ananda Kumar, “Synthesis and optimization of Hydnocarpus wightiana and dairy waste scum as feed stock for biodiesel production by using response surface methodology “Elsevier, Energy, 153 (2018) 1073-1086.
[9] ShivaKumar, PDinesha, “Optimization of engine parameters in a bio diesel engine run with honge methyl ester using response surface methodology”Measurement, 125 (2018) 224-231.
[10] Bhoopendra Pandey, S. S. Ragit and Satish Kumar “Optimization of biodiesel production from Sesamum indication oil by Taguchi’s Technique” 12, (2017) 255-265.
[11] RabiranjanMurmu, HarekrushnaSutar, SangramPatra, “Experimental Investigation and Process Optimization of Biodiesel production from Kusum oil using Taguchi method” Advance in Chemical Engineering and Science, 7 (2017) 464-476.
[12] M. I masood, A. N. Shah, A. Aslam, M. Gul, A. Naveed, M. Usman, “Combustion and emission based optimization of Turbo charged diesel engine run on Biodiesel using grey- Taguchi method “Technical Journal, UET, Texila, Pakistan, 2(III) (2015).
[13] Nandkishore D Rao, Dr. B. Sudheerpremkumar, Dr C. Srinath, Chandrashekar Patil, “Optimization of engine operting parameters” International Journal of Mechanical Engineering and Technology, Vol-5 (9) (2014) 1-7.
[14] BhoopendraPandey, s SRagit and Satishkumar“Optimization of biodiesel production from Sesamum indicum oil by Taguchi’s Technique” International journal of Applied agricultural research, 2 (2017) 255-265.