A TREE BASED MODEL FOR HIGH
PERFORMANCE CONCRETE MIX
DESIGN
C.DEEPA *
Department of MCA, GRGSACT PSGR Krishnammal College for Women,
Coimbatore, TamilNadu, India
K.SATHIYAKUMARI† Department of MCA, GRGSACT PSGR Krishnammal College for Women
Coimbatore, TamilNadu, India
V. PREAM SUDHA‡ Department of MCA, GRGSACT PSGR Krishnammal College for Women
Coimbatore, TamilNadu, India
Abstract:
Concrete is the sustainable construction material, which is most widely used in the world as it provides superior fire resistance, gains strength over time and gives an extremely long service life. Its annual consumption is estimated between 21 and 31 billion tones. The paper is aimed at guiding the selection of available materials and proportioning them as to produce the most economical concrete suitable for the desired purpose. According to the National Council for Cement and Building Materials (NCBM), New Delhi, the compressive strength of concrete is governed generally, by the water-cement ratio. The mineral admixtures like fly ash, ground granulated blast furnace, silica fume and fine aggregates also influence it. The main purpose of this paper is to find the accuracy for the compressive strength of high performance concrete by using classification algorithms like Multilayer Perceptron, Rnd tree models and C-RT regression. The result from this study suggests that tree based models perform remarkably well for designing the concrete mix.
Keywords: PLS-LDA, Multilayer Perceptron, Rnd Tree.
1. Introduction
Concrete is a more essential material in civil engineering. It is widely used for many kinds of structures. Day by day different structures have been designed and constructed. Earthquake is the most important obstacle to be overcome and taken into account by the experts. With the purpose of imitate performance of the structure, concrete compressive strength is required to be known. But it cannot be guessed easily due to its ingredients and processes. Therefore, the development of control methods to determine the condition and determine the quality of concrete is critical. The concrete compressive strength is a complex non-linear regression problem for construction engineering. It is highly difficult to predict the concrete strength due to non-linearity. Concrete testing is performed in order to determine whether specified strength requirements are met. The strength of concrete depends on the proportions of cement, fine and course aggregate and water.
Concrete compressive dataset has been collected from real time construction. The concrete data set have 300 instances that contain 8 attributes with one class attribute. Predicting the concrete compressive strength is most essential for construction of concrete and it provides the suggestion and controlling the quality. A number of approaches and functions contain proposed for predicting the concrete strength. Several data driven techniques like PLS-LDA Regression analysis, MLP (Multilayer Perceptron) and Rnd modal trees are used in this study. In
* M.Phil Research Scholar, PSGR Krishnammal College, Coimbatore, India
civil engineering problems these three techniques are applied in general. And, algorithm comparison has been carried out the strength of concrete for different environment.
A ready to use relationship between the strength of concrete and the properties of ingredients using PLS-LDA regression analysis, multilayer perceptron and Rnd Tree was established. These approaches are able to predicting the concrete compressive strength of hardened concrete, that’s based on the properties of the component and wet concrete, were harmonizing to the presented workability tests regularly carried out during concreting.
To predict high performance of concrete compressive strength using these algorithms and these three models all are having good Prediction accuracies. MLP’s accuracy is high when compared to other algorithms and Time taken to build the model for MLP is high when compared to other algorithms. Rnd tree had taken less time to build their models and also Rnd model’s Error rate is less than other two algorithms. When it compared to PLS-LDA Regression algorithm, and MLP algorithm, Rnd tree algorithm is much better than both algorithms. 1.1.Concrete
Concrete is a mixing the paste, fine aggregate and coarse aggregate. The paste, composed of cement and water, coats the surface of the fine and coarse aggregates. Through a chemical reaction called hydration, the paste hardens and gains strength to form the rock-like mass known as concrete.
Concrete is a more essential building material that can be delivered to the profession site in a plastic state. This quality makes attractive building material for concrete then it would be modeled to nearly any form or shape. Concrete provides a wide latitude in surface textures and colors and can be used to construct a wide variety of structures, such as highways and streets, bridges, dams, large buildings, airport runways, irrigation structures, breakwaters, piers and docks sidewalls, silos and farm buildings, homes, and even barges and ships.
Concrete mainly has two major components are cement paste and inert materials. The cement paste contains cement, water and air. The air may be in the form of naturally entrapped air voids otherwise intentionally entrained air bubbles. Next, inert materials that are normally composed of fine aggregate, which is known as sand, and coarse aggregate, which is known as gravel, crushed stone, or slag.
When cement is mixed with water, the mix of the cement reacts to form a cementing medium. In properly mixed concrete, each particle of sand and coarse aggregate is completely surrounded and coated by this paste, and all spaces between the particles are filled with it. As the cement paste sets and hardens, it binds the aggregates into a solid mass. Under normal conditions, concrete grows stronger as it grows older. The chemical reactions between cement and water that cause the paste to harden and bind the aggregates together require time. The reactions take place very rapidly at first and then more slowly over a long period of time.
1.2.Cement
Cement is a crystalline compound of calcium silicates and other calcium compounds having hydraulic properties” (Macfadyen, 2006).
Cement is a material that has adhesive and cohesive properties enabling it to bond mineral fragments into a solid mass. Cement consists of silicates and aluminates of lime made from limestone and clay (or shale) which is ground, blended, fused in a kiln and crushed to a powder. Cement chemically combines with water (hydration) to form a hardened mass. The usual hydraulic cement is known as Portland cement because of its resemblance when hardened to Portland stone found near Dorset, England. The name was originated in a patent obtained by Joseph ASP din of Leeds, England in 1824.
Typical Portland cements are mixtures of tricalcium silicate (3CaO • SiO2), tricalcium aluminates (3CaO • Al2O3), and dicalcium silicate (2CaO • SiO2), in varying proportions, together with small amounts of magnesium and iron compounds. Gypsum is often added to slow the hardening process. Cement
1.3.Water
Water is an important ingredient in concrete works. Concrete hardens and gains strength through a chemical reaction which requires water of hydration. However, a high content of impurities in the water affects or inhibits the hydration process resulting in weaker concrete. For this reason water sources should be approved before use. In general, there is really no need to test the water as long as it appears clean. All drinkable water should be approved for use in concreting without carrying out verification tests on it. Water that looks dirty (high turbidity) or hard, such as that often obtained from ground sources or wells, should be assessed. If the intended concrete structure is no larger than a small box culvert then an assessment through a trial concrete mix will suffice. The water source should be approved on condition that the concrete strength specifications are met.
The total solids in water = 100 x (mass of residue in grams/mass of water) 1.4.Fine Aggregate
Fine aggregate that is used in concrete includes river-sand, quarry-sand and other similar fine aggregate. While contributing to the strength of concrete, the fine fraction also acts as filler occupying the spaces between the coarse aggregate. Sand, the most abundantly occurring natural fine aggregate, is available in two main forms namely river-sand and pit-sand. River-sand is the most appropriate for use in concrete because it generally meets the grading requirements and it is also usually clean having been washed by water currents. Pit-sand is usually highly contaminated because it is usually deposited by run-off which tends to contain a lot of organic materials. Care should be taken when using pit-sand instead of river-sand for concrete works. However, pit-sand can be blended with river-sand in situations where the river-sand is too coarse. Gradation and level of contamination are the main parameters that are used for the approval of fine aggregate for use in concrete.
1.5.Coarse Aggregate
Since aggregate usually occupies about 75% of the total volume of concrete, its properties have a definite influence on behavior of hardened concrete. Not only does the strength of the aggregate affect the strength of the concrete, its properties also greatly affect durability (resistance to deterioration under freeze-thaw cycles). Since aggregate is less expensive than cement it is logical to try to use the largest percentage feasible. Hence aggregates are usually graded by size and a proper mix has specified percentages of both fine and coarse aggregates. Fine aggregate (sand) is any material passing through a No. 4 sieve. Coarse aggregate (gravel) is any material of larger size.
1.6.Compressive Strength
The compression test: the compression test shows the compressive strength of hardened concrete. The testing is done in a laboratory off-site. The only work done on-site is to make a concrete cylinder for the compression test. The strength is measured in Mega Pascal’s (MPa) and is commonly specified as a characteristic strength of concrete measured at 28 days after mixing. The compressive strength is a measure of the concrete’s ability to resist loads, which tend to crush it.
Most of the mathematical models used to study the behavior of concrete mixes consist of mathematical rules and expressions that capture relationship between components of concrete mixes. By the way, using mathematical models to take and describe experiences from experimental data of concrete mixes behaviors are most reliable, accurate, scientific, and applicable recommended methods. Mathematical models based on experimental data are called ‘‘free models”, and generally are in regression forms.
2. Data Set Used
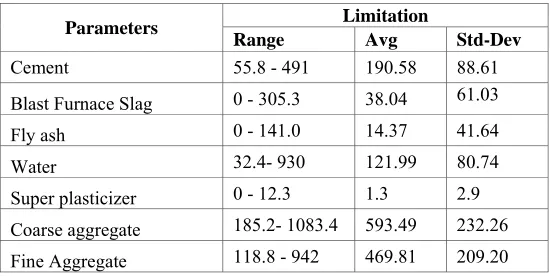
Utility based classification-modeling technique is used for prediction of the concrete compressive strength of high performance concrete. The real time data set consists of 300 data for high strength concrete, collected from a construction company. Cement, water content, fine aggregate ratio, fly ash replacement ratio, blast furnace slag, silica fume replacement ratio and super plasticizer were used as input parameters while compressive strength of concrete at all ages was used as output.
Table 1. Concrete Compressive Strength Real Time Data Set
Parameters Limitation
Range Avg Std-Dev
Cement 55.8 - 491 190.58 88.61
Blast Furnace Slag 0 - 305.3 38.04 61.03
Fly ash 0 - 141.0 14.37 41.64
Water 32.4- 930 121.99 80.74
Super plasticizer 0 - 12.3 1.3 2.9
Parameters Limitation
Range Avg Std-Dev
Age 1 - 365 49.75 70.96
Compressive strength 3.32 – 79.99 33.53 15.58
3. Experimental Setup
All standard paper Experiments were performed using the machine learning tool with default parameters for the base learners. The data mining method used to build the model is classification. The TANAGRA, Open Source, Portable, GUI-based workbench is a collection of state-of-the-art machine learning algorithms and data pre processing tools. The real time data set is consists of 300 instances with 9 different attributes. The instances in the dataset are pertaining to the attributes to represent the ingredient of concrete. The performance of the classifiers is evaluated and their results are analyzed.
In general, tenfold cross validation has been proved to be statistically good enough in evaluating the performance of the classifier. The 10-fold cross validation was performed to test the performance of the concrete compressive strength. The purpose of running multiple cross-validations is to obtain more reliable estimates of the risk measures.
In this software, to predict the concrete compressive strength PLS-LDA, Multilayer Perceptron and Rnd Tree model are the three classification algorithms used.
4. Modeling Approaches
All modeling approaches used for this study are briefly described below. 4.1.PLS-LDA
Partial Least Squares Linear Discriminant Analysis (PLS-LDA) performs PLS in conjunction with LDA. First, the SIMPLS algorithm is used to perform PLS and decompose the X matrix into a corresponding score matrix. Discriminant analysis is then performed on the score matrix. The decision theory for classification is based on an application of Bayes theorem. Each class density is modeled as a multivariate Gaussian distribution with a common covariance matrix across classes. Posterior probabilities for each class k are determined based on a training set. New observations are predicted based on the highest posterior probability. Fisher constructed a separate LDA algorithm which maximizes the between-class variability relative to a measure of the within-class variability. These two methods are identical when the prior probabilities are equal.
The function PLS-LDA proceeds as follows to predict the class of the observations from the test data set. First, the SIMPLS algorithm is run on Xtrain and Ytrain to determine the new PLS components based on the training observations only. The new PLS components are then computed for the test data set. Classification is performed by applying classical linear discriminant analysis (LDA) to the new components. Of course, the LDA classifier is built using the training observations only.
4.2.Multilayer Perceptron
A Multilayer Perceptron is a feed forward artificial neural network model that maps sets of input data onto a set of appropriate output. It uses a back propagation algorithm which is a standard algorithm for any supervised-learning pattern recognition process. The training of the perceptron is performed using an iterative method, where the weight and bias vectors are initialized, to ensure the classification of a new occurrence training sample is adjusted for every iteration,
For instance let x be a vector that the perceptron fails to classify, and wi, bi the vector of weight and bias
which corresponds to the ith iteration. Have the sign (wix+bn) ≠ c where c is the sign corresponding to the real class of the message that has the characteristic vector x. The new vectors wi+1 and bi+1 are calculated as follows:
wi+1 = wi + cx and bi+1 = bi + c
The training continues until the perceptron manages to classify correctly all the messages of the training sample. 4.3.Rnd Tree
Random tree, use with bagging for random forest, using solely this learning algorithm outside the aggregating framework.
If the number of cases in the training set is N, sample N cases at random - but with replacement, from the
original data. This sample will be the training set for growing the tree.
If there are M input variables, a number m<<M is specified such that at each node, m variables are selected at random out of the M and the best split on these m is used to split the node. The value of m is held constant during the forest growing. Each tree is grown to the largest extent possible. There is no pruning.
For many data sets, it produces a highly accurate classifier and it handles a very large number of input variables and estimates the importance of variables in determining classification that generates an internal unbiased estimate of the generalization error as the forest building progresses. It includes a good method for estimating missing data and maintains accuracy when a large proportion of the data are missing then it provides an experimental way to detect variable interactions. It can balance error in class population unbalanced data sets and to learn in fast way.
5. Prediction Accuracy
To evaluate the prediction accuracy of the different algorithms for the performance data, we used 10-fold cross validation. This technique consists of dividing the overall data in 10 disjoint subsets, or folds. Each algorithm is then trained using 9 of the subsets and evaluated using the tenth subset. The process is repeated 10 times and each time, a different subset is used for testing and the remaining 9 subsets are used to train the model. The algorithm is evaluated by averaging the prediction metrics from the 10 different models. Several prediction metrics can be employed and predict the accuracy for different algorithms.
Table 2. Compariosn of Algorithm Estimates
Classifiers Evaluation Criteria
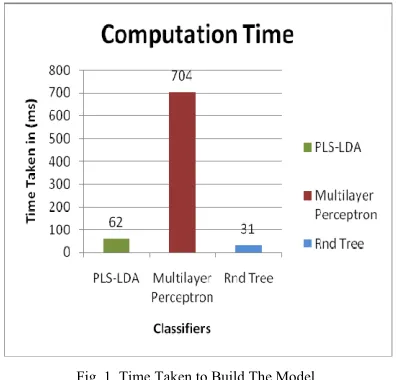
Time (ms) Error rate Accuracy
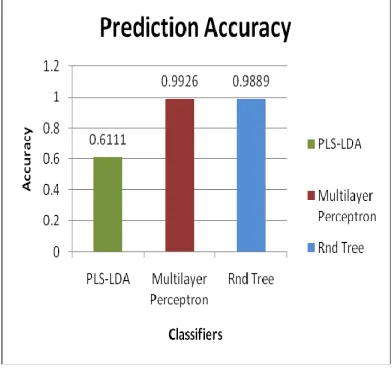
PLS-LDA 62 0.5699 61%
Multilayer Perceptron 704 0.4803 99%
Rnd Tree 31 0.0932 98.89%
The performance of the PLS-LDA Regression, MLP and Rnd tree techniques are given in table 2. The datasets were evaluated based on the three criteria namely, the prediction accuracy, learning time and error rate. The results of the experiments are given below:
In the above Fig 1, the time taken to build model is plotted in the shape of a bar graph and compared for various algorithms. Rnd tree take the least time(31 ms) and hence it is useful in time critical applications where the time required to build the model plays a significant role in its efficiency. MLP takes a long time of 704 ms to build the model for this dataset.
The Error rate is proportion of errors made over a whole set of instances and it measures the over all performance of the classifier. True Positives (TP) and True Negative(TN) are correct classifications. A false
positive (FP) occurs when the outcome is incorrectly predicted as yes when it is actually no. A false negative (FN) occurs when the outcome is incorrectly predicted as no when it is actually yes.
Error rate = Number of errors / Number of instances = (FN+FP) / N
From the above figure 2, it is clear that among all other algorithms Rnd Tree has the least amount of error rate.
The predictive accuracy for various algorithms is shown in the figure 3. From the above graph it is seen that both Rnd and MLP have the best predictive accuracy.
From these Fig (1,2,3), obtained it is clear that the PLS-LDA regression algorithm has very low accuracy and highest error rate when compared to other algorithms. In MLP technique accuracy is high but it takes long time to build their model. Rnd tree has pretty good accuracy, takes very less time and also has a low error rate .
Successful analysis and prediction should be always based on the use of various types of models. Different models, although in close accuracy, offer various advantages over each other. MLP approach gives results with good prediction and has an inbuilt flexibility for choosing any number of independent variables. But it requires non linear optimization with the possibility of converging only in local minima. PLS-LDA regression algorithm learns quickly but with more errors. Modal Trees have advantages in both compactness and prediction accuracy, attributable to the ability of modal trees to use the local linearity in the data. It is more understandable and allows one to build a family of models of varying complexity and accuracy.
Fig. 2. Error Rate for Different Classifiers
6. Conclusion
The performance of the models was evaluated based on their predictive accuracy, error rate and time taken to build the model. This paper discussed about the classifiers namely PLS-LDA, MLP and Rnd algorithms and found that MLP and Rnd have minimum difference in accuracy rate. With respect to error rate and time Rnd tree outperforms than MLP. Result with the data set suggest that Tree based modeling approach can effectively be used in predicting the compressive strength of high performance concrete.
7. Future Work
There are a number of potential avenues for further work. In the future, the work can be extended by applying different data mining techniques on a specific type of concrete. An in-depth evaluation of why different algorithms exhibit different classification accuracy and computational performance can be performed. Investigating the robustness of ML classification and a comparison between ML and non-ML techniques on an identical dataset would also be valuable.
References
[1] Yogesh Aggarwal, “Modeling of Reinforcement in Concrete Beams Using Machine Learning Tools”, World Academy of Science, Engineering and Technology 32, 2007.Albert, R.; Jeong, H.; Barab´asi, A.-L. (1999): Diameter of the world-wide Web. Nature, 401, pp. 130–131.
[2] S.M. Gupta, “Support Vector Machines based Modelling of Concrete Strength”, World Academy of Science, Engineering and Technology 36, 2007.
[3] Vahid. K. Alilou & Mohammad. Teshnehlab, “Prediction of 28-day compressive strength of concrete on the third day using artificial neural networks” International journal of Engineering, Vol (3) , 565-575.
[4] Serkan Subasi, “Prediction of mechanical properties of cement containing class C fly ash by using artificial neural network and regression technique”, Academic Journals Vol.4 940 pp.289-297 April 2009.
[5] Noorzaei J., Hakim S.J.S., Jaafar M.S., Thanoon W.A.M. “Predicting the compressive strength and slump of high strength concrete using neural network”, International Journal of Engineering and Technology, Vol. 4, No. 2, 2007, pp. 141-153
[6] H. Witten and E. Frank, Data Mining: ractical Machine Learning Tools and Techniques with Java Implementation. Morgan Kaufmann Publisher, 2000
[7] L. Breiman, J. Friedman, R. Olshen, and C. Stone. Classification and Regression Trees. Wadsworth International Group, 1984. [8] Y.Wang and I.Witten. Inducing model trees for continuous classes. In Proceedings of the 9th European Conf. on Machine Learning,
Poster Papers, 1997.
[9] R. Quinlan. Learning with continuous classes. In Proceedings of the 5th Australian Joint Conference on Artificial Intelligence (AI’92), 1992.
[10] Jong In Kim, Doo Kie Kim, “Application of neural networks for Estimation of Concrete Strength’, KSCE Journal of Civil Engineering, 6(4): 429-438, 2002.
[11] Rishi. Garge. “Concrete Mix Design using Artificial Neural Network”, m.sc Thesis, Thapar Institute of Engineering and Technology, June 2003.
[12] I-Cheng Yeh. “Design of High-Performance Concrete Mixture Using Neural Networks and Nonlinear Programming”. Journal of Computing in Civil Engineering, Vol. 13, No. 1, January, 1999.
[13] Sergio Lai and Mauro Serra. ” Concrete strength prediction by means of neural network”, Constntction and Building Materials, Vol. 11, No. 2, 1997 pp. 93-98.
[14] R. Kohavi. A study of cross-validation and bootstrap for accuracy estimation and model selection. In Proceedings of 14th International Joint Conference on Artificial Intelligence, 1995.