Shelve in Computer Hardware/General User level: Beginning–Advanced
Energy Effi cient Servers
Energy Efficient Servers: Blueprints for Data Center Optimization introduces engineers and IT professionals to the power management technologies and techniques used in energy efficient servers. The book details the different power management features used in today’s processors, memory, interconnects, I/O devices, and other platform components. It examines the role firmware and software play in initializing and controlling these features, and shares strategies for improving data center performance. Using examples from cloud, HPC, and enterprise environments, the book teaches readers how to monitor, analyze, and optimize their server infrastructure and shares optimization techniques used by data center administrators and system optimization experts at the world’s most advanced data centers.
What you’ll learn:
• Boost your knowledge of power management features and options in modern
servers—from data center and systems software to low-level processor technologies
• Improve your understanding of the power management technologies used in
cores, caches, memory, system agents, processor interconnects, and PCIe
• Learn techniques for monitoring and characterizing server power management
technologies and their impact on component- and system-level activities
• Develop strategies that help improve infrastructure utilization and
cost-effectiveness, guide configuration and purchasing decisions, and enhance application deployment
• Learn to reduce server energy consumption without compromising
service-level software requirements, data center infrastructure, and the needs of end users
Who this book is for:
Primarily: Engineers and IT professionals. More broadly, the book appeals to anyone who designs or relies on a server to run services and applications, from software engineers, to system administrators, to equipment and system manufacturers, to data center operators.
Gough
Steiner
Saunders
For your convenience Apress has placed some of the front
matter material after the index. Please use the Bookmarks
Contents at a Glance
About the Authors ����������������������������������������������������������������������������
�xv
About the Technical Reviewers ������������������������������������������������������
xvii
Contributing Authors �����������������������������������������������������������������������
xix
Acknowledgments ���������������������������������������������������������������������������
xxi
Chapter 1: Why Data Center Efficiency Matters
■
�����������������������������
1
Chapter 2: CPU Power Management
■
���������������������������������������������
21
Chapter 3: Memory and I/O Power Management
■
��������������������������
71
Chapter 4: Platform Power Management
■
�������������������������������������
93
Chapter 5: BIOS and Management Firmware
■
�����������������������������
153
Chapter 6: Operating Systems
■
����������������������������������������������������
173
Chapter 7: Monitoring
■
�����������������������������������������������������������������
209
Chapter 8: Characterization and Optimization
■
���������������������������
269
Chapter 9: Data Center Management
■
������������������������������������������
307
Appendix A: Technology and Terms
■
��������������������������������������������
319
Why Data Center Efficiency
Matters
Data centers are the information factories that shape our modern experience. When we access online information ranging from reading our personal email and the news to engaging in commerce, using social media, and consuming entertainment, we are depending on data centers, which provide the computational backbone for the Internet. They create many of the movies we watch, design the cars we drive, and optimize the airplanes we fly. They are used to make scientific discoveries, to find oil, and to predict the spread of disease. Data centers are at the heart of the digital economy.
In 2010, about 30 million servers were in operation worldwide,1 and the number has
been increasing annually. The growth of the Internet of Things2 is expected to increase
the number of connected devices to over 25 billion by 2020. Other factors driving growth
include the continued “dematerialization” of goods,3 the growth of the worldwide
economy,4 and the increased expectation that our lives are connected to one another
through computing technology.
From the perspective of overall energy use, centralized data center–based computing in modern facilities is highly efficient. Recently Facebook estimated that the energy used to sustain an average account for a month is about equal to the energy used to make
a cup of coffee.5 eBay’s published data center energy use6 shows that the amount of
carbon produced per transaction is about 50 times lower than the carbon produced in
a short drive to the store to complete the same purchase.7 One recent study found that
1Jonathan G. Koomey, Growth in Data Center Electricity Use 2005 TO 2010 (Oakland, CA: Analytics Press, 2011), http://analyticspress.com/datacenters.html. 2See www.gartner.com/newsroom/id/2636073.
3See http://gigaom.com/2010/04/29/greennet-the-dematerialization-opportunity/. 4See, for example, John M. Jordan, Information, Technology and Innovation: Resources for Growth
in a Connected World (New York: Wiley, 2012). 5See www.facebook.com/green/app_439663542812831. 6See http://tech.ebay.com/dashboard.
7See
online purchasing of music uses 40%–80% less energy than any of multiple methods for delivering music by CD, even though that calculation used an upper bound estimate for
the electricity intensity of Internet data transfers.8
It’s somewhat ironic that a principal driver of efficiency in data centers, namely scale, also attracts the most attention to the energy use by data centers. Large-scale data
centers can share more resources; for instance, in the case of N + 1 redundancy of critical
infrastructure systems such as air handlers or power back-up systems,9 the incremental
penalty decreases as size, and therefore N, increases. However, because of their scale,
data centers also require large amounts of electrical energy to operate. Typical large-scale data centers require tens of megawatts of electrical power—enough power to sustain a small city. It is in part this high localized energy use that attracts attention to data centers—they are large and visible buildings that consume a lot of energy. As a result,
they can attract the scrutiny of both social activists,10 neighbors,11 and legislators.12
An Industry’s Call to Action
It was the convergence of two unrelated events that brought attention to data center energy use. The first was the growth in scale of data centers and the Internet. By one estimate, the number of adults logging onto the Internet increased by 37% from 2000 to 2004. The other trend was the growth of computing performance primarily through clock speed and
efficiencies increases.13 The result of both growing numbers of data centers and growing
power use by the servers (driven by numbers of servers, only marginally by power use per server) within the data center was explosive growth in the power consumed by the data center. Although overstated, claims of “economic meltdown” of the data center certainly
grabbed attention.14
In response to rising public awareness of data center energy use, Congress
commissioned a 2007 analysis of US data center energy consumption.15 The work,
completed in 2007 by Lawrence Berkeley National Laboratory using a “bottoms-up” methodology, estimated that data centers were consuming about 1.5% of US electrical energy. Even more alarming, by 2006, data center energy use had doubled since the year 2000 and was on track to almost double again over the following five years.
8Christopher Weber, Jonathan G. Koomey, and Scott Matthews, “The Energy and Climate Change Impacts of Different Music Delivery Methods,” Journal of Industrial Ecology 14, no. 5 (October 2010): 754–769, http://dx.doi.org/10.1111/j.1530-9290.2010.00269.x. 9See www.lifelinedatacenters.com/data-center/ups-configuration-redundancy/. 10See
www.greenbiz.com/blog/2011/12/15/facebook-ends-greenpeace-campaign-major-green-commitments.
11See http://news.idg.no/cw/art.cfm?id=7C75C477-1A64-67EA-E4F528FE768FA524. 12See
www.whitehouse.gov/blog/2014/09/30/better-buildings-challenge-expands-take-data-centers/.
13See Jonathan G. Koomey, Stephen Berard, Marla Sanchez, and Henry Wong, “Implications of Historical Trends in the Electrical Efficiency of Computing,” IEEE Annals of the History of Computing 33, no. 3 (July–September 2011): 46–54, http://doi.ieeecomputersociety. org/10.1109/MAHC.2010.28.
14Ken Brill, “The Economic Meltdown of Moore’s Law and the Green Data Center,” (2007)
www.usenix.org/legacy/event/lisa07/tech/brill_talk.pdf.
The report flagged the concern that without concerted effort within the data center industry to improve efficiency, the growth of energy consumption risked becoming unsupportable with implications not only for the industries directly affected, but for the economy itself.
The report highlighted some opportunities to improve efficiency and painted several achievable scenarios. Among areas identified for improvement with the biggest impact were data center infrastructure efficiency and the IT equipment inside the data centers. Although the efficiency of the IT equipment in data centers, and specifically the servers, is the focus of this book, it is worthwhile to discuss some of the progress that has been made in improving the efficiency of the infrastructure of data centers.
Data Center Infrastructure Energy Use
The infrastructure energy use of data centers, meaning the energy used to provide clean, reliable, uninterrupted power to the IT equipment and also to remove the waste heat generated by the equipment, is an important part of the overall energy use by data centers. In many cases, the infrastructure can consume a substantial portion of
the overall energy use of the data center. Figure 1-1 shows the power consumption of a
data center, divided into infrastructure (of non-IT power) and the IT equipment power consumption. Since non-IT power does not contribute directly to information processing, it is considered to contribute to the inefficiency of the data center.
Input Power
Total Data Center Power
Non-IT Power
UPS
Servers Network Storage Security Appliances
Etc.
Etc. Chillers
CRACs CRAHs Lighting Switch Gear
IT Power
Figure 1-1. The power consumption of a data center
Since the infrastructure exists only to provide support to the IT equipment by maintaining acceptable environmental factors and ensuring clean uninterrupted power delivery, it is considered to be an overhead power usage. On the other hand, the IT equipment is contributing directly to the information processing, and hence is directly
The accepted metric for infrastructure efficiency is the power usage effectiveness (PUE), defined as the ratio of the total energy use by the data center to that of the energy used by the IT equipment.
PUE Total DataCenter EnergyUse IT Equipment EnergyUse
=
Typical enterprise data centers that were designed to now outdated computer room
building standards typically would have had a PUE in the range of two to three.16 That
means that for one watt of power used to run the computer, one to two watts of power are used to supply power and provide cooling for the IT equipment. By modern standards,
this is highly inefficient. Figure 1-2 illustrates the inverse relationship between data center
infrastructure and PUE. For PUE = 2.0, 50% of the power in the data center is used for non-computational purposes. Some highly inefficient data centers can operate at a PUE > 3. As PUE increases above 2.0, over 50% of the data center power is used for heating, cooling, and power conditioning.
Figure 1-2. The fraction of total data center power used by data center infrastructure as a function of the PUE
Through work done by industry groups like the Green Grid,17 standard methods
to improve infrastructure efficiency have been defined and implemented across the industry. These have resulted in dramatic improvements in the PUE values of state-of-the-art data centers.
A commonly discussed potential weakness of PUE as a metric of data center efficiency is that the very inefficiencies PUE addresses, those of moving air for cooling and conditioning electrical power for delivery, also exist within the server (and thus the IT equipment) itself. Although this is true, the incentive to improve the server by optimizing its energy efficiency lies with the system manufacturer (as will be discussed later in this chapter). PUE provides a metric the designer and operator of the data center facility can use to optimize what is within their control. It is for this reason PUE has been such a successful driver of overall data center efficiency.
16Victor Avelar, Dan Azevedo, Alan French, eds., “PUE: A Comprehensive Examination of the Metric,” White Paper #49 (2013), www.thegreengrid.org/~/media/WhitePapers/WP49-PUE%20 A%20Comprehensive%20Examination%20of%20the%20Metric_v6.pdf?lang=en
Purpose-built mega data centers—like those of Yahoo!, Facebook, and Google—are
heavily reliant upon free-air cooling.18 Typical PUE values in these data centers are about 1.1,
meaning of the energy being consumed by the data center, only 10% is being used for non-compute-related tasks. Other, more conventional recently constructed data centers have PUE values near 1.4, meaning about 40% of the energy used by the data center goes to support infrastructure. The reasons these values are higher than the purpose-built mega data centers has to do with specific architectural choices, such as cooling design, as well as requirements for equipment redundancy to meet business-specific resiliency goals.
Although new data center construction typically follows industry best practices for efficient design, improving the efficiency of older, legacy data centers remains a persistent problem. There are several root causes of this. One of these is the rapid evolution of data center technology. For instance, as recently as 2011, ASHRAE approved new building
standards that encourage higher operating temperatures in many types of data center.19
Typically higher operating temperatures have been reported to reduce infrastructure
energy use by up to 4% per degree Celsius,20 a substantial savings.21
Data centers have been operated between 68 and 72 F, mostly for historical reasons. Cooling requirements in older IT equipment and mainframe computers were less well
understood and placed heavy reliance on room cooling because of their scale and size.22
A room-sized computer demands room sized cooling. With the migration toward the current generation of servers, the cooling requirements of the servers have changed, but room specifications have been slow to follow.
Although the higher temperature set point can be adjusted in older buildings, air flow management systems may not be designed or optimized to mitigate localized hot spots in the data center. Unless hot spots are carefully managed, this can lead to increased risk for service availability unless the architecture is substantially changed. Since data center buildings are typically depreciated on a 10- to 20-year schedule, it’s not entirely surprising that the timescale for the majority of data centers to catch up with current best practices, let alone match future advances, is on the order of years. At this point, much of the technical innovation for improved data center infrastructure is completed or known, and it is simply a matter of time for current practice to catch up with best practices.
Energy Proportional Server Efficiency
Nearly simultaneously with the report to the US Congress on data center energy consumption, an influential paper published by Luiz André Barroso and Urs Hölzle
of Google23 introduced the concept of energy proportional computing. Computing
efficiency depends on both the computational work output of the server as well as the energy consumed by the server. The key insight of the energy proportional model was
18See www.google.com/green/efficiency/datacenters.
19Thermal Guidelines for Data Processing Environments, 3rd ed. (ASHRAE, 2012).
20See
www.datacenterknowledge.com/archives/2007/09/24/data-center-cooling-set-points-debated/.
21More careful studies of this savings appear to be warranted.
22See
the realization that bringing server efficiency closer to the theoretical maximum at all workload conditions would improve overall data center efficiency. By ensuring server energy use scaled proportionally to workload, the efficiency of the servers is optimized
over a wider range of utilization, as shown in Figure 1-3. The figure on the left shows the
power consumption of a server (ca. 2006) whose idle power is 70% of the peak power. Because power consumption does not scale with workload, the efficiency is far below peak at most operating conditions. The figure on the right shows a server with idle power which is 20% of peak. In this case the efficiency is much higher at all utilization points.
Figure 1-3. The power consumption and efficiency of two model servers
Most servers in 2007 consumed almost the same power at 0% utilization (i.e., doing no computations) as they consumed at 100% utilization (i.e., doing the maximum workload or computations per second). For instance, one of the earliest systems reported on the
SPECPower benchmark had an idle power of approximately 70% of its peak power.24 This is
of concern because, in this case, the power consumption is not proportional to workload; efficiency can be far below the peak efficiency of the server. Indeed, servers often spend much of the time at low utilization. “Energy proportional” scaling of energy use ensures that these servers will operate at high energy efficiency even at lower workload utilization.
Regulatory Environment
A significant outcome of the report to Congress was a focused effort by the Environmental
Protection Agency’s Energy Star program to create a standard for energy efficiency.25
Since, at the time, the art of understanding and measuring server efficiency was nascent, initial efforts focused on measuring server idle power. As discussed earlier, idle power can be a good proxy for energy proportionality so long as server performance is also taken into account.
24See
http://spec.org/power_ssj2008/results/res2007q4/power_ssj2008-20071129-00017.html.
It’s a common pitfall to equate energy efficiency uniquely with low power. Server idle power, while correlating in some cases to higher efficiency servers, cannot by itself be counted on as a reliable indicator of efficiency. The reason for this is that efficiency correlates to both server energy use and server performance. A computer with low performance will take relatively longer to complete a given amount of work, which can offset any benefits of reduced power.
The current Energy Star standard focuses broadly on energy efficiency, including efficient power supplies, capability to measure and monitor power usage, efficient
components, and advanced power management features.26
In addition to the United States, several other countries have taken steps to encourage or even require certain levels of energy efficiency in servers. Among these are
the European Union,27 Australia,28 and China. In some cases, energy efficiency restrictions
are required due to a lack of necessary electrical grid capacity, whereas with other cases,
the standards fit with a framework of reducing carbon footprint.29
A summary of international regulatory implications for server design is shown in
Figure 1-4. Although server idle power is a common focus, approaches differ depending
on location. This can be problematic since requirements for one (e.g., overall energy consumption) may not be consistent with another (e.g., computing energy efficiency). Server energy efficiency standards and regulations can focus on different aspects of energy efficiency. The Energy Star program focuses on idle power and component efficiency. It is planning to shift toward measures of energy efficiency.
Figure 1-4. Server energy efficiency standards and regulations
26See www.energystar.gov/products/specs/enterprise_servers_specification_
version_2_0_pd.
27See www.powerint.com/en/green-room/agencies/ec-eup-eco-directive.
28See www.energyrating.gov.au/wp-content/uploads/Energy_Rating_Documents/Product_
Profiles/Other/Data_Centres/200905-data-centre-efficiency.pdf. 29Seewww.digitaleurope.org/DocumentDownload.aspx?Command=Core_
Efficient power supplies are important for overall server efficiency since any losses in the power supply are overhead for any energy uses ultimately for computation. In the
2006 timeframe, power supplies had efficiencies that were as low as 50%.30 Low-efficiency
power suppliers are cheap to produce, and since customers didn’t demand higher efficiency, there was no incentive by the server manufacturer to improve efficiency. But the opportunity is enormous. With the adoption of 80 Plus power supply efficiency guidelines by the EPA for Energy Star in 2007, power supply efficiency rapidly improved. Current power supplies, to be Energy Star–compliant, are required to have efficiencies of 89% at 50% load and a power factor of 0.9. Comparing this to an efficiency of 50%, the power consumption of a server would be reduced 35% for a fixed load.
Measuring Energy Efficiency
It is a common pitfall to associate energy efficiency with low power. Efficiency generally associates a level of output for an amount of input. In the case of computing, the output associated with efficiency measurements is the number of computational cycles completed. Therefore, although low power can definitely contribute to energy efficiency, it is insufficient without adequate performance.
Several metrics are for measuring energy efficiency of servers, but two of the most common are SPECPower_ssj2008 and HPC Linpack. SPECPower was developed by the Standard Performance Evaluation Corporation (SPEC) in 2008 for the express purpose of measuring server energy efficiency. Linpack is a high-performance computing
benchmark made up of a collection of Fortran subroutines.31 It is used as a measure of
energy efficiency on the Green50032 listing of supercomputing energy efficiency.
SPECPower
SPECPower measures the efficiency of a single server using a graduated workload. The workload is graduated in increments of 10% of a measured maximum or 100% server workload performance. SPECPower is based on server-side Java, which has the advantage that measurements can be implemented with a single client set-up. Thus it is economical to operate.
An example output of published SPECPower measurement is shown in Figure 1-5.33
Performance to power ratios are measured at an established set of points. The quantity
ssj ops_
å
powerå
is an accepted indicator of overall system energy efficiency. As of this writing (March 2015), measurement of over 480 systems have been published. The utility of published SPECPower data is very high since it separates the assessment of power and performance across what is all the “load line” from 0 to 100% of maximum workload.
30See http://en.wikipedia.org/wiki/80_Plus. 31See www.top500.org/project/linpack/. 32See www.green500.org/.
33See
Figure 1-5. A sample of a SPECPower published result. The table emphasizes both workload performance and energy efficiency
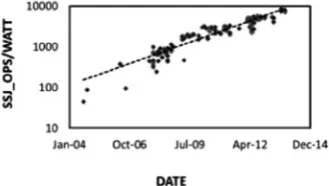
The data published for SPECPower has shown a strong trend of improvement in the energy efficiency of servers. Although SPECPower is not measured for a large variety of servers, it is representative of the capability of servers whose power management is
properly configured. Figure 1-6 shows a plot of the energy efficiency of all dual socket
servers with Intel Xeon processors as a function of the “hardware available” data for the system. The data show that the energy efficiency of the servers are increasing exponentially (note the logarithmic scale), doubling approximately every 1.6 years. That means that in the 7 years since 2007 when the benchmark was published, energy efficiency has increase by about a factor of 20.
Figure 1-6. Dual-socket server energy efficiency, as measured by SPECPower, Intel-Xeon based systems versus their “hardware available” date. Note the logarithmic scale, indicating an exponential trend
Figure 1-7. Trend of both the ratio of idle to maximum power and the performance for all published two-socket Intel Xeon–based servers
To understand this, we can look at the details of the SPECPower data shown in
Figure 1-7. The figure shows the trend of both the ratio of idle to maximum power and
the performance for all published two-socket Intel Xeon–based servers at SPEC.org for the SPECPower_ssj2008 benchmark. Both trends emphasize the growing importance of energy-proportional behavior of servers in improving energy efficiency. The ratio of idle to max power is a metric for the proportionality of the server. SPECPower reports carry a wealth of information about the server, including CPU and memory configuration.
The historical trend of energy proportional efficiency can be visualized in another way—by examining the “load line” of respective generations of servers as measured by SPECPower. The load line is simply a graph of the server power versus the absolute workload. From the graph, the power, efficiency, and performance of the server can
be deduced. Figure 1-8 shows the selected graphs from platforms built from specific
generations of processor families. The horizontal axis measures computations work up to a measured system performance limit. The vertical axis measures system power. Over time, according to this specific benchmark, system performance has increased while system power has decreased.
How do you read the graph? System workload is plotted along the x-axis (from active idle to a load point of 100% system capacity) and system power is plotted along the y-axis. The curves for each server follow an intuitive progression; as system workload increases, power usage increases. The degree of that increase is related to the proportionality of the system. Note that higher performance is to the right, lower power is down, and therefore higher efficiency is to the lower right. Note also, work output capability is measured in
server-side Jave operations per second or ssj_ops, which is a measure of system performance. What’s first evident from the graph is the higher peak performance in each
successive generation. There is a gain in “peak” energy efficiency inherent with performance increases in the systems (more “work”). This is the progression known colloquially as Moore’s Law. Note that the peak power of these systems is relatively constant at about 250 watts.
However, the graph reveals an additional progression toward lower power at low utilization, that is, toward delivering even higher gains in energy efficiency at actual data center workloads via “energy proportionality.” Assuming each system is run at the mid-load point, the average power dropped from a little over 200 watts in 2006 to about 120 watts in 2012. That’s a net power reduction of about 40% and, assuming $0.10/kWh energy costs and a PUE of 2.0, an operational cost saving of about $150/year. In addition, the work output capability (measured in ssj_ops) at that load point increases over a factor of 10.
The families of curves reveal several interesting trends. The first notable trend is the steady decrease in idle power of the systems. You’ll notice the curves fall into sets of pairs. At a high level, this is because managing idle power of a server is primarily related to the microarchitecture. Indeed optimizing the features of the microarchitecture to achieve the right balance of power and performance capability is a main subject of this book.
You’ll also note the steady increase in performance with each generation. These performance increases have two origins. In the years 2006, 2009, and 2012, new
microarchitectures were introduced. In intervening years new process technologies were
introduced (Intel’s “tick-tock” model34) giving rise to lower power and also substantially
increased performance. Table 1-1 lists the evolution of energy-efficient servers derived
from both process technology and microarchitectural revolutions. Development of new architecture and new silicon process technologies represent huge investments in capital and engineering. The highlights emphasize the tick-tock development cycles of staggered process technology and architecture.
34See
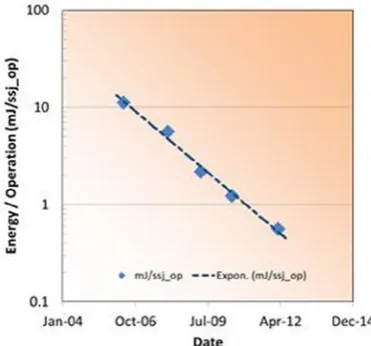
It is also instructive to look at the reduction in the energy per operation as deduced
from the SPECPower data. The energy reduction is easily visualized in Figure 1-9 as the
area of the rectangle defined by the average power and the time per ssj_op. Each data
point is labeled for correspondence to Figure 1-8. The time per ssj_op is calculated as
the reciprocal of measured ssj_ops at 10% utilization on the SPECPower trend curves in Figure 1-8.
Figure 1-9. A representation of the energy per ssj_op as measured by SPECPowerssj_2008 showing the role of both reducing the time and the power consumed while doing a computation. Both have been important in reducing overall energy consumption Table 1-1. The Evolution of Energy-Efficient Servers
Year
Microarchitecture Family
Process Technology
Processor Family
2006 Core 45 nm Xeon 5100
2008 Core 32 nm Xeon 5400
2009 Nehalem 32 nm Xeon 5500
2010 Nehalem 22 nm Xeon 5600
2012 Sandy Bridge 22 nm Xeon E5
What is interesting is the stair-step pattern shown in Figure 1-10—the trend of the energy per operation as a function of time shows a 41% per year reduction. From 2006 to 2008 we moved from 65 nm to 45 nm silicon technology, and from 2009 to 2010 from 45 nm to 32 nm silicon technology. In each case, the time to complete an operation decreased by about half. Complementing that, from 2008 to 2009, and from 2010 to 2012, were significant microarchitecture changes. These resulted in time reductions associated with performance gains, but also significant power reductions. Overall, both power and time reductions contributed to the gains in efficiency.
Figure 1-10. The SPECPowerssj_2008 trend of the energy per operation as a function of time shows an exponential trend that is consistent with an efficiency-doubling time of 0.9 years. This is much faster than the 1.5 years reported by Koomey, owing to additional efficiency gains from energy proportionality
Plotting the data as a time series versus the “system available” date from the SPECpower data shows the expected exponential trend. The fit parameters equate to a 41% per year reduction in the energy per operation and about a factor of 20 over the range shown. Putting the energy needed for computation into perspective, 0.5 milli-Joules is the energy needed to light a 100-watt bulb for about 5 microseconds.
High Performance Computing Efficiency
High Performance Computing (HPC) is another area where a trend of computing efficiency has been established by well-accepted methods. The Green500 list has, since 2007, published a semi-annual list of the top energy-efficient super computers in
the world.35 The Green500 shares the same workload as the Top500 supercomputing
performance list.36 Both are based on HP Linpack, which derives from a collection of
Fortran linear algebra routines written in Fortran in the 1970s. Excellent source material
on the Linkpack routines can be found online.37
Alternative benchmarks have appeared, such as the Graph500,38 which are
more relevant to measuring performance of supercomputers running data-intensive applications. Arguably with the growth of “big data” applications to continue into the future, these kinds of benchmarks will be relevant to a broader range of supercomputing applications. However, at this writing, the alternatives are just getting going and have not yet gained the same recognition as have the Top500 and Green500 lists. As a result, this discussion will focus on the historical trends of the Green500 and Top500 lists.
At the scale of supercomputers today, performance leadership is practically inseparable from efficiency leadership due to the practical constraint of power. The power consumption of the largest supercomputers in the world is now between 10 and 20 megawatts. Although these limits are not written in stone, at an estimated infrastructure cost of about $10 per watt, the cost of expanding beyond those limits is prohibitive except for the largest governmental and private agencies. With the expanded role of supercomputing in everything from office scale DNA decoding to field-based geophysics,
the need for higher performance in fixed-power environments is increasing.39
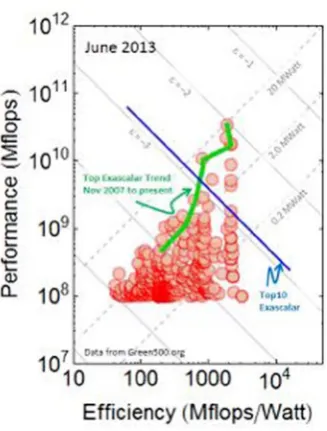
Since both performance and efficiency are important to supercomputing leadership, it is convenient to look at both the efficiency and performance of
supercomputers simultaneously. The Exascalar method does exactly this, plotting the
points from the Green500 list by their performance and efficiency.40 Figure 1-11 shows
the efficiency and performance of the computers in the Top500 supercomputer list since 2007. The historical trend line reveals that the performance gains of the top systems have been due to both efficiency gains and increases in power. Exascalar measures progress of
supercomputing leadership toward a goal of 1018 flops (an Exaflop) in a power envelope
of 20 megawatts. As is evident in Figure 1-11, the points fall roughly into a triangular
shape with a taxonomy that reflects the state of the art in computing performance and efficiency and also cost.
35See www.green500.org/. 36See www.top500.org/.
37See www.top500.org/project/linpack/. 38See www.graph500.org/.
39See
www.intel.com/content/www/us/en/research/tomorrow-project/intel-labs-dna-sequencing-and-bio-chem-sensing-video.html.
40See
The Exascalar values in this graph are computed from the formula where both efficiency and performance are normalized to the goal of one Exaflop in a 20 megawatt power envelope.
e = æ
è
ç ö
ø
1
2Log 1018 20 1018
Efficiency
Flops MWatt
Performance Flops ÷÷
The factor of 2 ensures consistency with an earlier (but more complex and less
generalizable) formulation of Exacalar.41
The earlier-mentioned triangular shape comes about because of the constraints of power in general application. Although the trend in increased power is evident from the trend line of the top Exascalar systems, that increase, about a factor to ten, also increases the installation costs by roughly a factor of ten and therefore represents a major barrier
for a majority of adopters.42 Another point to note in the graph is that systems in the
lower left-hand corner consume almost 100 times the power of the systems in the lower right-hand corner of the triangle, but deliver the same performance. This represents a potentially very large difference in total cost of ownership (TCO).
41Balaji Subramaniam, Winston Saunders, Tom Scogland, Wu-chun Feng, “Trends in Energy-Efficient Computing: A Perspective from the Green500,” Proceedings of the 4th International Green Computing Conference (Arlington, VA, June 2013).
42www.datacenterknowledge.com/archives/2013/01/28/the-taxonomy-of-exascalar/.
The trend of the Exascalar can also be plotted as a time series as shown in Figure 1-12. The top Exascalar system trend intersects the Exaflop equivalent of Exascalar (e = 0) some time in the year 2019. The median Exascalar trend is increasing at a slower rate, which can be accounted for by the slower increase in power (but similar gains in efficiency) of the general population. The differential between the top and median Exascalar growth is accounted for by the increased power levels of the top systems.
Figure 1-12. The trend of the top and median Exascalar as a function of publication date
Comparing theSPECPowerssj_2008 results with the Exascalar results shows the challenge of trending energy use and efficiency with benchmarks. In the case of SPECPowerssj_2008, the overall system power has decreased over time to benefit efficiency, while in the case of the HPC benchmarks, overall system power has increased over time to achieve higher performance.
Energy Efficiency and Cost
Energy efficiency is a highly desirable characteristic in data centers, but the overall goal of a data center is to meet the computational needs within both physical and financial constraints of the organization. These constraints are usually captured in a TCO model, which takes into account both capital and operational costs of the data center
43Vasileios Kontorinis, et al., “Managing Distributed UPS Energy for Effective Power Capping in Data Centers,” International Symposium on Computer Architecture, ISCA (2012), http://cseweb. ucsd.edu/~tullsen/DCmodeling.html.
TCO generally depends very strongly on the specific applications or intended use of the data center. This is a reflection of the wide range of applications for data centers. For instance, in some locations, the high costs of energy may favor the choice of a particular power envelope for the servers or, in some other cases, software licensing costs may strongly influence hardware choices.
However, outside these special cases, some general observations can be made about TCO.
Costs fall into two categories: capital costs and ongoing operational costs. The capital costs are associated with the the facility of the data center itself as well as the servers and other IT gear required to make the data center operate. Important operational costs include electricity, water, maintenance, and so on. Other factors, such as expected depreciation for both the facility and IT hardware, may also have a pronounced effect on the outcome of the model.
Many TCO models are available online. Some are made available for cost; some are
available as a service.43 These models have varying degrees of sophistication depending
on the desired fidelity and tolerance for error.
Table 1-2 lists the ranges of parameters for a TCO model. The operational server
energy cost includes overhead of PUE = 2.0. In both cases, the energy cost to run the servers in a data center is comparable to the facility cost itself.
Table 1-2. Ranges of Parameters for a TCO Model
Low Cost Range
(U.S.)
High Cost Range
(U.S.)
Facility capital cost per watt $8–$12 $20–$40
Facility capital depreciation 10 years 20 years
Facility capital cost/watt/year $0.80–$1.20 $1.0–$2.0
Electricity cost per watt $0.03/kWh $0.15/kWh
PUE 1.2 2.0
Operational server energy cost/watt/year
$0.31 $2.62
More sophisticated models take into account much more detailed analysis of individual data center costs, building upon and also substantiating the simpler analysis
in Table 1-2.44 In the model shown in Figure 1-13, power and cooling infrastructure costs
are about equivalent to the utility energy costs. Although energy costs and facility capital costs represent about equal parts of the TCO, server depreciation is also an important contributor.
Figure 1-13. An example of a breakdown of data center TCO
However, traditional data center TCO models do not consider the cost of work output from the data center per se; they simply treat the servers as power-consuming units without regard for energy efficiency or performance of their computing capability. What is astonishing is that from a work output standpoint, the most wasteful energy consumers in data centers (even low PUE data centers) can be inefficient servers.
To illustrate this point, consider Figure 1-14, taken from an actual assessment
of a Fortune100 company’s data center. The analysis consisted of looking at the age distribution of the servers and then assessing, based on their configuration, energy consumption and finally their work output (or performance) capability. Although older servers were only 32% of the population, they consumed the majority of energy and only contributed a small fraction of the total computational output of the data center.
Since server efficiency doubles approximately every one to two years (depending on application and the specific metric used), older servers are far less efficient and constitute a larger fraction of energy use for a lower fraction of computing cycles.
Figure 1-14. Data from a walkthrough inventory of a Fortune 100 company showing the energy consumption and age distribution of servers
In this particular data center, servers older than 2007 consume 60% of the energy but contribute only an estimated 4% of the compute capability. Although this may seem counterintuitive, consider the argument from the perspective of Moore’s Law; if the performance doubles approximately every two years, servers from 2006 do approximately
1/8th the computational work of servers dating from 2012, when the data was collected.
Given the power consumption date presented earlier, it is also feasible that the energy consumption would decrease in newer servers, dependent on configuration.
Summary
In this chapter we have reviewed the performance and efficiency trends of data centers and have shown that the servers can contribute to the overall energy use in data centers, especially in cases where the efficiency of the infrastructure has been optimized.
We’ve compared the performance and efficiency trends of servers based on both the SPECPowerssj_2008 and the derived Exascalar benchmarks. In both cases, the efficiency of servers has improved exponentially over time, though with differing trends, depending on the specific workload.
CPU Power Management
The CPUs and memory inside of a data center consume a fraction of the overall power, but their efficiency and built-in power management capabilities are one of the biggest influences on data center efficiency. Saving power inside of the CPU has multiplicative savings at larger scales. Saving 1 watt of power at the CPU can easily turn into 1.5 watts of savings due to power delivery efficiency losses inside the server, and up to 3 watts in the data center. Reducing CPU power reduces the cooling costs, since less heat must be removed from the overall system.
Before discussing how power is saved in the CPU, we will first review some basics of CPU architecture and how power is consumed inside of circuits. Then we will discuss the methods and algorithms for saving power inside of both memory and the CPU.
Chapters 7 and 8 will investigate how to monitor and control these features.
Server CPU Architecture/Design
Over the years, server CPU core design has significantly evolved to provide high performance and energy-efficient execution of workloads. However, no core is complete without an effective support system to provide the core with the data it needs to execute. Caches, main memory, and hard drives provide a hierarchical mechanism for storing data with varied capacity, bandwidth, and latency tradeoffs. In more recent years, highly scalable interconnects have been developed inside CPUs in order to facilitate the scaling of the number of cores.
different sweet spots. For example, many high performance computing (HPC) workloads are very sensitive to scaling and cross-node communication. These communication networks can be very expensive and hence contribute significantly to data center TCO. In such systems, it is desirable to maximize per node performance in order to reduce the communication subsystem costs and dependency. On the other hand, a cold storage
deployment1—where a large number of hard drives hold data that is very infrequently
accessed over a connection with much lower bandwidth—may require much lower CPU performance in order to suit the needs of the end user.
CPU Architecture Building Blocks
Typical multi-core server CPUs follow a common high-level architecture in order to efficiently provide compute agents with the data that they require. The main components of a modern CPU are the cores that perform the computation, I/O for sending and receiving the data that is required for the computation, memory controllers, and support infrastructure allowing these other pieces to efficiently communicate with each other.
Figure 2-1 shows an example of such a system. The boxes with a dashed outline are
optionally included on the CPU Silicon die, whereas the others are now almost always
integrated into the same die as the cores. Table 2-1 provides some high-level definitions
for the primary CPU components.
Fabric
PCIe
Memory Controller
L3 Cache InterconnectCoherent Core
L1 $$
L2 $$
Core L1 $$
L2 $$
… L1 $$Core
L2 $$
Chipset
Figure 2-1. A typical server CPU architecture block diagram
Threads, Cores, and Modules
Traditional server CPUs, such as those found in Intel’s Xeon E5 systems, are built using general purpose cores optimized to provide good performance across a wide range of workloads. However, achieving highest performance across a wide range of workloads has associated costs. As a result, more specialized cores are also possible. Some cores, for example, may sacrifice floating point performance in order to reduce area and cost. Others may add substantial vector throughput while sacrificing the ability to handle complex control flow.
Individual cores can support multiple hardware threads of execution. These are also
known as logical processors. This technique has multiple names, including simultaneous
multithreading (SMT) and Hyper-Threading Technology (HT). These technologies were introduced in Intel CPUs in 2002. SMT attempts to take advantage of the fact that a single thread of execution on a core does not, on many workloads, make use of all the resources
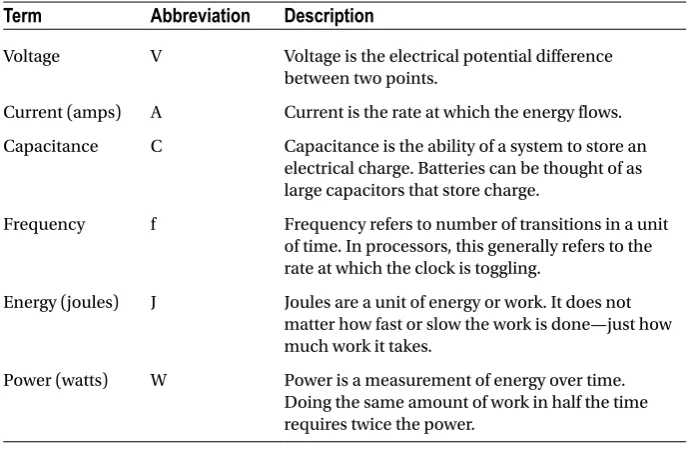
Table 2-1. Primary CPU Components
Component
Description
Core Cores are the compute agents of a CPU. These can include general
purpose cores as well as more targeted cores such as general-purpose computing on graphics processing units (GPGPUs). Cores take software programs and execute them through loads, stores, arithmetic, and control flow (branches).
Cache Caches save frequently used data so that the cores do not need to
go all the way to main memory to fetch the data that they need. A cache hierarchy provides multiple levels of caches, with lower levels being quick to access with smaller sizes, and higher levels being slower to access but providing much higher capacity. Caches are typically on the same die as the cores, but this is not strictly required (particularly with large caches).
On-die fabric Interconnects exist on the CPU dies that are commonly called
on-die or on-chip fabrics. These are not to be confused with fabrics that connect multiple CPU dies together at the data center level.
Memory controller Memory controllers provide an interface to main memory
(DDR in many recent processor generations).
PCIe PCIe provides a mechanism to connect external devices such as
network cards into the CPU.
Chipset The chipset can be thought of as a support entity to the CPU.
In addition to supporting the boot process, it can also provide additional capabilities such as PCIe, hard drive access,
available in the core. This is particularly true when a thread is stalled for some reason (such as when it is waiting for a response from memory). Running multiple threads on a given core can reduce the per thread performance while increasing the overall throughput. SMT is typically a very power-efficient technique. The additional throughput and performance can increase the overall power draw, but the wall power increase is small compared to the potential performance upside.
Note
■
there are two types of threads: hardware threads and software threads. operating
systems manage a large number of software threads and perform context switches to pick
which software thread is active on a given hardware thread at a given point in time.
Intel Atom processors also have the concept of CPU modules. In these processors, two cores share a large L2 cache. The modules interface with the CPU fabric rather than the cores interfacing directly.
The terms threads and processors are commonly used to mean different things in
hardware and software contexts. Different terms can be used to refer to the same things
(see Table 2-2). This frequently leads to confusion.
Table 2-2. Threads, Core, and Processor Terminology
Term
Description
Hardware thread Hardware threads, logical processors, and logical cores are all
the same. Each can execute a single software thread at a given point in time.
Logical processor
Logical core
Hardware core Hardware cores and physical cores represent a block of
hardware that has the ability to execute applications. A single physical core can support multiple logical cores if it supports SMT. Logical cores that share a physical core share many of the hardware resources of that core (caches, arithmetic units, etc.). Physical core
Software thread A software thread is a sequence of software instructions. Many
Caches and the Cache Hierarchy
Server CPU cores typically consume a large percentage of the processor power and also make up a large percentage of the CPU area. These cores consume data as part of their execution. If starved for data, they can stall while waiting for data in order to execute an instruction, which is bad for both performance and power efficiency. Caches attempt to store frequently used data so that the core execution units can quickly access it to reduce these stalls.
Caches are typically built using SRAM cells. It is not uncommon for caches to consume as much area on the CPU as the cores. However, their contribution to power is much smaller since only a small percentage of the transistors toggle at any given time.
A range of cache hierarchies is possible. Figure 2-2 shows two examples of cache
hierarchies. The figure on the left illustrates the cache hierarchy used on Xeon processors
since the Nehalem2 generation and the figure on the right illustrates the hierarchy used
on the Avoton3 generation. Different hierarchies have various performance tradeoffs and
can also impact power management decisions. For example, the large L3 cache outside the cores in the design on the left may require the application of power management algorithms in order to achieve good power efficiency.
Core L1D L1I
Core L1D L1I
L2
Module
Core L1D
L2 L1I Core L1D
L2 L1I
Core L1D
L2 L1I
Core L1D
L2 L1I Shared L3
Core L1D L1I
Core L1D L1I
L2
Module
Fabric
Figure 2-2. Cache hierarchy examples
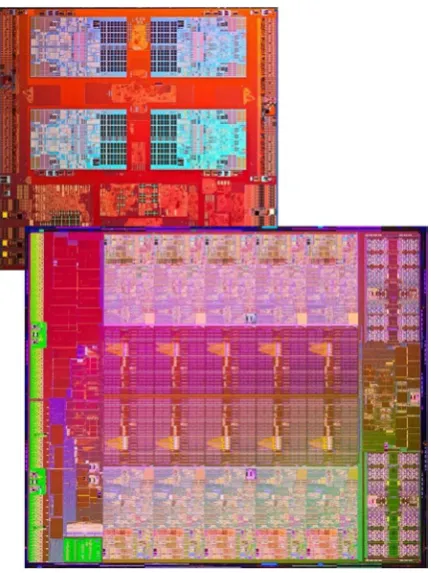
Dies and Packages
CPUs are manufactured wafers of monocrystalline silicon. During manufacturing, each wafer is printed with a large number of rectangular CPU dies that are subsequently cut from the wafer once the manufacturing is complete. A moderately large server die is on
the order of ~20 mm on a side (~400 mm2). Figure 2-3 shows two magnified dies, one from
the 8c Avoton SoC (system on a chip) and another from the Ivy Bridge 10c. The Avoton die is actually much smaller in size than the Xeon.
Figure 2-3. Die photos of the 8c Atom Avoton (top) and 10c Xeon Ivy Bridge EP (bottom) (not to scale)
Dies are then placed into a package as part of the manufacturing process. The package
provides the interface between the die and the motherboard. Some packages (particularly lower power and lower cost offerings) are soldered directly to the motherboard. Others
are said to be socketed, which means that they can be installed, removed, and replaced for
the motherboard. The package connects to the motherboard through metal pins, which
Packages can also include an integrated heat spreader (IHS), which is conceptually an integrated heat sink. Removing heat generated by the consumption of power within a CPU is critical to achieving high performance systems. IHSs help to spread the heat from the cores (and other areas with high power/heat density) out to the rest of the die to avoid
hot spots that can lead to early throttling and lower performance. Figure 2-4 shows two
CPU packages—one from an Avoton SoC and one from a Sandy Bridge. The Sandy Bridge package is much wider and deeper to accommodate the larger die and additional pins, but is also much taller. Part of this additional height is due to the IHS.
Figure 2-4. Package photos of an 8c Xeon Sandy Bridge EP (right) and 8c Atom Avoton (left)
Multiple dies can be included in a single package. This is called a multi-chip package
(MCP). MCPs can provide a cost-effective way for increasing the capabilities of a product. One can connect two identical dies (commonly used to increase core count), or different dies (such as a chipset and a CPU). Connecting two devices inside of a package is denser, lower power, and lower latency than connecting two separate packages. It is also possible to connect dies from different process technologies or optimization points. MCPs have been effectively used in the past to provide high core count processors for high-end servers without the need for huge dies that can be cost prohibitive to manufacture. Dies within an MCP share power delivery and thermal constraints with each other, and therefore there are limits. For example, it can be very challenging (and expensive) to cool two 130 W CPUs stuck together into a single 260 W package. Bandwidth and latency between two dies in an MCP are also constrained compared to what is possible in a single die.
On-die Fabrics and the Uncore
Historically, Intel has referred to all of the on-die logic outside of the cores as the uncore.
devices must be purchased. It can also result in denser designs for the same reason. It can also be more power efficient to incorporate more functionality into a single die or package as higher performance connections consume lower power when integrated.
In these SoCs, the interconnect that provides the communication between the
various IPs has been termed an on-die fabric in recent years. Off-chip fabrics that connect
multiple CPUs together into large, non-coherent4 groups of CPUs also exist. Modern
on-die fabrics are the evolution of the uncore interconnect from earlier generation CPUs. On servers, when the cores are active and executing workloads, the power contribution from the uncore tends to be much smaller than the cores. However, when the cores are all idle and in a deep sleep state, the uncore tends to be the dominant consumer of power on the CPU as it is more challenging to efficiently perform power management without impacting the performance of server workloads. The exact breakdown of power between the cores and uncore can vary widely based on the workload, product, or power envelope.
Power Control Unit
As power management has become more and more complex, CPUs have added internal microcontrollers that have special firmware for managing the CPU power management
flows. At Intel, these microcontrollers are called both the PCU (power control unit) and
the P-Unit, and the code that they execute is called pcode. The PCU is integrated into the CPU with the cores. These microcontrollers are generally proprietary, and the firmware that runs on them is kept secret. It is not possible for OEMs or end users to write their own firmware or change the existing firmware in these PCUs. However, various configuration options are available to the OEM and end user. These can be controlled through either the OS or BIOS. Tuning and configuring these options is discussed in Chapter 8.
The PCU is responsible for the bulk of the power and thermal management capabilities that will be discussed through the rest of this chapter. The firmware running on the microcontroller implements various control algorithms for managing the power
and performance of the CPU. Table 2-3 provides a high-level snapshot of some of the
roles and capabilities of the PCU. The PCU is connected to almost every major block of logic on the CPU die and is continuously monitoring and controlling their activity.
Table 2-3. Common PCU Roles
Role
Description
Power management Central control center for managing voltage, frequency, and
other power saving states
Thermal management Implements algorithms to prevent the CPU from overheating
Reset controller Facilitates powering up the CPU
Firmware can be patched in the field, either through BIOS or even directly from a running system in the OS. However, patch deployment after devices enter production is not frequent.
Server vendors do use their own proprietary firmware that runs off-chip on a
baseboard management controller (BMC; a small microcontroller). This firmware frequently interacts with the PCU for performing both power and thermal management
through the Platform Environment Control Interface (PECI). These topics will be
discussed in more detail in Chapters 4 and 5.
External Communication
Although performing calculations is important on CPUs, getting data in and out of the
CPU is a key part of many server workloads. Table 2-4 provides an overview of a selection
of the key interfaces.
Table 2-4. External Communication
Interface
Details
Memory (DDR) Memory provides storage for application code and data. It can also
provide caching for frequently accessed data from drives. It is not uncommon for server CPUs to have hundreds of GBs of memory capacity, and even TBs are possible.
Drive storage Drive storage is also common on servers. Some end users are
moving away from having any local drive storage on compute nodes, electing instead to store all persistent data on separate storage nodes that are accessed over a high bandwidth network. The boot process can even be performed completely over the network. This can save significant procurement cost. Other customers still find a need for local storage on individual nodes.
Networking Ethernet or InfiniBand are staples of most server nodes for moving
data in and out of a given CPU for processing, or between nodes for tasks that utilize multiple CPUs for a single task.
Video ports Video ports are rare and generally are not included on the platform.
It is common for users to connect discrete graphics cards in the rare occasion where video is required.
USB ports USB ports are also common and are primarily used for special tasks
like firmware updates or debugging (not during normal execution).
Manageability Servers commonly include an interface like PECI for external
controllers to manage the server. These interfaces provide a mechanism for tasks like monitoring temperature or controlling power without interfering with the software running on the CPU cores.
Thermal Design
CPUs consume power in order to execute; that power must be dissipated in order to keep temperatures under control. On modern CPUs, thermal sensors exist to monitor the temperature and help guarantee that the CPU will not get to a dangerous temperature where reduced reliability or damage could occur. CPUs may throttle themselves to stay under a target temperature or even initiate an immediate shutdown if temperature exceeds certain thresholds.
Most server CPUs are sold with thermal design point (TDP) power. The TDP specifies
the amount of power that the CPU can consume, running a commercially available worst-case SSE application over a significant period of time and therefore the amount of heat that the platform designer must be able to remove in order to avoid thermal throttling
conditions. The TDP power is generally paired with a base frequency (sometimes called the
P1 frequency). A defined TDP condition is used to characterize this (power, frequency) pair.
The goal of the TDP condition on servers has been to identify the worst-case real workload5
that a customer may run. Different vendors (or even different products from the same vendor) can use varied TDP definitions, making it difficult to use this number for meaningful comparisons across these boundaries. Sequences of code that will consume more power at the TDP frequency than the TDP power do exist, and these workloads will be throttled in order to stay within the design constraints of the system and to prevent damage to the CPU.
Note
■
Different workloads can consume a wide range of power at the same frequency.
Many workloads consume significantly lower power than the tDp workload at the tDp
frequency.
Turbo
is a feature that allows those workloads to run at higher frequencies while
staying within the thermal and electrical specifications of the processor.
Interface
Details
Coherent interconnects
In deployments that have multiple CPUs per node, a coherent interconnect is used to connect the multiple sockets (e.g., Intel QPI). This allows multiple CPUs to be connected to each other and share a single operating system.
Non-coherent bridging
Some CPUs also support technologies to create non-coherent interconnects between nodes using PCIe (e.g., Intel NTB [Non-Transparent Bridge]). These technologies create non-coherent “windows” into the physical memory space across two machines where each machine appears as a PCIe device to the other machine (with a memory-mapped I/O [MMIO] range assigned to it). Today it is primarily used in storage usage models for redundancy across servers.
Table 2-4. (continued)
Many traditional server processors have had TDP power in the range of ~30 W to ~150 W. Microservers push TDPs much lower—down to ~5 W. Although it is possible to build processors with larger TDPs, these tend to be more challenging to work with. Larger heat densities can be difficult to cool efficiently and make cost effective. It is also possible to have larger processor dies that have less heat density, but these dies can also be challenging to manufacture efficiently.
Some client processors have adopted a concept called Scenario Design Power (SDP).
This concept suggests that designing for the TDP may result in over-design in certain usage models. SDP attempts to provide OEMs with guidance about the thermal needs of certain constrained usage models. SDP has not been adopted for any server products at this time. Servers tend to rely on Turbo to reduce exposure to any platform
over-design caused by designing to TDP.
CPU Design Building Blocks
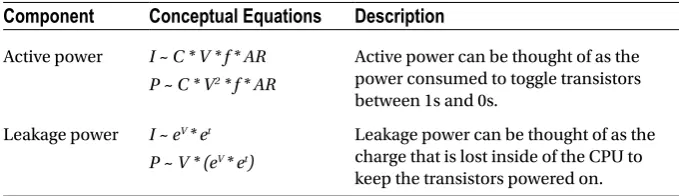
The CPU architecture is constructed with a mix of analog and digital components. Analog design is typically used for designing the off-chip communication (such as the circuits that implement PCIe and DDR I/O), whereas the bulk of the remaining system is built out of digital logic.
Digital Synchronous Logic and Clocks
The bulk of the computation performed by CPUs is done by digital synchronous logic.
Synchronous designs can be thought of as large pipelines. Tasks are broken up into
subsets of work (see Figure 2-5). Groups of logic gates (implemented with transistors)
take input data (1s and 0s) and calculate a set of output data. It takes time for the transistors to compute the answer from an input set, and during that time, it is desirable
for that input data to be stable. Flops store state for logic while it computes and store the
output data when it is ready for the next set of logic. Clocks, distributed throughout the
CPU, tell these flops when they should latch the data coming into them.
Flop GatesLogic Flop Logic
Gates …
Clock
Figure 2-5. Digital synchronous logic
SRAM and eDRAM
Static random-access memory (SRAM or static RAM) is a block of logic that is used to store data. Most caches are built based on SRAM designs, and therefore SRAM commonly makes up a large percentage of the CPU die. Dynamic RAM (DRAM) is another type of logic that can be used to store data, and it is used for DDR devices.
SRAM is much larger in size than DRAM and consumes more power per byte of data, but it is also much faster to access and easier to design with. Unlike DRAM, it is built with similar manufacturing techniques to normal CPU logic, making it more amenable to integration into a single CPU die with other logic. It is possible to build large caches using embedded DRAM (eDRAM). eDRAM is used in Haswell E3 servers.
I/O
I/O circuits provide the capabilities for communication on and off a die. For example, these circuits are used for DDR, PCIe, and coherent interconnects like QPI. Most interconnects are parallel—transmitting multiple bits of data simultaneously. However, some serial interconnects still exist for low-bandwidth communication with various platform agents like voltage regulators.
There are two main types of I/O that can be used: differential signaling and
single-ended signaling. Single-ended signaling is the simplest method for communicating with
I/O. Conceptually, to transmit N bits of parallel data, N + 1 wires are required. One wire
holds a reference voltage (commonly 0 V ground) whereas the others transmit binary data with a predefined higher voltage representing a 1. Differential signaling is more complicated, using a pair of wires (called a differential pair) to transmit a single bit of data. Differential signaling is less exposed to noise and other transmission issues, and therefore it provides a mechanism to reach higher frequencies and transmission rates. However, differential signaling requires roughly twice the platform routing compared to single-ended signaling and also tend to consume more power—even when they are not actively transmitting useful data.
Intel Server Processors
Throughout this chapter, various recent Intel server processors will be referred to by their
codenames in an attempt to illustrate the progression of the technologies. Figure 2-6