What does zoning have to do with
local food systems?
Anna L. Haines *
University of Wisconsin–Stevens Point
Submitted December 15, 2017 / Revised February 16, March 19, April 13, and July 30, 2018 / Accepted April 13, 2018 / Published online October 17, 2018
Citation: Haines, A. L. (2018). What does zoning have to do with local food systems? Journal of Agriculture, Food Systems, and Community Development, 8(Suppl. 2), 175–190. https://doi.org/10.5304/jafscd.2018.08B.007
Copyright © 2018 by the Author. Published by the Lyson Center for Civic Agriculture and Food Systems. Open access under CC BY license.
Abstract
This paper investigates the extent to which local governments use zoning ordinances to support local food systems. An audit tool was created that comprised five food system elements and a total of 24 land use items that could be included in a zon-ing ordinance. Uszon-ing this tool, the author examined 104 zoning ordinances in Wisconsin to determine if they include any of these 24 items. Zoning ordi-nances from rural and urban areas and from com-munities that had evidence of local food systems and those that did not were selected for this study. The findings indicate that there is wide variation in how zoning ordinances address local food systems. There are also significant differences between rural and urban communities and between communities with a focus on local food systems and those with-out. Communities have an opportunity to include more land use items that support local food
systems within their zoning ordinances than currently exist.
Keywords
Local Food, Land Use, Zoning, Wisconsin
Introduction and Literature Review
The United States food system relies on a complex web of infrastructure, relationships, and regulations to get food from field to mouth. The food system includes processes as diverse as food production, processing and distribution, access and consump-tion, and waste recovery (Center for Ecoliteracy, 2012; Harvard Law School Food Law and Policy Clinic, 2012). Local governments have recognized that their policies and regulations can inhibit or support the local food system, whether they are in urban areas (Vaage & Taylor, n.d.) or fringe and rural areas (Richardson, 2013), and can create barriers to healthful food environments (Raja, Picard, Baek, & Delgado, 2014).
Zoning is one of many local policy tools and a recognized way to support or hinder the local food
* Anna L. Haines, PhD, Professor and Director, Center for Land Use Education, College of Natural Resources, University of Wisconsin–Stevens Point; Stevens Point, WI 54481 USA; +1-715-346-2386; ahaines@uwsp.edu
Special JAFSCD Issue
Local Government in Food Systems Work
system. According to Fischel (2000), “there are more than 25,000 local jurisdictions in the US that have the power to adopt zoning laws, and their authority to regulate land is derived from the legis-latures and constitutions of 50 states, not from the federal government” (p. 403). Talen (2012) notes that “…codes are the basis for public decision-making to the built environment” (p. 1). Both urban and rural areas use zoning to regulate land use, and while it is used less often in rural areas, rural areas deal with complex issues, such as min-ing, that can be regulated under a zoning ordinance (Daniels & Daniels, 2003). Due to the ubiquity of zoning and its power to determine land uses within a local government jurisdiction, in this article I analyze the extent to which zoning codes compre-hensively address local food systems. The follow-ing sections of the article review the literature focused narrowly on the relationship between local food systems and zoning, articulate the methods used to select and analyze zoning codes, and, finally, discuss the results of this analysis and their implications.
An Explanation of Zoning
The zoning code is a policy tool used by most communities across the U.S. to regulate private land and has been used by local governments for over 100 years (Hoch, Dalton, & So, 2000). Its original purpose was to separate land uses and to protect single-family residential areas. The zoning code and its accompanying zoning map defines land uses, density of buildings and land parcels, and the dimensions of the building envelope on a land parcel. The act of amending a zoning ordinance allows for some flexibility in an otherwise rigid policy tool (Hoch, Dalton, & So, 2000). The ease with which amendments can be made depends on a particular community, but it is much easier to add or delete land uses than to rewrite an entire zoning ordinance (Hoch, Dalton, & So, 2000; Kelly & Becker, 2000). The ease with which minor amend-ments can be made may imply that the code can be more easily influenced by those who are familiar with it, such as developers, in contrast to the average resident.
A zoning map accompanies the zoning code. The zoning map divides the community into
different zoning districts and the text specifies uses that are allowed within those districts, such as resi-dential, commercial, industrial, and agricultural (Hoch, Dalton, & So, 2000; Kelly & Becker, 2000). Each zoning district specifies uses that are allowed-by-right (permitted uses) and those that require special consideration (conditional uses or special exceptions). In a large-lot, single-family residential district, for example, permitted uses might include single-family homes, home-based businesses, and police and fire stations, while conditional uses might include community gardens, daycare centers, schools, churches and other religious institutions. If a particular use is not listed within a district as either permitted or conditional, it is considered prohibited (Daniels, Keller, & Lapping, 1995). That means that in a commercial district, for example, if restaurants are neither permitted nor conditional uses, restaurants are presumed prohibited in that district. It is possible to rezone parcels from one district to another; however, the desired use must be listed in that district. Local governments have the discretionary authority to rezone properties and determine the uses allowed in various districts. That the zoning ordinance is inflexible in terms of listing or not of particular uses, including local food system uses, can create a significant barrier for change in a community.
Zoning and the Food System
Zoning is a key policy tool that can set the pattern of development and encourage or prohibit land uses. Several studies examine zoning ordinances in the U.S. to understand the extent to which zoning addresses areas of concern. This includes topics such as smart growth, sustainability, and mixed uses (Hirt, 2007, 2013; Jepson & Haines, 2014; Talen & Knapp, 2003). A few studies consider local food systems as part of one of these larger topics.
livestock in urban areas. For the zoning ordinances specifically, Butler examined zoning districts, lot sizes, setbacks, and other aspects of regulating ani-mals. He found ordinances that allowed livestock in only agricultural districts and ordinances that allowed livestock in residential districts, suggesting that communities vary widely in their approach to regulate agriculture. Meenar, Morales, and Bonarek (2017) reviewed zoning ordinances and other docu-ments in 80 municipalities across the U.S., focusing on urban agriculture for gardens and livestock. They found many examples of urban agriculture being allowed in zoning ordinances; 77 out of 80 municipalities allowed or did not expressly forbid livestock, while only 17 municipalities regulated built structures for urban agriculture.
Zoning is sometimes criticized for creating barriers to urban agriculture in terms of both vegetable and animal production, encouraging unhealthful food options, and harming farmland protection in rural areas and on the urban fringe (Caton-Campbell, 2004; Daniels & Payne-Riley, 2017; Horst, McClintock, & Hoey, 2017; Raja, Born, & Russell, 2008; Schindler, 2014; Soma & Wakefield, 2011; Zapp, 2016). In urban areas, small grocery stores and urban agriculture can be inhib-ited by zoning, including prohibitions on the sale of fruit and vegetables in outdoor stands or mar-kets, gardening or farming in residential districts, and limitations on the type and number of farm animals (Caton-Campbell, 2004; Desjardins, Lubczynski, & Xuereb, 2011; Feldstein, 2013; Horst et al., 2017; Raja et al., 2008; Schindler, 2014).
One strategy to deal with regulatory barriers is to remove them by amending the zoning ordinance (Caton-Campbell, 2004). Robbins (2016) recom-mends using the zoning ordinance to expand urban agriculture in residential and commercial districts. Horst et al. (2017) provides several examples of cities that have amended zoning ordinances to allow the keeping of bees, poultry, and goats; culti-vation of crops, including fruit and nut trees; urban farm incubators; and local food-based retail, including public markets and street vending. Another strategy is to discourage uses such as fast-food and chain restaurants (Morales & Kettles, 2009; Mukherji & Morales, 2010; Raja et al., 2008;
Robbins, 2016). For example, Concord, Massa-chusetts, expressly prohibits fast-food restaurants in its zoning ordinance (Raja et al., 2008).
Many researchers have used a case-study approach to examine how particular cities have incorporated local food system goals and policies into existing planning and policy frameworks (Masson-Minock & Stockmann, 2010; McClintock, Wooten, & Brown, 2012; Raja et al., 2014). After many workshops and discussions, the Flint, Michigan, zoning ordinance was amended to allow hoop houses and keeping of chickens (Masson-Minock & Stockmann, 2010). The Buffalo, New York, draft ordinance added urban agriculture activities in many districts and addressed structures like apiaries, chicken coops, greenhouses, farm stands, and market gardens (Raja et al., 2014). Finally, the Oakland, California, interim zoning ordinance allowed urban agriculture in all zoning districts within the city as a conditional use. It also amended the ordinance to allow indoor food production, such as hydroponics, in industrial districts (McClintock, Wooten, & Brown, 2012).
The literature on food systems and zoning is largely focused on urban agriculture and its many uses. There are no comprehensive studies that analyze developing local food systems through zoning solutions (Martinez et al., 2010; Russell, 2011). In this article, I attempted to analyze local food systems by specifically studying zoning ordinances in metropolitan and nonmetropolitan areas. My specific question was: To what extent do zoning ordinances address local food systems in rural and urban areas? I examined zoning ordi-nances that affect all aspects of the local food system, including food production, processing, aggregation and distribution, retail, and waste (Center for Ecoliteracy, 2012; Harvard Law School Food Law and Policy Clinic, 2012). In addition, using descriptive analysis, I took a deeper look at zoning codes from two communities that have had extensive support for local food systems as a way to provide further insight into the specifics of zoning codes.
Research Approach and Data
ordinances to audit. In the second phase, I created an audit tool and used it to score each zoning ordi-nance. In the third phase, I used descriptive and statistical analyses to measure the extent of local food systems items within zoning ordinances. In the fourth and final phase, I conducted a review of two cases using description to illuminate each one.
Phase I. Community Selection
Wisconsin is on Rodale’s top ten list of most locavore-friendly states (Zerbe, 2012). As early as 2000, the city of Madison, for example, had created an advisory committee on community gardens, which in turn developed an action plan (City of Madison Advisory Committee on Community Gardens, 1999). Wisconsin communities also operate under the same state laws pertaining to planning and zoning. For these reasons, and due to my familiarity with Wisconsin, I chose to select communities from Wisconsin.
I gathered data for all counties in Wisconsin from the U.S. Department of Agriculture (2012). I created an index to show the presence of local food systems based on ten variables. Three vari-ables represented agricultural production: direct
sales to consumers ($), farm type (# of family-owned), and farm size (# of farms of 1 to 49 acres [0.4 to 20 hectares]). Four variables focused on small processing establishments with one to nine employees: animal, grain and/or oilseed, dairy, and fruits and/or vegetables. Three variables repre-sented other local food businesses with one to nine employees: bakeries, beverages, and other. The other category includes coffee and tea manufac-turing and perishable prepared food manufactur-ing, among other items. I decided on these tiny firms with the rationale that they primarily process and sell their products locally rather than export it (Deller & Stickel, 2014). The results of this analysis are shown in Figure 1. The map on the right shows the index without normalizing the data by popula-tion, and the map on the left shows the index nor-malized by population. Normalizing allows for consideration of nonmetropolitan areas. The figure shows the counties with low (lighter) to high (darker) scores. A high score means that for the 10 variables, there is evidence of a local food system.
Rather than randomly select communities, I chose to select a cross-section of communities from metropolitan and nonmetropolitan areas, and
those with high and low levels of local food sys-tems. For metropolitan counties, I chose Dane County, which had the highest local food index score, and it is in the Metro-High group. Local food sales in 2014 totaled US$2.9 million (Uni-versity of Wisconsin Extension, 2014). Milwaukee County had half the score of Dane County and is in the Metro-Low group. This county has local food sales totaling US$106,000 (U.S. Department of Agriculture, 2012). These two counties contain the two largest cities in Wisconsin.
The cluster of counties including Vernon, Crawford, and Richland had some of the highest normalized scores for nonmetropolitan counties (Non-Metro High group). This area has a high number of community-supported agriculture farms and is home to Organic Valley and a local food cooperative grocery store. In 2012, local food sales accounted for US$2.7 million in Vernon County, US$1.3 million in Crawford County, and
US$729,000 in Richland County (University of Wisconsin [UW] Extension, 2014). Adams and Juneau are two adjacent counties with some of the lowest scores of the nonmetropolitan counties (Non-Metro Low group). Local food sales amounted to US$178,000 in Adams County and US$195,000 in Juneau County (UW Extension, 2014).
I searched for a zoning ordinance for all the local governments within each county—towns, villages, cities, and the county. I used the Municode legislative service when possible and otherwise went directly to the community. Only those
ordinances that were available through the internet were included in the sample. In the seven selected counties, there are 211 local governments, of which 80 (largely town governments) do not have zoning (see Table 1). I scored 104 local ordinances, or just under 50% of the local governments.
Phase II. Creating the Audit Tool and
Scoring Communities
Freedgood, Pierce-Quiñonez, and Meter (2011) provide an excellent overview of existing assess-ment tools. However, existing assessassess-ment tools do not focus on zoning ordinances, but on other aspects of the food system, including determining foodsheds, analyzing food security, asset mapping with stakeholders, mapping food deserts, and identifying underutilized agricultural land. Evalua-tion tools have also been developed and used to examine local food systems within comprehensive plans (Evans-Cowley, 2011). An internet search did not find a food assessment tool focused specifically on zoning ordinances.
Given the lack of a tool for my specific pur-pose, I created an audit tool (see Table 2). I exam-ined the Harvard local food policy report (2012) and Center for Ecoliteracy food system diagrams (2012). The Harvard model (2012) was designed in part to lend itself to analyzing land use policy and includes five food system elements: production, processing, aggregation and distribution, retail, and waste. It includes each of these elements and the types of items one might find in a zoning ordi-nance. I chose items from the literature that had a
Table 1. Sample of Local Governments and Ordinances
County Type of Food County Group GovernmentsTotal Local
Total # of Zoning Ordinances
Percent of Local Governments with
a Zoning Ordinance
Total # of Ordinances Available and
Examined
Percent of Local Governments with an Examined Code
Adams Non-Metro Low 21 19 90.5% 19 90.5%
Crawford Non-Metro High 23 8 34.8% 3 13.0%
Dane Metro High 62 51 82.3% 45 72.6%
Juneau Non-Metro Low 29 10 34.5% 3 10.3%
Milwaukee Metro Low 20 19 95.0% 19 95.0%
Richland Non-Metro High 22 20 90.9% 12 50.0%
Vernon Non-Metro High 34 4 11.8% 3 8.8%
land use footprint. For example, community gardens have a land use footprint, while food policy councils do not.
The next step was to audit the local land use policies within each county. Content analysis was used as the primary method of reviewing each zoning ordinance. Following Norton (2008), “the general approach employed for content analysis is analogous to developing a set of close-ended questions for a survey and then administering that survey. It involves preparing an
evaluation protocol by defining categories for analysis and then having one or more evaluators or ‘coders’ use that protocol to read and ‘score’ the written communication” (p. 433). Each ordinance was reviewed twice by one coder.
The audit and scoring occurred in the following way: Search for agricultural districts, if present note how many dis-tricts are included. If found, search for particular uses that are both permitted and con-ditional, such as farm stands within each agricultural district. If found, that use would receive a score of 1 to indicate presence. All uses in that district were added for an actual score. For example, Madison has two agriculture districts. With four possible uses, the potential score was four uses multiplied by the number of districts. In Madi-son’s case, the potential score was 8. To normalize the scores across zoning ordinances, I divided the actual score by the potential score. In Madison’s case, the actual score was 2, the potential score was 8, and the normalized score was 0.25. Thus, for each type of district within the production element, the maximum score was a 1.
This process was followed for each type of district (agriculture, residential, mixed use, commercial, and industrial). Table 2 shows each food system element, along with the types of districts that were searched for, the type of uses within each district that were searched for, and the maximum score possible for that element. When each element is added together, the maximum score possible is 16. In terms of the maximum score, production has the highest weight because five districts are Table 2. Zoning Ordinance Audit Tool
Element Zoning districts and Uses within districts
Maximum Score for
Element
Production
Agriculture districts
5 Exclusive agricultural district
Small-scale direct consumer Animal direct consumer Farm stand
Residential, Mixed Use, Commercial, and Industrial districts
Urban agriculture
Community/neighborhood garden Commercial or truck garden Vertical or rooftop garden
Processing
Commercial and Industrial districts
2 Commercial kitchen
Shared-use kitchen Small food manufacturing Brewery
Winery
Other beverages Other
Aggregation and Distribution
Commercial and Industrial districts
2 Marketing cooperative
Food distribution center
Retail
Agriculture district
4 Farmers market
Residential, Mixed Use, and Commercial districts Grocery store
Food cooperative Restaurant Mobile vending Farmers market
Waste Residential, Commercial, and Industrial districts 3 Compost center
identified for production-related uses. Processing and aggregation and distribution have the lowest weights, because only two districts are identified for these elements.
Phase III. Statistical Analysis
I tested whether the mean scores were statistically different between metro and nonmetro ordinances, and between High- and Low- Food ordinances (see Table 1). The hypothesis is that the score from metro ordinances and high-local food ordinances will be significantly different from nonmetro and low-local food scores. SPSS Statistics for Windows version 24.0 was used for the analysis. The inde-pendent samples t-test was used to test for statis-tical significance. This uses the Satterthwaite approximation “to test the difference between means when the data violate the assumption of homogeneity of variance required of other tests”
(Vogt, 1999, p. 307) such as the student t-tests.
Phase IV. Case Studies
I selected two communities, the city of Madison and the village of Gays Mills, because of their high scores and metro and nonmetro locations to unpack the contents of these zoning ordinances. Madison is the central city of a metropolitan county, while Gays Mills is located in a rural, nonmetropolitan community. The zoning codes and comprehensive plans from both places were the key documents examined for this part of the research, and a descriptive analysis is the result.
Results
How Common Are Food System Elements in Zoning
Ordinances?
This section starts with a broad overview of the results and then examines the details of the food system elements (e.g., production, processing, etc.). All but three communities included something in their zoning ordinance related to local food
systems. For brevity’s sake, Table 3 displays the top ten scores by community. Madison’s score is twice that of the next scoring community. Dane County and two cities near Madison are also ranked in the top ten. Four of the top-ten scoring communities are in the Non-Metro High group.
Table 4 displays the means for the total score and for each of the food county groups by each food system element. The mean scores are far less Table 3. Top Ten Scores by Community and Group
Name of Community
Type of Food County
Group Score
City of Madison, Dane County Metro High 9.28 Town of Coon, Vernon County Non-Metro High 4.34 Dane County Metro High 4.08 City of Wisconsin Dells, Adams County Non-Metro Low 3.90 Village of Gays Mills, Richland County Non-Metro High 3.86 Village of DeSoto, Crawford County Non-Metro High 3.81 City of Stoughton, Dane County Metro High 3.35 City of Mauston, Juneau County Non-Metro Low 2.86 City of Fitchburg, Dane County Metro High 2.84 City of Virocqua, Vernon County Non-Metro High 2.77
Table 4. Scores and Standard Deviations (SD) by Food County Group and Food System Element
Elements Mean Total Metro High Non-Metro High Metro Low Non-Metro Low
Score SD Score SD Score SD Score SD Score SD
Production 1.13 1.29 2.08 1.44 0.60 0.55 0.22 0.27 0.43 0.30 Processing 0.32 0.18 0.28 0.16 0.33 0.15 0.24 0.20 0.46 0.21 Aggregation/
than the maximum potential score, indicating that these zoning ordinances did not contain many local food land uses. Among the four groups, the Metro-High group has the highest means, while the Metro-Low group has the lowest means.
Production: Given the emphasis in the literature
about urban agriculture and the inclusion of rural or nonmetro areas to capture farmland preserva-tion zoning, I expected that land uses associated with production would be the most prevalent, and indeed 85% of the ordinances had at least one zoning item related to agriculture or food produc-tion. Dane County had the highest score of 3.27 and the mean normalized score was 1.13 out of a potential score of 5. Table 5 shows the percent of ordinances that had a particular use present in each district. Urban agriculture shows up in many differ-ent districts. There is not a single use that was allowed in more than half of the ordinances. Some uses are rarely allowed, such as community gar-dens, which are only allowed in 1% of residential districts.
Processing: Ninety percent of the ordinances had
at least one of the seven possible uses present. The mean score was 0.32 out of a possible 2. Half of the top ten scorers were villages or cities located in the Metro Low group. One community from the Non-Metro High group was in the top ten and had the highest score with 0.71. Adams County, part of the Non-Metro Low group, was in the top ten for this category. Many land use items were present in industrial districts. Small food manufacturing, other
beverages, and other were permitted in industrial districts in about one-third of the ordinances. Breweries had low presence in both commercial (1%) and industrial districts (9%). Commercial kitchens and shared-use kitchens were not present in any of the ordinances, and wineries were not present in commercial districts.
Aggregation and distribution: Fewer than
two-thirds of the ordinances (62%) included any land uses pertaining to aggregation and distribution. The mean was 0.24. A score of 2 was possible for this element, and the highest score was the city of Monona with a 1. This city is adjacent to and somewhat surrounded by the city of Madison. The villages in the Non-Metro High group hold the next two scores and another three ordinances in the top ten are from the Non-Metro Low group. Only two potential land use items were included in the audit tool for this category within commercial and industrial districts: marketing cooperatives and food distribution centers. Food distribution centers in these two districts were allowed in 6% and 14%, respectively. Marketing cooperatives were allowed in one ordinance in an industrial district.
Retail: Uses in this element were evident in 84%
of the ordinances. The average score for all com-munities was 0.34 out of 4 possible points. Madi-son had the highest score with 3.26. Half of the 10 communities were in the Metro-Low group. One community was from the Non-Metro-High group and one was from the Non-Metro Low group. Commercial districts had the highest presence for
Table 5. Presence of Uses in the Production Element
Zoning Districts
Uses Agriculture Residential Mixed Use Commercial Industrial
Exclusive agricultural district 20.19%
These uses are not included in the search for the above
zoning districts Small scale direct consumer 0.96%
Animal direct consumer 24.04%
Farm stand 23.08%
Urban agriculture 6.73% 1.92% 11.54% 57.69% Community or neighborhood garden 0.96% 0.96% 3.85% 0%
all items, particularly small grocery stores (48%) and restaurants (29%). Surprisingly, not all ordi-nances allowed restaurants in mixed use and com-mercial districts. Two-thirds of the ordinances did not recognize restaurants as a possible land use in a commercial district.
Waste: This element had the lowest number of
ordinances with local food supporting compo-nents. Only eight out of 104 ordinances allowed compost centers. Half of the eight were from the Metro-High group, of which Madison had the top score of 2.58 out of 3. One community was from Metro-Low group, one community was from the Non-Metro High group, and two were from the Non-Metro Low group. For commercial districts, it was present in two ordinances, and in industrial districts in four ordinances.
Does Type of Community Matter?
In addition to analyzing the 104 ordinances, I hypothesized that there would be differences between metropolitan and nonmetropolitan ordi-nances and between high-local food and low-local food ordinances. Table 6 is the result of a t-test comparing the scores between metropolitan and nonmetropolitan communities. The results show a statistically significant mean difference in the food
score between community types. Metropolitan zoning codes demonstrate higher average levels of local food scores in comparison to nonmetro-politan zoning codes, suggesting that metrononmetro-politan communities integrate local food-related uses more frequently into their zoning codes.
Table 7 is the result of the t-test comparing the metro and nonmetro high groups with the metro and nonmetro low groups. The table shows a statistically significant mean difference in the food score between local food types. High-local food zoning codes demonstrate higher average levels of food scores in comparison to low-local food zon-ing codes. The results suggest that communities with local food businesses and agricultural produc-tion have also integrated local food system land uses into zoning codes.
In reporting the means of the groups, I noted that the overall mean for the Non-Metro Low group was higher than for the Non-Metro High group. I ran a similar analysis to test for statistical significance, but the results were not statistically significant at the .05 level.
Two Cases of Local Food Systems Zoning
This final section provides a deeper look inside two zoning ordinances that scored high using the audit tool. The city of Madison’s code had the top score
Table 6. Results of t-tests and Descriptive Statistics for Food Score by Community Type
Community Type 95% CI for Mean Difference
Metropolitan Non-Metropolitan
Mean SD n M SD n t df
Food Score 2.458 1.769 64 1.732 1.102 40 0.167, 1.284 2.578* 102
Note: Satterthwaite approximation employed due to unequal group variances. * p < .01
Table 7. Results of t-tests and Descriptive Statistics for Food Score by Local Food Type
Local Food Type 95% CI for Mean Difference
High Local Low Local
Mean SD n M SD n t df
Food Score 2.561 1.810 63 1.515 1.037 59 0.520, 1.571 3.940* 99.945
for a metropolitan area and has a known local food focus. Madison is the capital and is the second largest city in Wisconsin with a population of about 250,000 (U.S. Census Bureau, 2016). In contrast, the village of Gays Mills, also known for its local food focus, is located in southwest Wisconsin in the Kickapoo River Valley. Its population is about 525, while all of Crawford County has about 16,400 people (U.S. Census Bureau, 2016).
The reason that Madison received a high score in the audit is that local food systems are extensive within the zoning ordinance. There are 19 uses identified in the ordinance (see Table 8). The city has five categories of districts including residential (15), mixed use and commercial (6), downtown and urban (5), employment (6), and special (5), which includes agriculture, urban agriculture, airport, conservancy, and parks and recreation. All 37 districts include at least some local food uses. In terms of the five local food system elements, Madison is explicitly missing only one—
aggregation and distribution, although wholesale uses are permitted in some districts.
Madison is the only local government in this sample to have an urban agriculture zoning district.
Community and market gardens and keeping of chickens are present in all 37 districts. An unusual use permit-ted in all but the downtown and urban districts is the mobile grocery store. The definition indicates that stores can be operated only by nonprofit entities from a vehicle where there is another principal use. Mobile grocery units are recognized as a way to create access to healthy and affordable food in areas considered food deserts (EcoDistricts, n.d.).
Madison’s zoning ordinance states that one of its many intents and pur-poses is “to preserve productive agricultural land and provide oppor-tunities for local food production” (City of Madison, Common Council, 2013, p. 10). In addition, Madison’s comprehensive plan recognizes local food production and food processing
as plan objectives (City of Madison, Department of Planning and Development, 2006b, pp. 16–18). As of July 2018. Madison is working on a new com-prehensive plan (City of Madison, Department of Planning, Community & Economic Development, 2018).
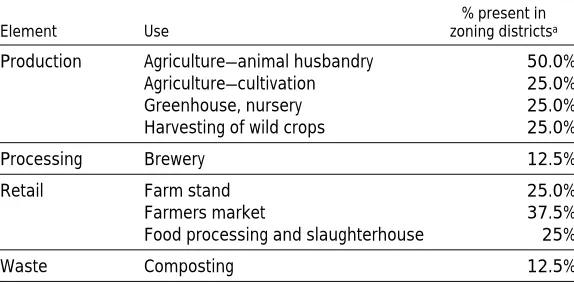
Gays Mills, unlike Madison, does not include a specific purpose statement in its zoning ordinance focused on agriculture or local food. This small community, however, scored well in comparison to many other local governments’ zoning ordinances. The village’s plan recognizes the development of local food systems as a goal and outlines four objectives, including developing community gar-dens, continuing the farmers market, developing a kitchen incubator, and focusing economic devel-opment efforts on food and agriculture, specifically local foods (Mississippi River Regional Planning Commission, 2010, p. 108). Gays Mills has made a purposeful effort through its zoning ordinance to support local food systems, primarily through production and processing (see Table 9). Both of
Table 8. Food-related Uses in Madison’s Zoning Ordinance
Element Uses
% present in zoning districtsa
Production Agriculture—animal husbandry Agriculture—cultivation
Community garden Greenhouse, nursery Keeping of chickens Keeping of honeybees Market garden 30% 35% 100% 27% 100% 95% 100% Processing Bakery (wholesale)
Bottling plant Brewery Distillery Winery 14% 8% 8% 8% 8% Retail Farmers market
Food and related goods sales Free-standing vending cart Mobile grocery store Outdoor cooking operation
Outdoor eating area associated with food and beverage establishment
70% 22% 3% 87% 87% 46%
Waste Composting 87%
a These percentages represent the presence of a particular food-related use in the
its agricultural districts must “serve on-site resi-dents and/or produce food to be sold directly from the grower to the consumer, such as at a farmer’s market” (Village of Gays Mills, n.d., p. 20). The code focuses specifically on “small-scale,” whether it is agriculture or processing. For exam-ple, the brewery use is permitted if it is under 25,000 square feet (2,323 square meters) and a conditional use if it is larger than that size. It has eight districts: residential (2), business (1), agricul-ture (2), industrial (1), and conservancy (2).
Discussion
Presence of Local Food Land Uses in Zoning
Ordinances
As Duerksen (2008) noted, “Ask any local elected official what their most powerful and effective tool is to shape and protect their community and most will say, ‘our zoning code’” (p. 30). This analysis of 104 ordinances found some indication of local food reflected in zoning ordinances; however, it is far from common. The findings from this analysis suggest that food system elements (e.g., food production and processing) and their associated land uses (e.g., community gardens and small food manufacturing) are uncommon in zoning ordinances. Planners know that land uses absent from a zoning code make that use prohibited, whether it is a community garden or a slaughterhouse (Daniels et al., 1995) and that land use legislation (i.e., amendments or
rewrites) is a potentially powerful tool for change (Feldstein, 2013). As I discussed previously in explaining zoning, it is reasonably straightforward to amend a zoning ordinance. The ease with which amendments can occur can be considered a strength—by adding new land uses—or a
weakness—by deleting land uses. It implies that local food land uses can be added to various districts by going through a normal local political process. Ordinances can include many more local food land uses than are reflected in this analysis.
While an absence of local food land uses exists, the code analysis and case studies demonstrate that local food land uses can and do occur in zoning ordinances. Local food land uses are embedded across the range of districts (agricultural, residen-tial, commercial, and industrial) and across the spectrum of local food elements (production, pro-cessing, etc.). Surprisingly, the most prevalent food system land uses were in the processing element. Ninety percent of the ordinances allowed some land uses associated with food processing. It is per-haps not surprising that cities and villages included food processing in their industrial districts, but many counties and towns also included food processing.
Also surprising was the lower percent of ordi-nances with food production in comparison with food processing (85% versus 90%, respectively). As noted in the results section, less than half of the ordinances contained land uses such as urban agriculture, community gardens, or farm stands.
This finding follows Jepson and Haines (2014), who found infrequent inclusion of land use items that encouraged local food production. However, Meenar et al. (2017) found that all but three of the 80 munici-palities they examined allowed animal husbandry in some form; it is unclear how many of those 80 included animal husbandry in the zoning ordinance per se. Acknowledging that there are other ways in local policy and law to accom-plish a more robust local food system is important. Nevertheless, zoning ordinances are the primary local tool to regulate the uses of land.
Table 9. Gays Mills Districts and Uses
Element Use zoning districts% present in a
Production Agriculture—animal husbandry Agriculture—cultivation
Greenhouse, nursery Harvesting of wild crops
50.0% 25.0% 25.0% 25.0%
Processing Brewery 12.5%
Retail Farm stand Farmers market
Food processing and slaughterhouse
25.0% 37.5% 25%
Waste Composting 12.5%
aThese percentages represent the presence of a particular food-related use in the
Restaurants were present in less than half of the ordinances in residential, mixed use, and com-mercial districts. They were present in comcom-mercial districts in 41% of the ordinances. With a more careful look at the data, cities and villages tend to allow this use, while it is absent in towns. This absence in towns is not surprising, given these local governments tend to be the most rural entities in this sample. Five ordinances permitted restaurants in residential districts, which may indicate the recognition of older residential neighborhoods or a move toward a mixed-use district. Another surprise was the presence of small food manufacturing in over one-third of the ordinances. One example is a farmstead food processing facility in the town of Coon. Finally, only one-third of the ordinances included land uses related to the aggregation and distribution element. While food hubs and other aggregation uses are recognized as a way to relieve a barrier that producers have to market, store, and transport local food, I found few mechanisms in these zoning ordinances to relieve that barrier (Day-Farnsworth, McCown, Miller & Pfeiffer, 2009; GRACE Communications Foundations, 2017).
The results indicate that particular land use items are more acceptable in some zoning districts than others. For instance, community gardens are a land use item that could be located in many dis-tricts (residential, commercial, mixed, or industrial), but I found they were rarely allowed in the ordi-nances I reviewed. Given zoning’s history and roots to separate different land uses, particularly to protect single-family residences (Hoch et al., 2000), it should not be surprising that the findings illu-strate the continued separation of uses. According to Hirt (2013), for at least two decades, planners and others have been promoting mixed uses (build-ing and districts). However, this sample of zon(build-ing ordinances does not indicate that a mixed-use district is or can provide a relief valve for a range of land use items that one may not find in other districts.
Presence of Local Food Land Uses among
Communities
For communities in this sample that were desig-nated “high-local” food, their resulting statistically
significant higher scores indicates that there is a relationship between the presence of small food businesses and agricultural production on small farms as measured by the U.S. Census of Agricul-ture and the U.S. Census and local food land uses included in zoning codes. This relationship may not be linear, but it bears further analysis. The method by which I identified a sample of com-munities also needs more refinement and further analysis, especially at a broader regional or national scale.
In addition, community plans, food policy councils, and other local food advocacy may provide indicators that local food land uses are becoming integrated into the community’s zoning ordinance. Madison’s recognition of local food systems in the ordinance indicates that over some period of time local food system elements can become integrated into the fabric of the city. However, this analysis only examined a snapshot and did not look at how that process unfolded. An important aspect of Madison’s ordinance is the statement within its purpose to recognize local food production. However, Madison’s ordinance goes far beyond food production, covering a range of uses and four of the five food system elements. All districts have some local food uses. Thus, in a spatial sense, local food systems can take root citywide.
Gays Mills represented a high scoring non-metropolitan village that has used its zoning ordi-nance to recognize local food systems as it further develops and changes. For a community of 525 people, it is noteworthy that the ordinance explic-itly discusses small-scale agriculture in an era of increasingly large-scale industrial agriculture and the sale of food from producer to consumer. While many of the local food elements (processing, aggre-gation, and retail) are urban-oriented, the villages in the nonmetropolitan group scored high in these areas, including Gays Mills.
Summary and Conclusion
more central part of the state with a low-level focus, and two metropolitan counties—one with a high-level and one with a low-level focus. Overall, most communities included at least some local food land uses in their zoning ordinance.
The findings demonstrate that many zoning ordinances do not integrate land uses associated with local foods, and this absence indicates that zoning may remain a barrier to local food systems. Advocates of local food systems need to work with local staff to modify zoning codes to reflect the types of local food land uses that are wanted (Raja et al., 2014). In addition, local food advocates need to educate themselves about how zoning works in their communities. If zoning is a barrier to local food systems, local food land uses must become integrated into the zoning ordinance. While local context and politics always will play a key role and will influence how, when, and what kinds of change can occur within a zoning ordinance, many ordinances change incrementally, and it is the cumulative impact of those changes that may matter.
In one of her conclusions, Caton-Campbell (2004) suggests that planners can play a role in revising “local… regulations to promote the local food system” (p. 349). She suggests that local planning staff can act to integrate local food systems into the zoning code. A first step is for a community to review its ordinance to make sure desired uses are in it. If not, amending an ordi-nance is a necessary step to allow a use in a com-munity. When a new use is placed in an ordinance, there is a choice to make it a permitted or condi-tional use. Condicondi-tional uses often have greater
regulatory hurdles associated with them (e.g., an application process, a fee, standards, etc.). Another step to consider is whether it is possible to make conditional uses into permitted uses by directly outlining standards for that use in the zoning ordi-nance. These steps will go a long way toward allowing local foods.
While more work needs to be done to under-stand the connection between the local food sys-tem and zoning ordinances, this study shows that zoning ordinances can contain many land uses that would make many aspects of the food system more likely at the local level. Additional refine-ment and expansion is necessary on the audit tool, including two or more coders reading through the ordinances. It represents one way to assess the presence of local food systems in a zoning ordi-nance, which could be used as a self-assessment tool or for further cross-sectional analysis. With the ubiquity of zoning ordinances in use in local governments of the U.S., it is likely that amending ordinances to include aspects of the local food system would decrease a local policy barrier and increase the likelihood of a more robust local food system. However, it is incumbent on local food system advocates to understand the role of zoning within their community and how the process works in order to influence local food system land uses.
Acknowledgements
Thank you to the reviewers and my colleagues for their excellent reviews. This research was con-ducted as part of my position as an extension specialist and professor.
References
Butler, W. H. (2012). Welcoming animals back to the city: Navigating the tensions of urban livestock through municipal ordinances. Journal of Agriculture, Food Systems, and Community Development, 2(2), 193-215.
https://doi.org/10.5304/jafscd.2012.022.003
Caton Campbell, M. (2004). Building a common table: The role for planning in community food systems. Journal of
Planning Education and Research, 23(4), 341-355.https://doi.org/10.1177/0739456X04264916
Center for Ecoliteracy. (n.d.). Industrial food system and local food system [Diagrams]. Retrieved from http://www.nourishlife.org/pdf/Food_Systems_Diagrams.pdf
City of Madison Advisory Committee on Community Gardens. (1999). Growing a stronger community with community gardens:
An action plan for Madison. Retrieved from
City of Madison, Common Council. (2013). Chapter 28: Zoning code ordinance. Retrieved from
https://api.municode.com/CD/StaticCodeContent?productId=50000&jobId=302156&filename=Chapter 28 Zoning Code.pdf&type=ancillary&forceDownload=true
City of Madison, Department of Planning and Development. (2006). City of Madison Comprehensive Plan (Vol. 2). Retrieved from http://www.cityofmadison.com/dpced/planning/documents/v2c6.pdf
City of Madison, Department of Planning, Community & Economic Development. (2018). Comprehensive plan update.
Retrieved from http://www.cityofmadison.com/dpced/planning/comprehensive-plan/1607
Daniels, T., & Daniels, K. (2003). The environmental planning handbook for sustainable communities and regions. Chicago: Planning Press, American Planning Association.
Daniels, T. L., Keller, J. W., & Lapping, M. B. (1995). The small town planning handbook. Chicago: Planners Press, American Planning Association.
Daniels, T., & Payne-Riley, L. (2017). Preserving large farming landscapes: The case of Lancaster County, Pennsylvania.
Journal of Agriculture, Food Systems, and Community Development, 7(3), 67-81.
https://doi.org/10.5304/jafscd.2017.073.004
Day-Farnsworth, L., McCown, B., Miller, M., & Pfeiffer, A. (2009). Scaling up: Meeting the demand for local food. Retrieved from http://www.cias.wisc.edu/wp-content/uploads/2010/01/baldwin_web_final.pdf
Deller, S., & Stickel, M. (2014). Small food processing in the context of local foods (Staff Paper No. 577). Retrieved from
https://api.aae.wisc.edu/pubs/pdf/sps/stpap577.pdf
Desjardins, E., Lubczynski, J., & Xuereb, M. (2011). Incorporating policies for a healthy food system into land use planning: The case of Waterloo Region, Canada. Journal of Agriculture, Food Systems, and Community Development, 2(1), 127-140. https://doi.org/10.5304/jafscd.2011.021.003
Duerksen, C. (2008, January). Saving the world through zoning. Planning Magazine. Retrieved from
http://www.law.du.edu/documents/rmlui/saving-the-world-through-zoning.pdf
EcoDistricts. (2013). Case study: Mobile grocery units. Retrieved from
https://ecodistricts.org/wp-content/uploads/2013/05/Mobile-Grocery-Unit-Case-Study.pdf
Evans-Cowley, J. S. (2011). Evaluating food systems in comprehensive planning: Is the Mississippi Gulf Coast planning for food? Journal of Agriculture, Food Systems, and Community Development, 2(1), 105-126.
https://doi.org/10.5304/jafscd.2011.021.009
Feldstein, L. M. (2013). Zoning and land use controls: Beyond agriculture. Maine Law Review, 65(2), 468-490. Retrieved from https://digitalcommons.mainelaw.maine.edu/mlr/vol65/iss2/7
Fischel, W. A. (2000). Zoning and land use regulation. In B. Boudewijn, & G. De Geest (Eds.), Encyclopedia of law and
economics, volume 2: Civil law and economics (pp. 403-442). Cheltenham, UK: Edward Elgar Publishing.
Freedgood, J., Pierce-Quiñonez, M., & Meter, K. A. (2011). Emerging assessment tools to inform food system planning.
Journal of Agriculture, Food Systems, and Community Development, 2(1), 83-104.
https://doi.org/10.5304/jafscd.2011.021.023
GRACE Communications Foundations. (2017). Local and regional food systems. Retrieved from http://www.sustainabletable.org/254/local-regional-food-systems
Harvard Law School Food Law and Policy Clinic. (2012). Good laws, good food: Putting local food policy to work for our
communities. Retrieved from http://
www.chlpi.org/wp-content/uploads/2013/12/FINAL-LOCAL-TOOLKIT2.pdf
Hirt, S. (2007). The mixed-use trend: Planning attitudes and practices in northeast Ohio. Journal of Architectural and
Planning Research, 24(3), 224-244.
Hirt, S. (2013). Form follows function? How America zones. Planning Practice & Research, 28(2), 204-230.
https://doi.org/10.1080/02697459.2012.692982
Hoch, C., Dalton, L., & So, F. (2000). The practice of local government planning (3rd ed.). Washington, DC: International City/County Management Association.
Horst, M., McClintock, N., & Hoey, L. (2017). The intersection of planning, urban agriculture, and food justice: A review of the literature. Journal of the American Planning Association, 8(3), 277-295.
Jepson, E. J., Jr., & Haines, A. L. (2014). Zoning for sustainability: A review and analysis of the zoning ordinances of 32 cities in the United States. Journal of the American Planning Association, 80(3), 239-252.
https://doi.org/10.1080/01944363.2014.981200
Kelly, E. D., & Becker, B. (2000). Community planning: An introduction to the comprehensive plan. Washington, DC: Island Press.
Martinez, S., Hand, M., Da Pra, M., Pollack, S., Ralston, K., Smith, T.,…Newman, C. (2010). Local food systems: Concepts,
impacts, and issues (Economic Research Report No. 97). Retrieved from
https://www.ers.usda.gov/webdocs/publications/46393/7054_err97_1_.pdf?v=4226
Masson-Minock, M., & Stockmann, D. (2010). Creating a legal framework for urban agriculture: Lessons from Flint, Michigan. Journal of Agriculture, Food Systems, and Community Development, 1(2), 91-104.
https://doi.org/10.5304/jafscd.2010.012.007
McClintock, N., Wooten, H., & Brown, A. H. (2012). Toward a food policy “first step” in Oakland, California: A food policy council’s efforts to promote urban agriculture zoning. Journal of Agriculture, Food Systems, and Community
Development, 2(4), 15-42. https://doi.org/10.5304/jafscd.2012.024.009
Meenar, M., Morales, A., & Bonarek, L. (2017). Regulatory practices of urban agriculture: A connection to planning and policy. Journal of the American Planning Association, 83(4), 389-403. https://doi.org/10.1080/01944363.2017.1369359
Mississippi River Regional Planning Commission. (2010). Village of Gays Mills Comprehensive Plan 2010-2030. Retrieved from http://www.mrrpc.com/Misc_pdfs/Gays_Mills_Comprehensive_Plan_2010_2030.pdf
Morales, A., & Kettles, G. (2009, February). Zoning for public markets. Chicago: American Planning Association. Mukherji, N., & Morales, A. (2010, March). Zoning for urban agriculture. Chicago: American Planning Association. Municode Library. (n.d.). Retrieved from https://library.municode.com/
Norton, R. K. (2008). Using content analysis to evaluate local master plans and zoning codes. Land Use Policy, 25(3), 432-454. https://doi.org/10.1016/j.landusepol.2007.10.006
Raja, S., Picard, D., Baek, S., & Delgado, C. (2014). Rustbelt radicalism: A decade of food systems planning in Buffalo, New York (USA). Journal of Agriculture, Food Systems, and Community Development, 4(4), 173-189.
https://doi.org/10.5304/jafscd.2014.044.015
Raja, S., Born, B., & Russell, J. K. (2008). A planners guide of community and regional food planning: Transforming food environments,
facilitating healthy eating (PAS Report No. 554). Chicago: American Planning Association Planning Advisory Service.
Richardson, C. (2013). Zoning to support local food systems. Chapel Hill, NC: Clarion Associates. Retrieved from
http://georgiaplanning.org/presentations/2013_fall_conference/Local%20Food%20Systems.pdf
Robbins, E. (2016). Municipal action guide: Food-based business incubator programs. National League of Cities. Retrieved from
https://www.nlc.org/sites/default/files/2017-02/Food-Based_Business_Incubator_Programs.pdf
Russell, J. (2011, March/April). Planning Advisory Service memo: Local agricultural preservation: Making the food system connection.
Chicago: American Planning Association.
Schindler, S. B. (2014). Unpermitted urban agriculture: Transgressive actions, changing norms and the local food movement. Wisconsin Law Review, 82(1036), 369-396. Retrieved from
http://digitalcommons.mainelaw.maine.edu/faculty-publications/37
Soma, T., & Wakefield, S. (2011). The emerging role of a food system planner: Integrating food considerations into planning. Journal of Agriculture, Food Systems, and Community Development, 2(1), 53-64.
https://doi.org/10.5304/jafscd.2011.021.006
Talen, E., & Knaap, G. (2003). Legalizing smart growth: An empirical study of land use regulation in Illinois. Journal of
Planning Education and Research, 22, 345-359. https://doi.org/10.1177/0739456X03022004002
Talen, E. (2012). City rules: How regulations affect urban form. Washington, DC: Island Press. U.S. Census Bureau. (2016). QuickFacts: United States [Table].
https://www.census.gov/quickfacts/fact/table/US/PST045217
University of Wisconsin [UW] Extension. (2014). Economic impact of agriculture: County impact reports: Adams, Dane, Juneau, Crawford, Richland, Vernon. Retrieved from https://anre.uwex.edu/economicimpact/
Vaage, A. & Taylor, G. (2015). Municipal zoning for local foods in Iowa: A guidebook for reducing local regulatory barriers to local
foods. Retrieved from
https://www.extension.iastate.edu/localfoods/wp-content/uploads/2015/03/MUNICIPAL-ZONING-FOR-LOCAL-FOODS-IA.pdf
Village of Gays Mills. (n.d.). Title 13: Zoning. Retrieved from http://www.gaysmills.org/ordinances.html
Vogt, W. P. (1999). Dictionary of statistics & methodology: A nontechnical guide for the social sciences (2nd ed.). Thousand Oaks, California: Sage Publications.
Zapp, N. (2016). Where did all of the fields go? Environmental Claims Journal, 28(1), 58-74.
https://doi.org/10.1080/10406026.2016.1129270
Zerbe, L. (2012, May 15). The best & worst states for locally grown food. Rodale’s Organic Life. Archived at