R E S E A R C H
Open Access
Trends of medical expenditures and quality
of life in US adults with diabetes: the
medical expenditure panel survey,
2002
–
2011
Jennifer A. Campbell
1,2, Kinfe G. Bishu
3,4, Rebekah J. Walker
1,2and Leonard E. Egede
1,2*Abstract
Background:Studies indicate a relationship between cost and quality of life (QOL) in diabetes care, however, the interaction is complex and the relationship is not well understood. The aim of this study was to 1) examine the relationship of quartiles of QOL on cost amongst U.S. adults with diabetes, 2) investigate how the relationship may change over time, and 3) examine the incremental effect of QOL on cost while controlling for other relevant covariates. Methods:Data from 2002–2011 Medical Expenditure Panel Survey (MEPS) was used to examine the association between QOL and medical expenditures among adults with diabetes (aged≥18 years)N= 20,442. Unadjusted means were computed to compare total healthcare expenditure and the out-of-pocket expenses by QOL quartile categories. QOL measures were Physical Component Summary (PCS) and Mental Component Summary (MCS) derived from the Short-Form 12. A two-part model was then used to estimate adjusted incremental total healthcare expenditure and out-of-pocket expenses adjusting for relevant covariates.
Results:Differences between the highest and lowest quartiles totaled $11,801 for total expenditures and $989 for out-of-pocket expenses. Over time, total expenditures remained stable, while out-of-pocket expenses decreased, particularly for the lowest quartile of physical component of QOL. Similar trends were seen in the mental component, however, differences between quartiles were smaller (average $5,727 in total expenses; $287 in out-of-pocket). After adjusting for covariates, those in the highest quartile of physical component of QOL spent $7,500 less, and those in the highest quartile of mental component spent $3,000 less than those in the lowest quartiles.
Conclusions:A clear gradient between QOL and cost with increasing physical and mental QOL associated with lower expenditures and out-of-pocket expenses was found. Over a 10-year time period those with the highest physical QOL had significantly less medical expenditures compared to those with the lowest physical QOL. This study demonstrates the significant individual and societal impact poor QOL has on patients with diabetes. Understanding how differences in a subjective measure of health, such as QOL, has on healthcare expenditures helps reveal the burden of disease not reflected by using only behavioral and physiological measures.
Keywords:Medical expenditures, Quality of life, Out-of-pocket cost, Diabetes
* Correspondence:legede@mcw.edu
1
Center for Patient Care and Outcomes Research, Medical College of Wisconsin, 8701 Watertown Plank Road, Room H3165, Milwaukee WI 53226, USA
2Department of Medicine, Division of General Internal Medicine, Medical
College of Wisconsin, 9200 W. Wisconsin Ave, Milwaukee WI 53226, USA Full list of author information is available at the end of the article
Background
Type 2 diabetes is the seventh leading cause of death in the U.S. and affects more than 29 million people or 9.3% of the total United States (U.S.) population [1]. It is asso-ciated with a number of comorbid conditions including cardiovascular disease, kidney disease and stroke [1]. Type 2 diabetes is the primary cause of kidney failure in ap-proximately 44% of new diagnosed cases, and those with type 2 diabetes are 1.5 times more likely to be hospitalized for stroke compared to those without type 2 diabetes [2]. Type 2 diabetes and the associated complications dispropor-tionately affect ethnic minorities, with non-Hispanic Blacks experiencing higher rates of morbidity and mortality com-pared to other ethnic groups [1, 3]. Medical expenditures among those diagnosed with type 2 diabetes are estimated to be 2.3 times higher than those without diabetes; and in 2012 the overall direct and indirect cost of diabetes at the national level was an estimated $245 billion [1]. These ex-penditures are expected to increase as incidence in type 2 diabetes are estimated to more than double by 2050 [4].
Medical expenditures are found to be highest for those with a longer history of diabetes and for those who suffer greater complications compared to those who are newly diagnosed or who have pre-diabetes [5, 6]. In particular, long term complications that require hospital stays and medication expenditures are responsible for high cost in diabetes care [5, 7]. Recent examination of trends in med-ical expenditures among patients with diabetes also found that expenditures more than doubled over a ten-year period for patients with diabetes compared to expendi-tures for those without [7]. Other examination of medical expenditures amongst patients with diabetes have found that the treatment of co-morbid conditions adds to the burden of cost, with cardiovascular complications and renal failure increasing the existing cost of diabetes care by an additional 50% [8].
Medical expenditures have been shown to be associated with quality of life (QOL) in patients with type 2 diabetes. While the direction of this relationship is uncertain, as duration of diabetes and costs increase, QOL has been shown to decrease [9–11]. Cost driving factors among patients with diabetes that may influence QOL include obesity and disability [12–19]. For example, using a health utility score, Lee and colleagues found that in patients with diabetes, as BMI increased, health utility score de-creased by -0.0079 [16]. In addition, out-of-pocket costs, specifically, have been associated with differing levels QOL in patients with diabetes [20–22]. Piette and col-leagues found in a national survey assessing out-of-pocket medication costs for patients with diabetes, that nearly 30% of participants had difficulty paying for food and diabetes specific medications [21]. In addition, 20% reported lack of adherence to medication regimens due to cost of medications. A follow-up investigation found that
patients with high out-of-pocket costs experienced worse diabetes outcomes and lower physical and mental QOL compared to patients who did not experience high out-of-pocket costs [20].
As seen in the literature, there is some relationship between cost and QOL in diabetes care, however, the inter-action is complex and the relationship is not well under-stood. For example, a qualitative assessment examining patient perception of QOL and diabetes related treatment and complications found that perception of QOL, in the presence of comorbidities and complex treatment plans, varied by demographic characteristics [23]. This suggests that a greater understanding of the key factors that drive the relationship between cost and QOL are warranted. Moreover, understanding whether QOL and cost change over time is needed. To address this gap in the literature, we used multi-year data from the Medical Expenditure Panel Survey, to 1) examine the relationship of quartiles of QOL on cost amongst U.S. adults with diabetes, 2) investi-gate how the relationship may change over time, and 3) examine the incremental effect of QOL on cost while con-trolling for other relevant covariates.
Methods
Data source and study population
We used data from 2002–2011 Medical Expenditure Panel Survey Household Component (MEPS-HC) to examine the association between QOL and medical expenditures among adults with diabetes (aged ≥18 years). We identi-fied 20,442 (weighted sample of 18,157,187) US adults with self-reported diabetes from HC. The MEPS-HC includes several waves of national surveys of families and individuals, their medical providers, and employers in the U.S. The MEPS sample is drawn from reporting units in the previous year’s National Health Interview Survey (NHIS), a nationally representative sample with oversam-pling for Black and Hispanics of the U.S. civilian non-institutionalized population [24–26].
To ensure sufficient sample size and robust estimation for our analysis, we pooled 10 years of MEPS data. Because they have a common variance structure, we can ensure compatibility and comparatively of our variables within the complex sample design [7]. Our study accounts for the sampling weights, clustering and stratification design to estimate the nationally representative unadjusted mean and adjusted incremental healthcare expenditure for the U.S. population [26].
dollar using the consumers price index obtained from the Bureau of Labor Statistics (BLS) [27].
Measures
Variables of interest
The dependent variable in this study is the total direct healthcare expenditures and out-of-pocket expenses for the calendar year of each observation. Total direct health-care expenditures in MEPS-HC is defined as the sum of direct payments for care provided during the year, includ-ing out-of-pocket payments and payments by private in-surance, Medicaid, Medicare and other sources [26]. This is composed of office-based medical provider expenditure, hospital outpatient expenditure, emergency room expend-iture, inpatient hospital (including zero night stays) ex-penditure, prescription medicine exex-penditure, dental expenditure, home health care expenditure and other medical expenses [26]. The out-of-pocket expenses were defined as the amount paid by family for medical provider visit, non-physician services, hospital inpatient stays, emergency room visit, dental visit, home healthcare, and prescription medications. These expenditures included direct payments, deductibles, co-insurance, co-payments, and premiums for services received during the year [28].
The primary independent variables were QOL compo-nents, Physical Component Summary (PCS) and Mental Component Summary (MCS) derived from the Short-Form 12 Version 2 (SF-12V2), collected in the same year as ex-penditures. PCS and MCS scores were calculated according to the standard algorithm and incorporating imputations for some cases with missing data. The scoring algorithms of PCS42 and MCS42 create continuous variables that incorporate information from all 12 questions, with higher scores indicating better QOL [26]. Finally, we converted the continuous score of MCS and PCS into quartiles of equal distribution. We maintained the quartiles defined by the entire US population for both PCS and MCS, despite the analysis using only data from the population of those with diabetes to allow comparison to similar applications in clinical research [29, 30].
Controlled covariates
All controlled covariates used for analysis were based on self-report. Binary indicators of co-morbidities were based on a positive response to a question“Have you ever been diagnosed with xxx”. Cardiovascular disease (CVD) indicates a positive response to a coronary heart disease, angina, myocardial infarction or other heart diseases. Race/ethnic groups were categorized into: Non-Hispanic White (NHW), Non-Hispanic Black (NHB), Hispanic or others. Education was categorized into: less than high school (≤grade 11), high school (grade 12) and college or more (grade≥13). Marital status was categorized into: married, non-married and never married. Age was categorized into: 18–44, 45–64 and≥65
years. Census region was categorized into: Northeast, Midwest, South and West. Metropolitan Statistical Area (MSA) is a region with high population density and was used as an indicator of rural/urban residence, with MSA region in-dicating urban residence. Health insurance was categorized into: private, public only and uninsured at all time in the year. The income level was defined as a percentage of the poverty level and grouped in to four categories: poor (<125%), low in-come (125% to less than 200%), middle inin-come (200% to less than 400%) and high income (≥400%). Calendar year was grouped in to five consecutive years of 2002/03, 2004/05, 2006/07, 2008/09, 2010/11 for the pooled data.
Analyses
Descriptive statistics were used to describe QOL quartiles and characteristics of adults with diabetes. Proportions in each quartile were compared over time using chi2 tests for PCS and MCS. Unadjusted means were computed to compare total healthcare expenditure and the out-of-pocket expenses by quartile categories. A two-part model was then used to estimate adjusted incremental total healthcare expenditure and out-of-pocket expenses [31, 32]. In the two-part model, a probit model is estimated for the probability of observing a zero versus positive medical ex-penditure. Conditional on having positive medical expend-iture, a generalized linear model (GLM) was then estimated in the second part [33]. These models have been widely employed in situations where, due to large number of non-users of health services, there are excess zeros in the re-source use or cost data and the assumption of normality of the error term is not satisfied [34]. Cost estimates generally have an excess number of zeros for total and out-of-pocket payments, so a two-part model is recommended [33–35]. We confirmed fit of the two-part model and then used the margins command in STATA to calculate marginal effects and their standard errors from the combined first and sec-ond parts of the final model [33]. For the two-part model, the use of GLM in the second part has an advantage over log OLS since it relaxes the normality and homoscedasticity assumptions and avoids bias associated with retransforming to the raw scale [33]. To control for confounding, socio-demographic factors including age, sex, race, marital status, education, health insurance and metropolitan statistical area status, region, income level, comorbidities, and time trend were included in the model. We also tested for inter-actions between quality of life quartiles and time. Finally, we estimated the US burden for QOL based on the un-adjusted and un-adjusted annual estimates.
model taking in to account the complex survey design. Variance inflation factor (VIF) for all predictors used in the two-part model were indicating no multicollinearity problems. All analyses were performed at person-level using STATA 14 (StataCorp LP College Station, TX).
We used standard pairwise comparison methods of Sidak, Scheffe, Bonferroni and Tukey to compare the pooled mean total healthcare expenditure between QOL quartile categories for PCS and MCS [36, 37]. We com-pare mean expenditures between five groups for each of PCS and MCS (quartile 1 vs quartile 2, quartile 1 vs quartile 3, quartile 1 vs quartile 4, quartile 2 vs quartile 3, quartile 2 vs quartile 4, quartile 3 vs quartile 4).
Results
Demographic characteristics
Table 1 shows the characteristics of adults with diabetes included in the cohort. Out of 186,982 adults in the 10 year pooled data, 20,442 (10.9%) individuals had diabetes. Among adults with diabetes, approximately 50% were in the lowest quartile of health status of PCS (quartile 1) and 30% were in the lowest health status of MCS. PCS did improve over time (p= 0.005), however, MCS did not have a statistically significant change over time (p= 0.41).
Unadjusted cost differences for QOL
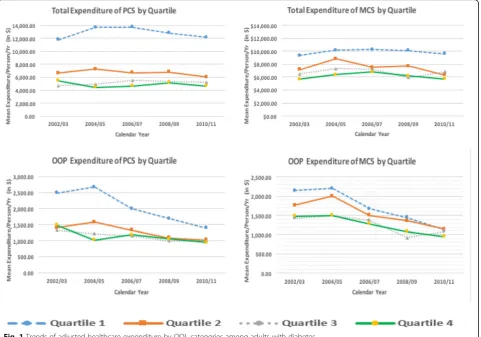
The results of unadjusted cost differences for QOL quartile categories overtime among adults with diabetes are shown in Table 2. The overall mean unadjusted direct healthcare expenditures of PCS decreased as QOL increased: for quar-tile 1 (lowest QOL) was $17,043 (95% CI $16,366, $17,721), quartile 2 was $8,233 (95% CI $7,739, $8,727), quartile 3 was $5,779 (95% CI $5,395, $6,192), and quartile 4 was $5,242 (95% CI $4,660, $5,825). Similarly, the overall mean un-adjusted direct healthcare expenditures of MCS decreased as QOL increased: for quartile 1 (lowest QOL) was $15,572 (95% CI $14,864, $16,281), quartile 2 was $11,729 (95% CI $10,931, $12,527), quartile 3 was $9,955 (CI $9,176, $10,734), and quartile 4 was $8,945 (95% CI $9,325, $10,365).
Mean unadjusted out-of-pocket expenditures of PCS also decreased as QOL increased: for quartile 1 (lowest QOL) was $1,551 (95% CI $1,410, $1,691), quartile 2 was $1,278 (95% CI $1,410, $1,691), quartile 3 was $1,121 (95% CI $1,410, $1,691), and quartile 4 was $1,011 (95% CI $808, $1,214). The overall mean unadjusted out-of-pocket expen-ditures of MCS for quartile 1 (lowest QOL) was $1,935 (95% CI $1,814, $2,055), quartile 2 was $1,733 (95% CI $1,633, $1,833), quartile 3 was $1,599 (95% CI $1,500, $1,697), and quartile 4 was $1,649 (95% CI $1,556, $1,740).
According to Sidak, Scheffe and Bonferroni all mean group total expenditures for both PCS and MCS except quartile 3 vs quartile 4 were found to be statistically significant at 95% CI. According to Tukey, pairwise com-parison showed that all mean group total expenditures of
PCS and MCS were statistically significant at 95% CI with the exception of quartile 2 vs quartile 4 for MCS. The re-sults of pairwise comparison tests showed consistent across the three methods (Sidak, Scheffe, Bonferroni).
Adjusted incremental cost differences for QOL
Table 3 shows the results of the adjusted two-part GLM on the incremental of total healthcare expenditures and out-of-pocket expenses associated with QOL quartile categories. After adjusting for socio-demographic factors, comorbidities and time trend covariates, the total mean direct healthcare expenditures of PCS for quartile 2 was -$5,313 (95% CI -$6,063, -$4,562), quartile 3 was -$6,994 (95% CI -$7,868, -$6,120), and quartile 4 was -$7,499 (CI 95% -$8,402, -$6,596) when compared to the lowest quartile. Overall, total expenditures increased between 2002/03 and the subsequent two time periods ($851p= 0.01 for 2004/05, and $696p= 0.02 for 2006/07), but were not significantly different from 2002/03 in later years. Compared to the lowest quartile, the adjusted total mean direct healthcare expenditures of MCS for quartile 2 was -$1,914 (95% CI -$2,635, -$1,194), quartile 3 was -$3,104 (95% CI -$3,824, -$2,383), and quartile 4 was -$3,262 (95% CI -$3,907, -$ 2,618). Overall, after accounting for MCS, total expenditures increased between 2002/03 and the subsequent two time periods ($1,315p= 0.002 for 2004/ 05, and $1,012p= 0.003 for 2006/07), but were not signifi-cantly different from 2002/03 in later years.
The adjusted mean out-of-pocket expenses of PCS for the second quartile was -$408 (95% CI -529– -287), the third quartile was -$611 (95% CI -$750, -$471), and the fourth quartile was -$670 (95% CI -$839, -$501) relative to the lowest quartile. Overall, after accounting for PCS, out of pocket expenses decreased between the years 2002/ 03 and later years (-$274 -$496, and -$629 respectively withp< 0.001 for 2006/07, 2008/09, 2010/11). Compared to the lowest quartile, the adjusted mean out-of-pocket expenses of MCS for the second quartile was -$96 (95% CI -213–20), the third quartile was -$286 (95% CI -$407, -$165), and the fourth quartile was -$283 (95% CI -$402, -$164). Overall, after accounting for MCS, out of pocket expenses decreased between the years 2002/03 and later years (-$272 -$525, and -$667 respectively with p< 0.001 for 2006/07, 2008/09, 2010/11).
Estimated US burden for QOL
Finally, we estimated the annual aggregate cost during 2002–2011 among US adults with diabetes for PCS and MCS in both the lowest and highest quartile. The total an-nual unadjusted direct expenditure of PCS for the lowest quartile was $124 billion and the highest quartile was $3.7 billion per year. The total annual unadjusted direct ex-penditure of MCS for the lowest quartile was $68.3 billion and the highest quartile was estimated $34.8 billion per year. After adjustment, the total incremental expenditure of PCS for the lowest quartile was higher at $54.6 billion and the adjusted total incremental expenditure of MCS for the lowest quartile was higher by $14.3 billion in US population, when compared to those with highest quartile.
Discussion
Overall, this analysis found a clear gradient between QOL and cost with increasing physical and mental QOL associated with lower expenditures and out-of-pocket expenses. Differ-ences between the highest and lowest quartiles totaled $11,801 for total expenditures and $989 for out-of-pocket expenses. Over time, while total expenditures remained stable, out-of-pocket expenses decreased for the lowest quartile of physical component of QOL. Similar trends were seen in the mental component, however, differences between the quartiles were much smaller (on average $5,727 in total expenses and $287 in pocket). By 2010/11, out-of-Table 1Sample demographics among adults with diabetes
(n= 20,442,N= 18,157,187)
Variables Percentage (%) Standard Errors
PCS
Quartile 1 (scores 4.56–41.53) 49.9 0.58
Quartile 2 (scores 41.54–51.93) 27.7 0.44
Quartile 3 (scores 51.94–56.15) 15.8 0.39
Quartile 4 (scores 56.17–73.88) 6.6 0.25
MCS
Quartile 1 (scores 0.77–43.84) 29.9 0.50
Quartile 2 (scores 43.85–52.39) 23.6 0.40
Quartile 3 (scores 52.4–57.18) 19.6 0.39
Quartile 4 (scores 57.19–77.37) 26.9 0.47
Age category
Age 18–44 13.5 0.40
Age 45–64 46.8 0.67
Age 65–85 39.7 0.67
Gender
Female 51.0 0.59
Race/ethnicity
Non-Hispanic White 64.4 0.85
Non-Hispanic Black 15.3 0.62
Hispanic 13.6 0.67
Others 6.7 0.43
Marital status
Married 58.7 0.65
Non-marrieda 32.3 0.61
Never married 9.0 0.35
Education category
< High School 26.0 0.57
High School 34.5 0.59
College or more 39.5 0.64
Insurance
Private 60.9 0.63
Public 31.4 0.58
Uninsured 7.7 0.26
MSA status
MSA 79.9 1.0
Census region
Northeast 18.1 0.66
Midwest 21.0 0.72
South 40.0 0.89
West 20.0 0.74
Income category
Poor income 19.9 0.48
Low income 16.3 0.40
Table 1Sample demographics among adults with diabetes
(n= 20,442,N= 18,157,187)(Continued)
Middle income 30.7 0.53
High income 33.1 0.64
Chronic conditions
Hypertension 72.8 0.50
CVD 31.7 0.58
Stroke 10.2 0.34
Emphysema 4.9 0.25
Joint pain 55.7 0.58
Arthritis 48.4 0.59
Asthma 13.7 0.38
Count of comorbidites
No comorbidity 10.4 0.35
≥1comorbidity 89.6 0.35
Year category
Year 2002/03 15.5 0.53
Year 2004/05 18.0 0.45
Year 2006/07 20.4 0.49
Year 2008/09 22.8 0.52
Year 2010/11 23.3 0.58
Nweighted sample size,nunweighted sample size,%weighted percentage
a
Table 2Mean and 95% CI unadjusted health care expenditures by quality of life (QOL) categories among adult with diabetes (reported as dollars in 2014)
Quartile 1 Quartile 2 Quartile 3 Quartile 4
Total expenditure, PCS
2002/03 $15,660 ($14,596, $16,724) $8,337 ($7,135, $9,538) $5,475 ($4,648, $6,302) $5,649 ($4,531, $6,767) 2004/05 $17,836 ($16,064, $19,609) $9,134 ($7,466, $10,803) $5,503 ($4,617, $6,389) $4,332 ($3,505, $5,159) 2006/07 $17,977
($16,475–$19,479)
$7,956 ($7,109, $8,803) $5,917 ($4,901, $6,934) $4,604 ($3,693, $5,515) 2008/09 $17,184 ($15,892, $18,475) $8,429 ($7,535, $9,322) $6,078 ($5,437, $6,719) $5,970 ($4,458, $ 7,482)
2010/11 $16,397
($15,209–$17,585)
$7,577 ($6,772, $8,382) $5,802 ($4,993, $6,610) $5,398 ($4,087, $6,709)
Pooled sample $17,043
($16,366, $17,721) $8,233 ($7,739, $8,727) $5,779 ($5,395, $6,192) $5,242 ($4,660, $5,825)
Total expenditure, MCS
2002/03 $15,123 ($13,833, $16,414) $11,348 ($9,755, $12,941) $9,414 ($7,978, $10,849) $8,890 ($7,961, $ 9,820)
2004/05 $16,015 ($14,165, $17,866) $14,327 ($11,279, $17,376) $10,384 ($8,720, $12,067) $9,451 ($8,256, $10,645) 2006/07 $15,482 ($14,109, $16,855) $11,215 ($9,843, $12,588) $11,467 ($9,173, $13,762) $10,722 ($9,306, $12,137) 2008/09 $15,743 ($14,115, $17,370) $11,957 ($10,644, $13,270) $8,811 ($7,607, $10,014) $10,691 ($9,407, $11,975) 2010/11 $15,455 ($14,085, $16,825) $10,269 ($9,053, $11,484) $9,826 ($8,244, $11,409) $9,140 (8,147–10,134)
Pooled sample $15,572
($14,864, $16,281) $11,729 ($10,931, $12,527) $9,955 ($9,176, $10,734) $9,845 ($9,325, $10,365)
Out-of-pocket expenditure, PCS
2002/03 $2,520 ($2,362, $2,677) $1,631 ($1,504, $1,757) $1,441 ($1,241, $1,642) $1,478 ($1,094, $1,861) 2004/05 $2,716
(2,395–3,038)
$1,953 (1,647–2,259)
$1,357 (1,191–1,522)
$996 ($771, $1,221) 2006/07 $2,103 ($1,950, $2,257) $1,590 ($1,436, $1,744) $1,255 ($1,100, $1,410) $1,135 ($965, $1,304) 2008/09 $1,875 ($1,692, $2,058) $1,347 ($1,212, $1,482) $1,097 ($857, $1,341) $1,137 ($777, $1,496) 2010/11 $1,551 ($1,410, $1,691) $1,278 ($1,149, $1,408) $1,121 ($991, $1,252) $1,011 ($808, $1,214)
Pooled sample $2,112
($2,015, $2,210) $1,523 ($1,442, $1,605) $1,238 ($1,152, $1,324) $1,123 ($995, $1,250)
Out-of-pocket expenditure, MCS
2004/05 $2,453 ($2,004, $2,901) $2,341 ($2,003, $2,680) $1,974 ($1,622, $2,326) $1,944 ($1,750, $2,138) 2006/07 $1,900 ($1,722, $2,078) $1,659 ($1,492, $1,827) $1,793 ($1,615, $1,971) $1,682 ($1,509, $1,856) 2008/09 $1,758 ($1,534, $1,983) $1,556 ($1,313, $1,799) $1,199 ($1,077, $1,321) $1,557 ($1,323, $1,791) 2010/11 $1,372 ($1,216, $1,528) $1,357 ($1,227, $1,487) $1,378 ($1,168, $1,589) $1,355 ($1,176, $1,534)
Pooled sample $1,935
pocket expenses for all quartiles of the mental component of QOL were more similar, but differences remained between the lowest and highest quartiles for total expenditures. The relationship between QOL quartiles and expenditures did not change significantly over time; however differences be-tween QOL quartiles and expenditures remained in the 10 year pooled data set. Those in the highest quartile of physical component of QOL spent on average $7,500 less than those in the lowest quartile. Similarly, those in the highest quartile of mental component spent on average $3,000 less than those in the lowest. The incremental effect of out-of-pocket
expenses for both components of QOL were comparatively small (less than $1,000). At the societal level, differences in total expenditures between those in the highest and lowest QOL quartiles totaled $54.6 billion for the physical compo-nent and $14.3 billion for the mental compocompo-nent (adjusted annual aggregate for the United States).
This study demonstrates the significant individual, clinical, and societal impact poor QOL has on patients with diabetes. Understanding how differences in a sub-jective measure of health, such as QOL, has on health-care expenditures helps reveal the burden of disease not reflected by using only behavioral and physiological measures. By investigating both total expenditures and out-of-pocket expenses, this study showed that payments made both by the individual, as well as by private insur-ance, Medicaid, Medicare and other sources differed based on the patient’s QOL score.
As QOL can be conceptualized to measure aspects of a pa-tient’s health not measurable by biologic measures, such as impact on partners or stress related to treatment, this finding supports the need to consider patient status and preference in the clinical process. The clinical implications of these find-ings suggest that the healthcare system as a whole, and not the patient alone, is impacted by differences in QOL and should devote resources to addressing it beyond simply treat-ing disease. By integrattreat-ing treatment methods that address patient QOL within diabetes management, healthcare expen-ditures may be significantly reduced while also improving clinical outcomes overtime. In addition, consideration of the social determinants of health influencing a patient can influ-ence their health related QOL and in turn their health condi-tion [38, 39]. This study is strengthened by examining trends in cost and QOL overtime. Trends indicate that the relation-ship between QOL and out-of-pocket expenses is shrinking, which may in part be related to changes in healthcare policy such as the Medicare Modernization Act which enacted pre-scription drug benefits, Medicare Part D effective in 2006, as well as adoption of the Affordable Care Act in 2010. How-ever, trends were not significant in out of pocket expendi-tures and the overall difference in total expendiexpendi-tures between those with the highest and lowest QOL remained similar across 10 years.
Other findings examining QOL and medical expenditures have found that the physical component as well as the mental component of QOL predicted cost related medica-tion underuse within diabetes populamedica-tions [20]. Piette and colleagues demonstrated that across those insured through private insurance, Medicaid, Medicare, and the non-insured, cost related non-adherence in patients with diabetes was nearly 3 times as high among the privately in-sured with multiple comorbidities and even higher among those insured by Medicaid, Medicare, or no insurance. Furthermore, both physical and mental components of QOL was significantly lower among those with multiple Table 3Two-part regression model: Incremental effects of
healthcare expenditures by QOL categories among adults with diabetes (reported as dollars in 2014)
Variables Unadjusted Incremental Cost and 95% CI
Adjusted Incremental Cost and 95% CI
Total expenditure, PCS
Quartile 1 (ref) –
Quartile 2 -$8,810*** (-$9,595, -$8,027)
-$5,313*** (-$6,063, -$4,562)
Quartile 3 -$11,264
(-$12,038, -$10,491)
-$6,994*** (-$7,868, -$6,120)
Quartile 4 -$11,800
(-$12,699, -$10,902)
-$7,499*** (-$8,402, -$6,596)
Total expenditure, MCS
Quartile 1 (ref) –
Quartile 2 -$3,843*** (-$4,870, -$2,815)
-$1,914*** (-$2,635, -$1,194)
Quartile 3 -$5,617*** (-$6,589, -$4,644)
-$3,104*** (-$3,824, -$2,383)
Quartile 4 -$5,727*** (-$6,576, -$4,877)
-$3,262*** (-$3,907, -$2,618)
Out-of-pocket expenditure, PCS
Quartile 1 (ref) –
Quartile 2 -$588*** (-$705, -$472)
-$408*** (-$529, -$287)
Quartile 3 -$873*** (-$1,002, -$744)
-$611*** (-$750, -$471)
Quartile 4 -$989 (-$1,146, -$831)
-$670*** (-$839, -$501)
Out-of-pocket expenditure, MCS
Quartile 1 (ref) –
Quartile 2 -$202** (-$346, -$56)
-$96 (-$213, $20)
Quartile 3 -$335*** (-$486, -$185)
-$286*** (-$407, -$165)
Quartile 4 -$286*** (-$432, -$140)
-$283*** (-$402, -$164)
Primary outcome variable in this regression model is total healthcare and OUT-OF-POCKET expenditures controlling for age, sex, race/ethnicity, marital status, education, health insurance, MSA, census region, income and a number of comorbid conditions (hypertension, CVD, stroke, emphysema, joint pain, arthritis and asthma)
comorbidities [20]. The current findings offer further sup-port that QOL is a key factor that may be influencing pa-tient outcomes and cost within diabetes care and other chronic illness. However, further research is needed to fully understand the direction of this relationship.
This study has some limitations. First, identification of diabetes and comorbid conditions were based on self-report and as such may be subject to participant bias, how-ever previous studies utilizing self-report disease conditions in national data sets have been shown to be reliable measures. Second, estimates of diabetes and other chronic illness may be higher than what is reported in this study due to the exclusion of institutionalized individuals as well as the population living with undiagnosed diabetes. Third, although two-part models are not always necessary when populations have a low number of zero cost, as is often the case for diabetes patients, we examined the proportion of zeros and it was 1% for total expenditures and 3% for out of pocket expenditures. While these numbers are relatively small, the study is designed to extrapolate to the entire US population, which means that small sample numbers trans-late to large population numbers. Additionally, because there is no information about whether the zero costs are truly non-users of care or those that received free care, we
chose to control for possible selection bias using the two-part model. Finally, this data is cross-sectional and there-fore cannot speak to causality. While data has been pooled over a ten-year time period to establish trends, these find-ings cannot be interpreted as longitudinal data.
Conclusion
Acknowledgements
Not applicable
Funding
This study was supported by the National Institute of Diabetes and Digestive and Kidney Diseases (grant K24DK093699, Principal Investigator: Leonard Egede, MD).
Availability of data and materials
The datasets generated and analyzed during the current study are available in the Agency for Healthcare Research and Quality (AHRQc). Medical Expenditure Panel Survey. 2011 Full year consolidated data file 2013c, Available from http:// meps.ahrq.gov/mepsweb/data_stats/download_data_files.jsp.
Authors’contributions
JC was a major contributor in writing the manuscript. KB analyzed and interpreted the data, and contributed to drafting the article. RW and LE were contributors to drafting the article and revised the article critically for important intellectual content. All authors were involved in conception and design and approved the final manuscript.
Competing interests
The authors declare that they have no competing interests.
Consent for publication
Not applicable
Ethics approval and consent to participate
This analysis used secondary data from the Medical Expenditures Panel Survey, as such all ethics approvals and consent to participate was waived.
Publisher’s Note
Springer Nature remains neutral with regard to jurisdictional claims in published maps and institutional affiliations.
Author details
1Center for Patient Care and Outcomes Research, Medical College of Wisconsin,
8701 Watertown Plank Road, Room H3165, Milwaukee WI 53226, USA.
2Department of Medicine, Division of General Internal Medicine, Medical
College of Wisconsin, 9200 W. Wisconsin Ave, Milwaukee WI 53226, USA.
3Center for Health Disparities Research, Department of Medicine, Medical
University of South Carolina, 135 Rutledge Avenue, Room 280, MSC 250593, Charleston SC 29425, USA.4Department of Medicine, Division of General
Internal Medicine and Geriatrics, Medical University of South Carolina, 171 Ashley Avenue, Charleston SC 29425, USA.
Received: 8 July 2016 Accepted: 5 April 2017
References
1. Centers for Disease Control and Prevention. National Diabetes Statistics Report. (2014). Retrieved from http://www.cdc.gov/diabetes/data/statistics/ 2014statisticsreport.html. Accessed 7 Apr 2017.
2. American Diabetes Association. National Diabetes Statistics Report. 2014. Retrieved from http://www.diabetes.org/diabetes-basics/statistics/. Accessed 7 Apr 2017.
3. Spanakis E, Golden S. Race/ethnic difference in diabetes and diabetic complications. Current Diabetes Report. 2013. doi:10.1007/s11892-013-0421-9. 4. Boyle J, Thompson T, Gregg E, Barker L, Williamson D. Projections of the
year 2050 burden of diabetes in the US adult population: dynamic modeling of incidence, mortality, and prediabetes prevalence. Popul Health Metrics. 2010;8:1–12.
5. Herman WH. The economics of diabetes prevention. Med Clin North Am. 2011;95:373–84.
6. Nichols GA, Glauber HS, Brown JB. Type 2 diabetes: incremental medical care costs during the 8 years preceding diagnosis. Diabetes Care. 2000;23:1654–9. 7. Ozieh MN, Bishu KG, Dismuke CE, & Egede LE. Trends in healthcare
expenditure in United States adults with diabetes: 2002–2011. Diabetes Care. 2015;38(10):1844–1851. https://doi.org/10.2337/dc15-0369. 8. Brown JB, Pedula KL, Bakst AW. The progressive cost of complications in
type 2 diabetes mellitus. Arch Intern Med. 1999;159:1873–80.
9. Caro JJ, Ward AJ, O’Brien JA. Lifetime costs of complications resulting from type 2 diabetes in the U.S. Diabetes Care. 2002;25:476–81.
10. Nichols GA, Arondekar B, Herman WH. Medical care costs one year after identification of hyperglycemia below the threshold for diabetes. Med Care. 2008;46:287–92.
11. Nichols GA, Arondekar B, Herman WH. Complications of dysglycemia and medical costs associated with nondiabetic hyperglycemia. Am J Manag Care. 2008;14:791–8.
12. U.K. Prospective Diabetes Study Group. Quality of life in type 2 diabetic patients is affected by complications but not by intensive policies to improve blood glucose or blood pressure control (UKPDS 37). Diabetes Care. 1999;22:1125–36.
13. Ragnarson Tennvall G, Apelqvist J. Health-related quality of life in patients with diabetes mellitus and foot ulcers. J Diabetes Complications. 2000;14: 235–41.
14. Glasziou P, Alexander J, Beller E, Clarke P, the ADVANCE Collaborative Group. Which health-related quality of life score? A comparison of alternative utility measures in patients with type 2 diabetes in the ADVANCE trial. Heath Qual Life Outcomes. 2007;5:21–31.
15. Anandacoomarasamy A, Caterson ID, Leibman S, Smith GS, Sambrook PN, Fransen M, March LM. Influence of BMI on health-related quality of life: comparison between an obese adult cohort and age-matched population norms. Obesity. 2009;17:2114–8.
16. Lee AJ, Morgan CL, Morrissey M, Wittrup-Jensen KU, Kennedy-Martin T, Currie CJ. Evaluation of the association between the EQ-5D (health-related utility) and body mass index (obesity) in hospital-treated people with Type 1 diabetes, Type 2 diabetes and with no diagnosed diabetes. Diabet Med. 2005;22:1482–6.
17. Sach TH, Barton GR, Doherty M, Muir KR, Jenkinson C, Avery AJ. The relationship between body mass index and health-related quality of life: comparing the EQ-5D, EuroQOL VAS and SF-6D. Int J Obes. 2007;31:189–96. 18. Redekop WK, Koopmanschap MA, Stolk RP, Rutten GE, Wolffenbuttel BH,
Niessen LW. Health-related quality of life and treatment satisfaction in Dutch patients with type 2 diabetes. Diabetes Care. 2002;25:458–63. 19. Coffey JT, Brandle M, Zhou H, Marriott D, Burke R, Tabaei BP, Engelgau MM,
Kaplan R, Herman WH. Valuing health-related quality of life in diabetes. Diabetes Care. 2002;25:2238–43.
20. Piette JD, Wagner TH, Potter MB, Schillinger D. Health insurance status, cost-related medication underuse, and outcomes among diabetes patients in three systems of care. Med Care. 2004;42:102–9.
21. Piette JD, Heisler M, Wagner TH. Problems paying out-of-pocket medication costs among older adults with diabetes. Diabetes Care. 2004;27:384–91. 22. Economic costs of diabetes in the U.S. In 2007. American Diabetes
Association Diabetes Care. 2008; 31(3):596-615.
23. Huang ES, Brown SE, Ewigman BG, Foley EC, Meltzer DO. Patient perceptions of quality of life with diabetes-related complications and treatments. Diabetes Care. 2007;30:2478–83.
24. Agency for Healthcare Research and Quality (AHRQa). Methodology report # 27, Sample design of the 2011 medical expenditure panel survey insurance component. 2013a. Available from: http://meps.ahrq.gov/data_files/ publications/mr27/mr27.pdf. Accessed 22 Aug 2014.
25. Agency for Healthcare Research and Quality (AHRQb). Medical expenditure panel survey, 2011 medical conditions. 2013b. Available from: http://meps. ahrq.gov/mepsweb/data_stats/download_data/pufs/h146/h146doc.pdf. Accessed 20 Aug 2014.
26. Agency for Healthcare Research and Quality (AHRQc). Medical expenditure panel survey. 2011 full year consolidated data file. 2013c. Available from: http://meps.ahrq.gov/mepsweb/data_stats/download_data_files.jsp. Accessed 18 Aug 2014.
27. CPI Inflation Calculator. Washington, DC, U.S. Bureau of Labor Statistics. Available from: http://data.bls.gov/cgi-bin/cpicalc.pl. Accessed 15 July 2015. 28. Galbraith AA, Wong ST, Kim SE, Newacheck PW. Out-of-pocket financial
burden for low-income families with children: socioeconomic disparities and effects of insurance. Health Serv Res. 2005;40:1722–36.
29. Nash D, Magder L, Lustberg M, Sherwin RW, Rubin RJ, Kaufmann RB, Silbergeld EK. Blood lead, blood pressure, and hypertension in Perimenopausal and postmenopausal women. JAMMA. 2003;289:1523–32. 30. Wang R, Lagakos SW, Ware JH, Hunter DJ, Drazen JM. Statistics in
medicine-reporting of subgroup analysis in clinical trials. N Engl J Med. 2007;357(21):2189–94. 31. Cameroon AC, Trivedi PK. Microeconometrics using stata. revisedth ed.
32. Manning WG, Mullahy J. Estimating log models: to transform or not to transform? J Health Econ. 2001;20:461–94.
33. Belotti F, Deb P, Manning WG, Norton EC. Tpm: estimating two-part models. Stata J. 2012;5:1–13.
34. Mihaylova B, Briggs A, O’Hhagan, Thompson SG. Review of statistical methods for analyzing healthcare resources and costs. Health Econ. 2011;20:897–916. 35. Egede LE, Walker RJ, Bishu K, Dismuke CE. Trends in costs of depression in
adults with diabetes in the United States: medical expenditure panel survey, 2004-2011. J Gen Intern Med. 2016;31(6):615–22.
36. Blakesley RE, Mazumdar S, Dew MA, Houck PR, Reynolds 3rd CF, Butters MA. Comparisons of methods for multiple hypothesis testing in
neuropsychological research. Neuropsychology. 2009;23:255–64. 37. Ozkaya G, Ercan I. Examining multiple comparison procedures according to
error rate, power type and false discovery rate. J Mod App Stat Methods. 2012;11:348–60.
38. Kivits J, Erpelding ML, Guillemin F. Social determinants of health-related quality of life. Rev Epidemiol Sante Publique. 2013;61 Suppl 3:S189–94. 39. Walker RJ, Williams JS, Egede LE. Influence of race, ethnicity, and social determinants of health on diabetes outcomes. Am J Med Sciences. 2016; 351(4):366–73.
• We accept pre-submission inquiries
• Our selector tool helps you to find the most relevant journal
• We provide round the clock customer support
• Convenient online submission
• Thorough peer review
• Inclusion in PubMed and all major indexing services
• Maximum visibility for your research
Submit your manuscript at www.biomedcentral.com/submit