R E S E A R C H
Open Access
Iron-related dietary pattern increases the
risk of poor cognition
Zumin Shi
1*, Tahra El-Obeid
1, Ming Li
2, Xiaoyue Xu
3and Jianghong Liu
4Abstract
Introduction:High iron intake has been shown to be associated with poor cognition. We aimed to examine the association between iron-related dietary pattern (IDP) and cognitive function in Chinese adults.
Method:Longitudinal study data from the China Health and Nutrition Survey (CHNS) during 1991–2006 were used (N= 4852,≥55 years old). Dietary intake was obtained from a 3-day food record during home visits. Reduced rank regression was used to construct IDP with iron intake as a response variable. Cognitive function was assessed in 1997, 2000, 2004 and 2006. Multivariable mixed linear regression and logistic regression were used in the analyses.
Results:IDP was characterised by high intake of fresh vegetable, wheat, legume, beverage, offal, rice and whole grain. High IDP intake was associated with poor cognition. In fully adjusted models, across the quartiles of IDP, the odds ratio (95% CI) for poor cognitive function were: 1.00, 1.06 (0.86–1.30), 1.24 (0.99–1.54), and 1.50 (1.17–1.93), respectively. There was a borderline significant interaction between IDP and meat intake (p interaction 0.085). The association between high IDP and poor cognition was only observed among those with no or low intake of meat. With the adjustment of carbohydrate or iron intake, the IDP and cognition association became non-significant. IDP was positively associated with lead intake. The association between IDP and poor cognition was partly mediated by lead intake.
Conclusions:Iron-related dietary pattern is associated with poor cognition in Chinese adults, partly due to high intake of carbohydrate, iron and lead.
Keywords:Cognitive function, Dietary pattern, Lead intake, Chinese, Adults
Introduction
Worldwide, dementia was estimated to affect 35.6 mil-lion people in 2010, and this number is expected to reach 115.4 million by 2050 [1]. It affects approximately 9.5 million adults aged 60 years and above in China [2]. As there is still no effective treatment to delay the pro-gression of dementia, identifying modifiable risk factors other than hypertension, diabetes and stroke that can be used in the early prevention is urgently needed. The role of diet on cognitive decline and dementia has increas-ingly attracted attention [3,4].
Many nutrients (e.g. fiber, carbohydrate, protein, docosa-hexaenoic acid (DHA)) and foods (e.g. alcohol, nuts, fish) have been assessed for their potential effects on cognition [4]. The traditional single nutrient and disease association
approach does not consider the possible synergy or inter-action between nutrients. The use of dietary pattern using either a priori (e.g. healthy eating index, Mediterranean diet score) or a posterior (e.g. factor analysis, cluster analysis) approach is becoming popular in nutritional epidemiology [5]. While a high proportion of studies uses factor analysis to construct dietary pattern, there is also an increasing number of studies using Reduced Rank Regression (RRR) to construct dietary pattern [6]. The advantage of RRR method is that it uses biomarkers or nutrients as intermedia responses so that it can explore the potential mediation effects of diet on disease [6].
Similar to the studies in Western countries [7], several studies in Asia suggested a link between dietary patterns and cognition among older adults. For example, in Korea, using RRR method with responses regarding vitamin B6, vitamin C, and iron intakes, a dietary pattern characterized by high intake of seafood, vegetables, fruits, bread, snacks,
© The Author(s). 2019Open AccessThis article is distributed under the terms of the Creative Commons Attribution 4.0 International License (http://creativecommons.org/licenses/by/4.0/), which permits unrestricted use, distribution, and reproduction in any medium, provided you give appropriate credit to the original author(s) and the source, provide a link to the Creative Commons license, and indicate if changes were made. The Creative Commons Public Domain Dedication waiver (http://creativecommons.org/publicdomain/zero/1.0/) applies to the data made available in this article, unless otherwise stated.
* Correspondence:zumin@qu.edu.qa
1Human Nutrition Department, College of Health Science, QU Health, Qatar
University, Doha, Qatar
soy products, beans, chicken, pork, ham, egg, and milk was found to be associated with a decreased risk of mild cognitive impairment [8]. A diet with high intakes of vege-tables, soy products, fruit, and fish may have a beneficial effect on cognitive function in older Japanese people using the similar approach [9].
There is increasing evidence from epidemiological studies suggesting the link between high iron levels and chronic diseases including dementia. Basic science also demonstrates that iron accumulation in the brain in-creases with age [10]. In the Western countries, higher dietary iron intake has been found to be associated with higher risk for Parkinson disease [11,12]. In many coun-tries, it has been shown that high iron levels increases the risk for diabetes [13], which is linked to cognitive impairment [14]. Despite these initial findings, the asso-ciation between iron intake and cognition among older adults is inconsistent, as both positive [15,16] and nega-tive [17] associations have been reported.
Additionally, studies have shown that the modern Western diet with higher simple carbohydrates and satu-rated fat intake is correlated with cognitive impairment [18]. Conversely, clinical intervention studies of very low carbohydrate (5–10% of total calories) consumption shows improved verbal memory in the elderly [19] as well as improved overall cognitive performance in adults with type 2 diabetes [20,21].
Furthermore, cognitive impairment has been found to be associated with both occupational and non-occupational lead exposure as indicated by blood and bone lead [22]. In the general population, diet is a major source of heavy metals in human body [23]. However, the number of studies on the association between dietary pattern and heavy metal contamination is limited. Lead levels have been implicated in impaired cognitive func-tion across the lifespan [24]. It is unknown whether the association between dietary pattern and cognitive im-pairment is mediated by heavy metal contamination. We have recently reported a positive association between high iron intake and poor cognition among Chinese adults [17]. However, given the possible interaction ef-fects between nutrients, it is important to look at overall dietary pattern rather than a single nutrient. Iron intake could be marker of other unmeasured factors. In China, the major source of dietary iron is from plant-based food. At the same time, lead contamination on plant-based food is of concern. For example, data from a large surveillance system in China suggested that 6.4% of cereal grain and pulse samples had lead concentration exceeding the maximum level of 0.2 mg/kg [25]. Lead in-take has been found to be positively associated with all-cause mortality [26]. Plant-based food is also the major source of carbohydrate. Furthermore, exposure to lead has been consistently associated with cognitive impairment
across the lifespan [27,28] and has been demonstrated to reduce cognitive function in older adults [29,30]. Thus, in the current study, we aimed to assess the iron related diet-ary pattern using RRR method and cognition among Chinese adults attending China Health and Nutrition Sur-vey (CHNS). The second aim of the study was to test whether the association between the dietary pattern and cognition was mediated by lead or carbohydrate intake.
Methods
Study design and study sample
This study used repeated measurements of dietary intake and cognitive function over 15 years since 1991, from the CHNS [31,32].The CHNS study is an ongoing open prospective household-based cohort study conducted in nine provinces covering both urban and rural areas spanning across Northern to Southern China. Nine waves of data collection (i.e. 1989, 1991, 1993, 1997, 2000, 2004, 2006, 2009, and 2011) have been conducted. Cognitive screen tests were conducted among those above age 55 years in 1997, 2000, 2004 and 2006 surveys. In total, 4852 participants attended the cognitive screen tests between 1997 and 2006 (Additional file 1: Figure S1). Participants who completed at least one cognitive screen test were included in the analysis. Of these partic-ipants, 3302 attended the screen test in at least two sur-veys. The survey was approved by the institutional review committees of the University of North Carolina (USA) and the National Institute of Nutrition and Food Safety (China). Informed consent was obtained from all participants. The response rate based on those who partici-pated in 1989 and remained in the 2006 survey was > 60%.
Outcome variable: cognitive function
count test, the participants were asked to do five con-secutive subtractions of 7 from 100. Each correct sub-traction was given a score of 1. Finally, the participants were asked to recall the 10-word list tested before. Each recalled word was given a score of 1. In our study, we choose the first quintile of the cognitive function test score as poor cognitive function, which corresponds to a global cognitive function score cut off of < 7. The cutoff was selected based on a study in Shanghai which showed that the prevalence of mild cognitive impairment among people aged 60 and above was 20% [34].
Exposure variables: Iron related dietary pattern (IDP) and lead
Iron related dietary pattern
Individual food intake was recorded on three consecu-tive days by a trained investigator at each wave. In the 3-day dietary survey, foods and condiments in the home inventory, foods purchased from markets or picked from gardens, and food waste were weighed and recorded. Nutrients intakes including iron and carbohydrate were calculated based on the average of 3-day food consump-tion data using the Chinese Food Composiconsump-tion Table [35] . The dietary assessment method has been validated for energy intake [36]. Based on similar nutrient profiles or culinary use, food intake were collapsed into 35 food groups, and average food intake for individuals (gram/day) calculated for each wave. Soft drinks, fruit juice and tea are categorised as beverage. The food groups are similar to the food items used in a validated food frequency ques-tionnaire used in a 2002 Chinese national nutrition survey. The detailed description of the dietary measurement has been provided in the previous publication [31].
IDP was constructed using RRR analysis with the in-takes of 35-collapsed food groups as input variables. PROC PLS statement in SAS (SAS Institute Inc., Cary, North Carolina) was used to conduct RRR analysis using iron intake as the response variable [6]. As there was only one response variable, one iron-related dietary pat-tern was extracted. IDP scores were calculated as the sum of the products of the factor loading coefficients and standardized daily intake of each food group associ-ated with the pattern. We calculassoci-ated a cumulative aver-age IDP score at each time period to reduce variation within individuals and to represent long term habitual intake [37]. For example, the 1991 intake was used for the follow-up between 1991 and 1993, the average of the 1991 and 1993 intake was used for the follow-up between 1997 and 2000, and so on. Details on cumulative average IDP are illustrated on Additional file1: Figure S1. In the sensitivity analysis, we also assessed the association be-tween most recent IDP and cognitive function. In sensitiv-ity analyses, we excluded 1991 and 1993 IDP as cognitive function test was not conducted in these surveys. As the
main findings did not change, we decided to include 1991 and 1993 dietary data in our analysis.
Lead
Dietary lead of each participant was estimated based on the food intake described above and calculated using published food lead concentration data (mean lead in each food category) from Jiangsu Province (one of the nine provinces in CHNS) [23]. The lead concentration (μg/d) table was based on lead measurements in 2077 food samples from 23 food categories during 2007–2010.
Covariates
Height, weight, and blood pressure were measured at each wave. Overweight/obesity was defined as BMI≥24 kg/m2 [38]. Hypertension was defined as systolic blood pressure above 140 mmHg and/or diastolic blood pres-sure above 90 mmHg, or having known hypertension.
The following constructed sociodemographic variables were used: education (low: illiterate/primary school; medium: junior middle school, and high: high middle school or higher), per capita annual family income (recoded into tertiles as low, medium and high), urbanization levels [31] (recoded into tertiles as low, medium and high).
Physical activity level (Metabolic Equivalent of Task, (MET)) was estimated based on self-reported daily activ-ities (including occupational, domestic, transportation, and leisure time physical activity) and duration using a Compendium of Physical Activities [39]. Smoking status was categorized into non-smokers, ex-smokers and current smokers. Alcohol drinking was categorized as yes or no. Self-reported diabetes and stroke were coded as yes or no.
Statistical analysis
the multivariable models were known to be associated with cognition including socioeconomic status, lifestyle factors and chronic conditions. We chose these variables as covariates because they are both associated with food intake and importantly with cognitive function. Scatter plots were used to visually present the association between IDP and lead intake in 1997, 2000, 2004 and 2006 surveys. To assess the association between cumulative IDP and the risk of poor cognitive function, we used mixed effect logistic regression adjusting for covariates the same as model 3 mentioned above. In sensitivity analyses, we also stratified our analysis by total meat intake (includ-ing pork, beef and poultry, above or below 50 g/d). To test the interaction between IDP and BMI, hypertension, meat intake and income on the association with poor cognition, a product term of each of the two variables was put in the regression model. All the analyses were performed using STATA 15.1 (Stata Corporation, Col-lege Station). Statistical significance was considered whenp< 0.05 (two sided).
Results
IDP derived using RRR methods with iron as a response variable was characterized by high loadings of fresh vegetable, wheat, legume, beverage (i.e. soft drinks, fruit juice and tea), offal, rice and whole grain (Fig. 1). The pattern explained 36.4% of the variation of iron intake. The intake of offal was low between 1991 and 2006 (mean 3.1 g/d, SD 15.4, more than 90% were non-consumers during the 3-day survey). The intake of rice, wheat, legume and fresh vegetable contributed 25.5, 25.0, 1.2 and 15.7% of the total iron intake, respectively.
Table 1 shows the sample characteristics among par-ticipants attending the first cognitive function test by quartiles of IDP. Across the quartiles of IDP, the intake of energy, protein, fat, carbohydrate, wheat, rice and fresh vegetable increased. However, there was no differ-ence of fruit intake across quartiles of IDP. IDP was positively associated with smoking, alcohol drinking and physical activity level but inversely associated with age. The mean cumulative intake of iron in the high quartile of IDP was 31.0 mg (SD 12.2) as compared with 15.8 mg (SD 6.2) in the first quartile. IDP was significantly posi-tively associated with lead intake (Fig.2).
The mean global cognition score was 12.1 (SD 6.8) in 1997. The prevalence of poor cognition ranged from 19.8 to 23.1% in the four waves of survey between 1997 and 2006. The annual cognitive function score decline was 0.1 (95% CI 0.07, 0.13).
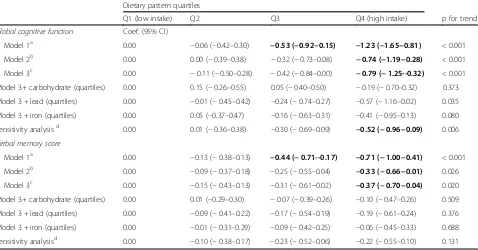
IDP was related to cognitive function decline in a dose-response manner (Table 2). The difference in cognitive function between quartile 4 and quartile 1 of IDP was− 1.23 after adjusting for age, gender and energy intake. In the fully adjusted model, across quartiles of IDP, the
regression coefficients (95% CI) were: 0, −0.11 (−0.50, 0.28),−0.42 (−0.84, 0.00), and−0.79 (−1.25,−0.32), re-spectively. A similar positive association between IDP and memory decline was observed. The regression coefficients for memory across quartiles of IDP were: 0,−0.15 (−0.43, 0.13), −0.31 (−0.61, −0.02), and−0.37 (−0.70, −0.04), respectively. The associations between IDP and memory decline were attenuated and became statistically not sig-nificant after further adjustment of cumulative carbohy-drate or iron intake. Similarly, the associations between IDP and memory decline were attenuated after adjustment for lead intake. This suggests the mediating effect of carbohydrates and lead in the relationship between IDP and cognition. Both carbohydrate and lead intake were
Table 1Sample characteristics of Chinese adults aged≥55 years old at the first cognitive function test by quartiles of iron related dietary pattern (N= 4685)
Q1 Q2 Q3 Q4 p-value
N= 1150 N= 1128 N= 1161 N= 1246
Energy intake (kcal/d) 1625.8 (440.6) 2028.5 (1057.2) 2196.2 (552.1) 2516.4 (799.3) < 0.001
Fat intake (g/d) 56.5 (30.3) 71.0 (112.6) 70.7 (36.2) 72.8 (58.6) < 0.001
Protein intake (g/d) 47.1 (14.6) 60.0 (17.2) 67.1 (20.5) 78.4 (28.5) < 0.001
Carbohydrate intake (g/d) 229.1 (69.9) 282.3 (80.1) 316.2 (88.9) 377.5 (121.5) < 0.001
Most recent iron intake (mg/d) 13.8 (7.2) 18.1 (7.3) 21.2 (11.0) 26.8 (15.2) < 0.001
Cumulative iron intake (mg/d) 15.8 (6.2) 21.2 (6.6) 24.5 (9.4) 31.0 (12.2) < 0.001
Intake of fruit (g/d) 22.6 (69.4) 23.8 (73.8) 23.9 (83.9) 22.7 (90.2) 0.97
Intake of fresh vegetable (g/d) 183.8 (103.5) 254.4 (132.4) 298.4 (155.6) 352.3 (234.9) < 0.001
Intake of rice (g/d) 190.9 (116.7) 232.1 (140.5) 252.9 (163.5) 237.7 (207.9) < 0.001
Intake of wheat (g/d) 84.4 (90.9) 107.9 (110.8) 140.3 (138.3) 227.8 (226.3) < 0.001
Intake of meat (g/d) 56.0 (58.1) 77.8 (74.4) 80.6 (83.4) 77.1 (102.3) < 0.001
Age (years) 67.8 (9.0) 63.1 (7.3) 62.0 (6.8) 60.9 (6.1) < 0.001
Sex < 0.001
Men 356 (31.0%) 499 (44.2%) 594 (51.2%) 799 (64.1%)
Women 794 (69.0%) 629 (55.8%) 567 (48.8%) 447 (35.9%)
Education 0.002
Low 727 (77.5%) 735 (70.7%) 773 (71.8%) 832 (70.7%)
Medium 105 (11.2%) 158 (15.2%) 163 (15.1%) 202 (17.2%)
High 106 (11.3%) 146 (14.1%) 141 (13.1%) 142 (12.1%)
Urbanization < 0.001
Low 224 (19.5%) 218 (19.3%) 282 (24.3%) 468 (37.6%)
Medium 274 (23.8%) 325 (28.8%) 368 (31.7%) 352 (28.3%)
High 652 (56.7%) 585 (51.9%) 511 (44.0%) 426 (34.2%)
Smoking < 0.001
Non-smoker 879 (76.8%) 796 (70.7%) 765 (65.9%) 709 (57.0%)
Ex-smokers 42 (3.7%) 33 (2.9%) 36 (3.1%) 66 (5.3%)
Current smokers 224 (19.6%) 297 (26.4%) 359 (30.9%) 469 (37.7%)
Survey year < 0.001
1997 561 (48.8%) 537 (47.6%) 500 (43.1%) 514 (41.3%)
2000 210 (18.3%) 171 (15.2%) 186 (16.0%) 207 (16.6%)
2004 246 (21.4%) 239 (21.2%) 284 (24.5%) 324 (26.0%)
2006 133 (11.6%) 181 (16.0%) 191 (16.5%) 201 (16.1%)
Alcohol drinking (yes) 241 (21.4%) 305 (27.6%) 390 (34.0%) 498 (40.7%) < 0.001
Physical activity (MET, hours/week) 58.1 (75.9) 87.2 (101.0) 91.3 (98.8) 111.9 (109.5) < 0.001
BMI (kg/m2) 22.8 (3.8) 23.2 (3.7) 23.1 (3.5) 23.1 (3.4) 0.075
BMI≥24 kg/m2 367 (34.9%) 408 (39.2%) 412 (37.9%) 407 (35.8%) 0.15
Hypertension (yes) 447 (41.2%) 375 (35.5%) 363 (32.8%) 375 (32.3%) < 0.001
Diabetes (yes) 45 (4.0%) 36 (3.2%) 29 (2.6%) 39 (3.2%) 0.29
Stroke (yes) 34 (3.0%) 19 (1.7%) 18 (1.6%) 28 (2.3%) 0.082
Fig. 2Association between iron-related dietary pattern and lead intake
Table 2Regression coefficients (95% CI) for cognitive function by quartiles of iron related dietary pattern among Chinese adults aged≥55 years old attending China Health and Nutrition Survey (N= 4852) between 1997 and 2006
Dietary pattern quartiles
Q1 (low intake) Q2 Q3 Q4 (high intake) p for trend
Global cognitive function Coef. (95% CI)
Model 1a 0.00
−0.06 (−0.42–0.30) −0.53 (−0.92--0.15) −1.23 (−1.65--0.81) < 0.001
Model 2b 0.00 0.00 (
−0.39–0.38) −0.32 (−0.73–0.08) −0.74 (−1.19--0.28) < 0.001
Model 3c 0.00
−0.11 (−0.50–0.28) −0.42 (−0.84–0.00) −0.79 (−1.25--0.32) < 0.001 Model 3+ carbohydrate (quartiles) 0.00 0.15 (−0.26–0.55) 0.05 (−0.40–0.50) −0.19 (−0.70–0.32) 0.373
Model 3 + lead (quartiles) 0.00 −0.01 (−0.45–0.42) −0.24 (−0.74–0.27) −0.57 (−1.16–0.02) 0.035
Model 3 + iron (quartiles) 0.00 0.05 (−0.37–0.47) −0.16 (−0.63–0.31) −0.41 (−0.95–0.13) 0.080
Sensitivity analysisd 0.00 0.01 (−0.36–0.38) −0.30 (−0.69–0.09) −0.52 (−0.96--0.09) 0.006
Verbal memory score
Model 1a 0.00 −0.13 (−0.38–0.13) −0.44 (−0.71--0.17) −0.71 (−1.00--0.41) < 0.001
Model 2b 0.00 −0.09 (−0.37–0.18) −0.25 (−0.55–0.04) −0.33 (−0.66--0.01) 0.026
Model 3c 0.00 −0.15 (−0.43–0.13) −0.31 (−0.61--0.02) −0.37 (−0.70--0.04) 0.020
Model 3+ carbohydrate (quartiles) 0.00 0.01 (−0.29–0.30) −0.07 (−0.39–0.26) −0.10 (−0.47–0.26) 0.509
Model 3 + lead (quartiles) 0.00 −0.09 (−0.41–0.22) −0.17 (−0.54–0.19) −0.19 (−0.61–0.24) 0.376
Model 3 + iron (quartiles) 0.00 −0.01 (−0.31–0.29) −0.09 (−0.42–0.25) −0.06 (−0.45–0.33) 0.688
Sensitivity analysisd 0.00
−0.10 (−0.38–0.17) −0.23 (−0.52–0.06) −0.22 (−0.55–0.10) 0.131
Regression coefficients and 95% CI were estimated with mixed effect regression models with different levels of adjustment
a
Model 1 adjusted for age, gender and energy intake
b
Model 2 further adjusted for intake of fat, smoking, alcohol drinking, income, urbanicity, education, and physical activity
c
Model 3 further adjusted for BMI and hypertension
d
inversely associated with cognitive function (data not shown).
In sensitivity analyses, the above association between IDP and cognition did not change after excluding those with a global cognitive function score below 4 or further adjusting for diabetes or stroke or lead intake.
However, no association between most recent IDP and cognition was found in multivariable mixed model (Additional file1: Tables S1 and S2).
A borderline significant interaction (p= 0.085) between IDP and meat intake in relation to cognitive function was found (Table 3). The positive association between IDP and cognitive function decline was only observed among those with no or low intake of meat. Among those with meat intake < 50 g/d, there was a significant increase of odds ratio (OR) (95% CI) for global cognition score below 7 across quartiles of IDP: 1.00, 1.13 (0.83–1.53), 1.28 (0.93–1.76), and 1.93 (1.36–2.75), respectively. There were no significant interactions with urban-rural residence, overweight/obesity, hypertension, and gender.
When we limited the analyses to those who took the cognitive tests in at least two waves of survey, the
findings remained unchanged. Intake of lead was posi-tively associated with global cognition score < 7. How-ever, adjusting for lead intake did not change the association between IDP and cognition.
In fully adjusted models, across the quartiles of IDP intake the OR (95% CI) for global cognition score < 7 were: 1.00, 1.06 (0.86–1.30), 1.24 (0.99–1.54), and 1.50 (1.17–1.93), respectively. The association became statis-tically insignificant after further adjustment of cumula-tive carbohydrate intake.
Discussion
In this prospective cohort study of adults aged≥55 years from CHNS, using RRR method we derived an iron-related dietary pattern characterized by a high intake of fresh vegetable, wheat, legumes, beverage, offal, rice and whole grain. A high intake of this predominantly plant-based IDP was associated with poor cognitive function. Meat consumption modified the association between IDP and cognition. The association between IDP and poor cognitive function was mainly seen among those with a low intake of meat but not those with a high
Table 3Odds ratio (95% CI) for global cognitive score below 7 across quartiles of iron related dietary pattern among Chinese adults aged≥55 years old by characteristics, China Health and Nutrition Survey (N= 4852) between 1997 and 2006a
Q1 Q2 Q3 Q4 p for interaction
Coef. (95% CI)
Overall sample 1.00 1.06 (0.86–1.30) 1.24 (0.99–1.54) 1.50 (1.17–1.93)
Overweight/obesity
No 1.00 1.07 (0.83–1.39) 1.26 (0.96–1.66) 1.54 (1.13–2.10) 0.997
Yes 1.00 1.06 (0.75–1.50) 1.26 (0.87–1.82) 1.53 (1.00–2.34)
Hypertension
No 1.00 1.06 (0.82–1.37) 1.21 (0.92–1.59) 1.59 (1.17–2.15) 0.766
Yes 1.00 1.01 (0.73–1.40) 1.27 (0.89–1.80) 1.34 (0.89–2.02)
Income
Low 1.00 1.24 (0.89–1.74) 1.24 (0.86–1.78) 1.32 (0.88–1.98) 0.330
Medium 1.00 0.79 (0.55–1.13) 1.03 (0.71–1.49) 1.42 (0.93–2.17)
High 1.00 1.09 (0.73–1.62) 1.49 (0.96–2.31) 1.84 (1.12–3.02)
Gender
Men 1.00 1.27 (0.83–1.95) 1.59 (1.04–2.44) 2.10 (1.35–3.29) 0.497
Women 1.00 1.00 (0.78–1.27) 1.11 (0.85–1.45) 1.24 (0.90–1.70)
Urbanization
Low 1.00 1.52 (0.97–2.39) 1.24 (0.78–1.98) 1.94 (1.21–3.11) 0.323
Medium 1.00 0.95 (0.63–1.41) 1.25 (0.82–1.89) 1.29 (0.80–2.08)
High 1.00 0.94 (0.70–1.25) 1.21 (0.88–1.67) 1.33 (0.89–1.98)
Meat intake
< 50 g/d 1.00 1.13 (0.83–1.53) 1.28 (0.93–1.76) 1.93 (1.36–2.75) 0.085
≥50 g/d 1.00 1.00 (0.75–1.32) 1.17 (0.86–1.59) 1.05 (0.73–1.52)
a
Mixed effect logistic modes adjusted for age, gender, intake of energy and fat, smoking, alcohol drinking, income, urbanicity, education, and physical activity, BMI and hypertension. Stratification variables were not adjusted in the corresponding models
intake of meat. The dietary pattern was also highly asso-ciated with lead, iron and carbohydrate intake. Our study suggests that the association between IDP and cognitive function may be mediated partly by iron, lead and carbohydrate intake in the Chinese population.
This is the first study using RRR method to construct dietary pattern with iron as an intermediate response variable. The dietary pattern approach used in the study helps to understand the complex nature of nutritional epidemiological studies. Our study shows that the single nutrient approach commonly used in the traditional epi-demiological research can be confounded by many un-measured factors. The current study of iron-related dietary pattern further confirms our previous findings on the association between iron intake and cognitive function [17]. The intake of iron in the fourth quartiles of IDP was 31 mg/d which is 2.5 times the recom-mended iron intake (i.e. 12 mg/d) for Chinese adults. Compared with the relationship between iron intake and poor cognition, the association between IDP and poor cognition showed a clearer dose response positive asso-ciation. Specifically, across quartiles of iron intake, the OR for poor cognition were 1.00, 1.06 (0.87, 1.30), 1.09 (0.88, 1.35) and 1.30 (1.04, 1.64), respectively. The corre-sponding figures were 1.00, 1.06 (0.86–1.30), 1.24 (0.99– 1.54), and 1.50 (1.17–1.93) across quartiles of iron re-lated dietary pattern.
The focus on the link between iron intake and cogni-tion can be dated back to 1956, when Harman hypothe-sized that free non-heme iron is a major contributor of neural and cognitive aging [40]. The evidence has been synthesized in several recent reviews showing the important role of iron in neurodegenerative diseases, as a redox-active ion that can cause oxidative stress in the cell [11,41] Iron intake is related to iron deposits in the brain in animal studies [42], which may increase oxidative stress in the brain. In animal models, iron chelation has been shown to be effective in treating neurodegenerative diseases, such as Parkinson’s and Alzheimer’s diseases [41].
Some components of our IDP (fresh vegetables, legumes and whole grain) were similar with Mediterranean diet. However, our IDP also differ from the Mediterranean diet as it does not have high loadings of fish and nuts, which have showed beneficial role for cognition function [43,44]. Overall, the beneficial effects of Mediterranean diet on cog-nition has been well documented [7]. Traditional Chinese diet has similarity to the Mediterranean diet as shown by its high intake of vegetable, whole grains, and vegetable oil. In CHNS, Qin et al found that those with a high adapted Mediterranean diet score were associated with a slower cognitive decline [45]. The main contributors of the ob-served association were fish, fruits and lower intake of animal-source cooking fats from the aforementioned Medi-terranean diet. However, the intake of vegetable, legume,
fiber-rich grains showed no benefits on cognition. In Hong Kong, no association between Mediterranean diet and cog-nition was found [46].
The interaction between IDP and meat consumption is intriguing. The positive association between IDP and poor cognition was only found among those with no or a low meat intake, suggesting the importance of a bal-anced diet. This finding is also supported by the current knowledge on the importance of protein-rich diet for peoples’ health in addition to plant/vegetable consump-tion. Previous studies have shown the beneficial role of the higher-protein diets, which improve adiposity, blood pressure and triglyceride levels, which are in turn related to cognitive impairment disorders such as Alzheimer’s and Parkinson’s [47]. There is growing interest in the as-sociation between a protein-rich diet and cognition in the epidemiology studies. For example, our findings are consistent with another study using CHNS data. Xu et al found that protein-rich dietary pattern (high intake of milk, eggs and soymilk) was positively but a starch-rich dietary pattern (high intake of salted vegetable, whole grain and legumes) was inversely associated with global cognition in CHNS [48].
High carbohydrate intake was associated with poor cognition in our study and explained the association be-tween IDP and cognition. This finding is supported by several studies. For example, a low glycemic index (GI) breakfast has been shown to be in favour of cognitive performance later in the morning among adults [49]. Low carbohydrate diet has been shown to be beneficial for cognition function among older adults with mild cognitive impairment [19]. Among diabetic patients, a low-GI carbohydrate meal is associated with better cog-nitive performance than a high GI meal [21].
Food heavy metal contamination (e.g. lead, cadmium and arsenic) has been a greater public concern in China due to environmental pollution [50]. The mean dietary lead intake in the Chinese population was estimated to be 73.9μg/d [25]. In the current study, IDP was highly correlated with lead intake. Lead intake is a known risk factor for poor cognition. It may explain the association between IDP and poor cognition. The positive associ-ation between IDP and cognition may suggest a collect-ive effect of high iron and heavy metals. As IDP was inversely associated with CRP in 2009 (data not shown), the association between IDP is unlikely to be mediated by inflammation.
be varied by regions. However, the estimation of lead in-take only serves the purpose to explore the possible ex-planation of the link between IDP and cognition. Under-reporting of diabetes is another limitation. We were un-able to test whether diabetes mediates the association between IDP and cognition. Furthermore, we do not have occupational information, which has been linked to cognitive impairment. Nevertheless, education levels and physical activities were accounted for. The strength of the study is the repeated measure of dietary intake over a long period of time. We are able to adjust for several confounding factors.
Conclusion
Iron related diet may increase the risk of poor cognition. This link is particularly strong for individuals with no or low meat consumption, underscoring the importance of a balanced diet. The link may be partly explained by a high intake of lead, iron and carbohydrate. As the burden of obesity and other non-communicable diseases increase, people are increasingly seeking a plant-based diet to man-age body weight. Intake of adequate animal food is needed to prevent cognition decline among those with a high in-take of plant-based diet. The role of iron and heavy metal contamination on cognition needs further investigation.
Additional file
Additional file 1:Figure S1.Sample flowchart of participants attending China Health and Nutrition Survey.Table S1.Regression coefficients (95% CI) for cognitive function by quartiles of recent iron related dietary pattern among Chinese adults aged≥55 years old attending China Health and Nutrition Survey (N= 4852) between 1997 and 2006.Table S2. Odds ratio (95% CI) for global cognitive score below 7 across quartiles of recent iron related dietary pattern among Chinese adults aged≥55 years old by characteristics, China Health and Nutrition Survey (N = 4852) between 1997 and 2006. (DOCX 50 kb)
Acknowledgements
This research uses data from China Health and Nutrition Survey (CHNS). We thank the National Institute for Nutrition and Health, China Center for Disease Control and Prevention, Carolina Population Center (P2C HD050924, T32 HD007168), the University of North Carolina at Chapel Hill, the NIH (R01-HD30880, DK056350, R24 HD050924, and R01-HD38700) and the NIH Fogarty International Center (D43 TW009077, D43 TW007709) for financial support for the CHNS data collection and analysis files from 1989 to 2015 and future sur-veys, and the China-Japan Friendship Hospital, Ministry of Health for support for CHNS 2009, Chinese National Human Genome Center at Shanghai since 2009, and Beijing Municipal Center for Disease Prevention and Control since 2011.
Authors’contributions
ZS contributed to the study design, conduct, data collection and statistical analysis, manuscript writing and revision. TEO, ML, XX and JL contributed to data analysis and manuscript revision. All authors read and approved the final manuscript.
Funding
The publication of this article was funded by the Qatar National Library.
Availability of data and materials
The study used open access data. The original data are available from website:https://www.cpc.unc.edu/projects/china
Ethics approval and consent to participate
The survey was approved by the institutional review committees of the University of North Carolina (USA) and the National Institute of Nutrition and Food Safety (China). Informed consent was obtained from all participants.
Consent for publication Not applicable.
Competing interests
The authors declare that they have no competing interests.
Author details
1Human Nutrition Department, College of Health Science, QU Health, Qatar
University, Doha, Qatar.2Centre for Population Health Research, Division of Health Sciences, University of South Australia, Adelaide, Australia.3Faculty of Health, University of Technology Sydney, Sydney, Australia.4University of Pennsylvania School of Nursing, Philadelphia, USA.
Received: 8 April 2019 Accepted: 20 August 2019
References
1. Prince M, Bryce R, Albanese E, Wimo A, Ribeiro W, Ferri CP. The global prevalence of dementia: a systematic review and metaanalysis. Alzheimers Dement. 2013;9(1):63–75 e62.
2. Wu YT, Ali GC, Guerchet M, Prina AM, Chan KY, Prince M, Brayne C. Prevalence of dementia in mainland China, Hong Kong and Taiwan: an updated systematic review and meta-analysis. Int J Epidemiol. 2018;47:709– 19.
3. van de Rest O, Berendsen AA, Haveman-Nies A, de Groot LC. Dietary patterns, cognitive decline, and dementia: a systematic review. Adv Nutr. 2015;6(2):154–68.
4. Vauzour D, Camprubi-Robles M, Miquel-Kergoat S, Andres-Lacueva C, Banati D, Barberger-Gateau P, Bowman GL, Caberlotto L, Clarke R, Hogervorst E, et al. Nutrition for the ageing brain: towards evidence for an optimal diet. Ageing Res Rev. 2017;35:222–40.
5. Newby PK, Tucker KL. Empirically derived eating patterns using factor or cluster analysis: a review. Nutr Rev. 2004;62(5):177–203.
6. Hoffmann K, Schulze MB, Schienkiewitz A, Nothlings U, Boeing H. Application of a new statistical method to derive dietary patterns in nutritional epidemiology. Am J Epidemiol. 2004;159(10):935–44. 7. Loughrey DG, Lavecchia S, Brennan S, Lawlor BA, Kelly ME. The impact of
the Mediterranean diet on the cognitive functioning of healthy older adults: a systematic review and meta-analysis. Adv Nutr. 2017;8(4):571–86. 8. Shin D, Lee KW, Kim MH, Kim HJ, An YS, Chung HK. Identifying Dietary
Patterns Associated with Mild Cognitive Impairment in Older Korean Adults Using Reduced Rank Regression. Int J Environ Res Public Health. 2018;15(1): 100.
9. Okubo H, Inagaki H, Gondo Y, Kamide K, Ikebe K, Masui Y, Arai Y, Ishizaki T, Sasaki S, Nakagawa T, et al. Association between dietary patterns and cognitive function among 70-year-old Japanese elderly: a cross-sectional analysis of the SONIC study. Nutr J. 2017;16(1):56.
10. Belaidi AA, Bush AI. Iron neurochemistry in Alzheimer's disease and Parkinson's disease: targets for therapeutics. J Neurochem. 2016;139(Suppl 1):179–97.
11. Agrawal S, Berggren KL, Marks E, Fox JH. Impact of high iron intake on cognition and neurodegeneration in humans and in animal models: a systematic review. Nutr Rev. 2017;75(6):456–70.
12. Logroscino G, Gao X, Chen H, Wing A, Ascherio A. Dietary iron intake and risk of Parkinson's disease. Am J Epidemiol. 2008;168(12):1381–8. 13. Bao W, Rong Y, Rong S, Liu L. Dietary iron intake, body iron stores, and the
risk of type 2 diabetes: a systematic review and meta-analysis. BMC Med. 2012;10:119.
14. Kodl CT, Seaquist ER. Cognitive dysfunction and diabetes mellitus. Endocr Rev. 2008;29(4):494–511.
16. Ortega RM, Requejo AM, Andres P, Lopez-Sobaler AM, Quintas ME, Redondo MR, Navia B, Rivas T. Dietary intake and cognitive function in a group of elderly people. Am J Clin Nutr. 1997;66(4):803–9.
17. Shi Z, Li M, Wang Y, Liu J, El-Obeid T. High iron intake is associated with poor cognition among Chinese old adults and varied by weight status-a 15-y longitudinal stud15-y in 4852 adults. Am J Clin Nutr. 2019;109(1):109–16. 18. Kanoski SE, Davidson TL. Western diet consumption and cognitive
impairment: links to hippocampal dysfunction and obesity. Physiol Behav. 2011;103(1):59–68.
19. Krikorian R, Shidler MD, Dangelo K, Couch SC, Benoit SC, Clegg DJ. Dietary ketosis enhances memory in mild cognitive impairment. Neurobiol Aging. 2012;33(2):425 e419–27.
20. Greenwood CE, Kaplan RJ, Hebblethwaite S, Jenkins DJ. Carbohydrate-induced memory impairment in adults with type 2 diabetes. Diabetes Care. 2003;26(7):1961–6.
21. Papanikolaou Y, Palmer H, Binns MA, Jenkins DJ, Greenwood CE. Better cognitive performance following a low-glycaemic-index compared with a high-glycaemic-index carbohydrate meal in adults with type 2 diabetes. Diabetologia. 2006;49(5):855–62.
22. Shih RA, Hu H, Weisskopf MG, Schwartz BS. Cumulative lead dose and cognitive function in adults: a review of studies that measured both blood lead and bone lead. Environ Health Perspect. 2007;115(3):483–92. 23. Jin Y, Liu P, Sun J, Wang C, Min J, Zhang Y, Wang S, Wu Y. Dietary exposure
and risk assessment to lead of the population of Jiangsu province, China. Food Addit Contam Part A, Chem, Anal, Control Expo Risk Assess. 2014; 31(7):1187–95.
24. Reuben A, Schaefer JD, Moffitt TE, Broadbent J, Harrington H, Houts RM, Ramrakha S, Poulton R, Caspi A. Association of Childhood Lead Exposure with Adult Personality Traits and Lifelong Mental Health. JAMA Psychiatry. 2019;76(4):418–25.
25. Jin Y, Liu P, Wu Y, Min J, Wang C, Sun J, Zhang Y. A systematic review on food lead concentration and dietary lead exposure in China. Chin Med J. 2014;127(15):2844–9.
26. Shi Z, Zhen S, Orsini N, Zhou Y, Zhou Y, Liu J, Taylor AW. Association between dietary lead intake and 10-year mortality among Chinese adults. Environ Sci Pollut Res Int. 2017;24(13):12273–80.
27. Liu J, Lewis G. Environmental toxicity and poor cognitive outcomes in children and adults. J Environ Health. 2014;76(6):130–8.
28. Liu J, Li L, Wang Y, Yan C, Liu X. Impact of low blood lead concentrations on IQ and school performance in Chinese children. PLoS One. 2013;8(5): e65230.
29. Killin LO, Starr JM, Shiue IJ, Russ TC. Environmental risk factors for dementia: a systematic review. BMC Geriatr. 2016;16(1):175.
30. Peters JL, Weisskopf MG, Spiro A 3rd, Schwartz J, Sparrow D, Nie H, Hu H, Wright RO, Wright RJ. Interaction of stress, lead burden, and age on cognition in older men: the VA normative aging study. Environ Health Perspect. 2010;118(4):505–10.
31. Zhai FY, Du SF, Wang ZH, Zhang JG, Du WW, Popkin BM. Dynamics of the Chinese diet and the role of urbanicity, 1991-2011. Obes Rev. 2014;15(Suppl 1):16–26.
32. Popkin BM, Du S, Zhai F, Zhang B. Cohort profile: the China health and nutrition survey--monitoring and understanding socio-economic and health change in China, 1989-2011. Int J Epidemiol. 2010;39(6):1435–40. 33. Plassman BL, Welsh KA, Helms M, Brandt J, Page WF, Breitner JC.
Intelligence and education as predictors of cognitive state in late life: a 50-year follow-up. Neurology. 1995;45(8):1446–50.
34. Ding D, Zhao Q, Guo Q, Meng H, Wang B, Luo J, Mortimer JA, Borenstein AR, Hong Z. Prevalence of mild cognitive impairment in an urban community in China: a cross-sectional analysis of the Shanghai aging study. Alzheimers Dement. 2015;11(3):300–9 e302.
35. Yang Y. Chinese food composition table 2004. Beijing: Peking University Medical Press; 2005.
36. Yao M, McCrory MA, Ma G, Tucker KL, Gao S, Fuss P, Roberts SB. Relative influence of diet and physical activity on body composition in urban Chinese adults. Am J Clin Nutr. 2003;77(6):1409–16.
37. Hu FB, Stampfer MJ, Rimm E, Ascherio A, Rosner BA, Spiegelman D, Willett WC. Dietary fat and coronary heart disease: a comparison of approaches for adjusting for total energy intake and modeling repeated dietary measurements. Am J Epidemiol. 1999;149(6):531–40.
38. Zhou BF, Cooperative meta-analysis Group of the Working Group on obesity in C. Predictive values of body mass index and waist circumference
for risk factors of certain related diseases in Chinese adults--study on optimal cut-off points of body mass index and waist circumference in Chinese adults. Biomed Environ Sci. 2002;15(1):83–96.
39. Ainsworth BE, Haskell WL, Whitt MC, Irwin ML, Swartz AM, Strath SJ, O'Brien WL, Bassett DR Jr, Schmitz KH, Emplaincourt PO, et al. Compendium of physical activities: an update of activity codes and MET intensities. Med Sci Sports Exerc. 2000;32(9 Suppl):S498–504.
40. Harman D. Aging: a theory based on free radical and radiation chemistry. J Gerontol. 1956;11(3):298–300.
41. Li K, Reichmann H. Role of iron in neurodegenerative diseases. J Neural Transm (Vienna). 2016;123(4):389–99.
42. Erikson KM, Pinero DJ, Connor JR, Beard JL. Regional brain iron, ferritin and transferrin concentrations during iron deficiency and iron repletion in developing rats. J Nutr. 1997;127(10):2030–8.
43. Qin B, Plassman BL, Edwards LJ, Popkin BM, Adair LS, Mendez MA. Fish intake is associated with slower cognitive decline in Chinese older adults. J Nutr. 2014;144(10):1579–85.
44. Li M, Shi Z. A prospective Association of nut Consumption with cognitive function in Chinese adults aged 55+ _ China health and nutrition survey. J Nutr Health Aging. 2019;23(2):211–6.
45. Qin B, Adair LS, Plassman BL, Batis C, Edwards LJ, Popkin BM, Mendez MA. Dietary patterns and cognitive decline among Chinese older adults. Epidemiology. 2015;26(5):758–68.
46. Chan R, Chan D, Woo J. A cross sectional study to examine the association between dietary patterns and cognitive impairment in older Chinese people in Hong Kong. J Nutr Health Aging. 2013;17(9):757–65. 47. Santesso N, Akl EA, Bianchi M, Mente A, Mustafa R, Heels-Ansdell D,
Schunemann HJ. Effects of higher- versus lower-protein diets on health outcomes: a systematic review and meta-analysis. Eur J Clin Nutr. 2012;66(7): 780–8.
48. Xu X, Parker D, Shi Z, Byles J, Hall J, Hickman L. Dietary pattern, hypertension and cognitive function in an older population: 10-year longitudinal survey. Front Public Health. 2018;6:201.
49. Benton D, Ruffin MP, Lassel T, Nabb S, Messaoudi M, Vinoy S, Desor D, Lang V. The delivery rate of dietary carbohydrates affects cognitive performance in both rats and humans. Psychopharmacology. 2003;166(1):86–90. 50. Liu X, Song Q, Tang Y, Li W, Xu J, Wu J, Wang F, Brookes PC. Human health
risk assessment of heavy metals in soil-vegetable system: a multi-medium analysis. Sci Total Environ. 2013;463-464:530–40.
Publisher’s Note