R E S E A R C H
Open Access
Fatigue in chronically critically ill patients
following intensive care - reliability and
validity of the multidimensional fatigue
inventory (MFI-20)
Gloria-Beatrice Wintermann
1*, Jenny Rosendahl
2,3, Kerstin Weidner
1, Bernhard Strauß
3, Andreas Hinz
4and Katja Petrowski
1Abstract
Background:Fatigue often occurs as long-term complication in chronically critically ill (CCI) patients after prolonged intensive care treatment. The Multidimensional Fatigue Inventory (MFI-20) has been established as valid instrument to measure fatigue in a wide range of medical illnesses. Regarding the measurement of fatigue in CCI patients, the psychometric properties of the MFI-20 have not been investigated so far. Thus, the present study examines reliability and validity of the MFI-20 in CCI patients.
Methods: A convenience sample ofn= 195 patients with Critical Illness Polyneuropathy (CIP) or Myopathy (CIM) were recruited via personal contact within four weeks (t1) following the transfer from acute care ICU to post-acute ICU at a large rehabilitation hospital.N= 113 (median age 61.1 yrs., 72.6% men) patients were again contacted via telephone three (t2) and six (t3) months following the transfer to post-acute ICU. The MFI-20, the Euro-Quality of Life (EQ-5D-3 L) and the Structured Clinical Interview for the Diagnostic and Statistical Manual of mental disorders DSM-IV (SCID-I) were applied within this prospective cohort study.
Results: The internal consistency Cronbach’s αwas adequate for the MFI-total and all but the subscale Reduced Motivation (RM) (range: .50–.91). Item-to-total correlations (range: .22–.80) indicated item redundancy for the subscale RM. Confirmatory Factor analyses (CFAs) revealed poor model fit for the original 5-factor model of the MFI-20 (t2/t3, Confirmatory Fit Index, CFI = .783/ .834; Tucker-Lewis Index, TLI = .751/ .809; Root Mean Square Error of Approximation, RMSEA = .112/ .103). Among the alternative models (1-, 2-, 3-factor models), the data best fit to a 3-factor solution summarizing the highly correlated factors General −/ Physical Fatigue/ Reduced Activity (GF/ PF/ RA) (t2/ t3, CFI = .878/ .896, TLI = .846/ .869, RMSEA = .089/ .085, 90% Confidence Interval .073–.104/ .066–.104). The MFI-total score significantly correlated with the health-related quality of life (range:−.65-(−).66) and the diagnosis of major depression (range: .27–.37).
Conclusions:In the present sample of CCI patients, a reliable and valid factor structure of the MFI-20 could not be ascertained. Especially the subscale RM should be revised. Since the factors GF, PF and RA cannot be separated from each other and the unclear factorial structure in the present sample of CCI patients, the MFI-20 is not recommended for use in this context.
(Continued on next page)
* Correspondence:[email protected]
1Department of Psychotherapy and Psychosomatic Medicine, Medizinische
Fakultät Carl Gustav Carus, Technische Universität Dresden, Dresden Fetscherstraße 74, 01307 Dresden, Germany
Full list of author information is available at the end of the article
(Continued from previous page)
Trial registration:German Clinical Trials RegistrationDRKS00003386. Registered 13 December 2011, retrospectively registered.
Keywords:Fatigue, Intensive care, Multidimensional fatigue inventory (MFI), Chronic critical illness (CCI), Sepsis, Health-related quality of life, Post-intensive care syndrome (PICS), Reliability, Validity, Psychometrics, Assessment
Background
Fatigue is a common long-term complication after treat-ment on Intensive Care Unit (ICU) and goes along with a negative impact on the patients’ health-related quality of life [1–3]. A small group of seriously ill patients needs prolonged mechanical ventilation, ongoing dependence from invasive critical care techniques and persistent monitoring of e.g. cardiopulmonary functions. These pa-tients are at increased risk to become chronically critic-ally ill (CCI) [4, 5]. CCI patients are often faced with initial severe acute inflammatory events that cause long-term alterations in the innate and/ or acquired immune system [6]. Consequential, damages at the myelin of the peripheral nerves may follow. The extended immobilization of CCI patients leads to adverse physiological alterations and deconditioning in multiple organ systems such as mus-cles, bones, joints, endocrine system. The prolonged treat-ment on ICU may contribute to a loss of muscle mass and maximal attainable muscle tension, increasing the risk for the development of Critical Illness Polyneuropathy (CIP) or Critical Illness Myopathy (CIM). In this context, a state of ongoing exhaustion or fatigue may occur which cannot be substantially alleviated by rest and may impair the patients’ rehabilitation process [5]. Moreover, fatigue may be accom-panied by additional symptoms such as neurological, im-munological, gastrointestinal, genitourinary symptoms and impaired energy balance [7,8].
Especially CCI patients are confronted with symptoms of fatigue during their physical and cognitive rehabilita-tion process following the ICU treatment [3,5]. CCI pa-tients reported symptoms of chronic exhaustion even five years after ICU discharge [9]. Additionally, the present research showed a profound overlap between the construct of fatigue and depressive symptoms [10,
11]. Hence, health care providers should be aware of fatigue and its consequences in CCI patients.
Until now, a uniform definition or pathophysiology as well as gold standard for the assessment of fatigue do not exist. Within clinical research, self-report question-naires such as the Multidimensional Fatigue Inventory (MFI-20) [12] are commonly used to assess the severity of fatigue symptoms (e.g. in chronic fatigue syndrome, cancer, Parkinson’s disease, craniopharyngeoma). At present, findings regarding the reliability and validity of the MFI in CCI patients are lacking. There is need for a valid instrument to measure fatigue in these patients in
order to complete a patient-centered outcome set, assessing impairments following ICU discharge in these patients. Above, the valid assessment of fatigue in CCI patients al-lows a more meaningful evaluation of the effectiveness of interventional trials targeted on the improvement of fatigue post-discharge [13]. Following, the aim of the present study was to examine the measurement properties (internal consistency, measurement error, structural -, convergent -, discriminant validity, floor/ ceiling effects) of the MFI-20 in patients with chronic critical illness.
Methods
Participants and study procedures
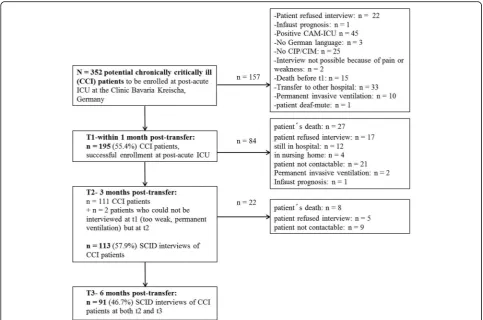
N= 195 patients were consecutively enrolled in a re-habilitation hospital (Bavaria Clinic Kreischa) where they were weaned from long-term ventilation. For study par-ticipation they had to fulfill the diagnosis of a Critical Ill-ness Polymyopathy (CIP, ICD-10: G62.80) or Critical Illness Myopathy (CIM, ICD-10: G72.80). A convenience sample of patients (see Fig.1) with the following further inclusion criteria participated: sufficient German lan-guage skills, ICU stay of at least six days, alert and able to understand the questionnaires, transfer from ICU at acute care hospital during the weeks before inclusion in the present study. The patients were asked for study par-ticipation orally at the Bavaria Clinic Kreischa. A short cognitive test, named Confusion Assessment Method for the Intensive Care Unit (CAM-ICU) [14, 15], was ap-plied in order to preclude cognitive impairment. The pa-tients were informed about the study protocol and informed consent for study participation was received within four weeks following the transfer from ICU at acute care hospital to the post-acute ICU at the rehabili-tation hospital (t1).
rehabilitation state (e.g. intensive care supervision, trache-ostomy tube management, mechanical ventilation, confu-sion, severe impairment of communication, and dysphagia). It was assessed at admission and discharge from rehabilitation hospital by a trained study nurse. A minimum value of −325 and a maximum value of 100 could be reached. Higher values indicate a better performance.
At t2 (three months post-transfer) and at t3 (six months post-transfer), the patients were contacted via telephone. During the telephone interviews, the following instruments with relevance for the present research ques-tion were applied: the MFI-20 [12], the questionnaire Euro-Quality of Life (EQ-5D-3 L) [18] and the Structured Clinical Interview for the Diagnostic and Statistical Manual of mental disorders DSM-IV (SCID-I) [19].
Measures
The severity of fatigue was assessed with the Multidi-mensional Fatigue Inventory-20 (MFI-20) [12, 20] three months and six months following the transfer from acute care ICU via telephone interview. The MFI-20 is a 20-item self-report measurement of fatigue. It covers the
five dimensions General Fatigue (GF), Physical Fatigue (PF), Mental Fatigue (MF), Reduced Motivation (RM) and Reduced Activity (RA). Each subscale contains two positively (e.g. „I feel very active.“) and two negatively (e.g.„I tire easily.“) formulated items. Items are rated on a 5-point Likert scale (range 1 „yes, that is true “to 5 „no, that is not true“) which are summed up to a simple total score with a minimum value of 4 (absence of fa-tigue) and a maximum value of 20 for each subscale. A total fatigue score is calculated as the sum of the sub-scale scores (range 20–100). Higher total scores indicate higher levels of fatigue. Validity has been shown for dif-ferent participant populations e.g. cancer patients, army recruits, chronic fatigue syndrome. Internal consistency has been shown to be good for the GF, PF and MF di-mensions (Cronbach’s α .84) [12] and adequate for the subscales RA and RM (Cronbach’sα> .65) [12].
The health-related quality of life was measured with the questionnaire Euro-Quality of Life (EQ-5D-3 L) [18] at t2 and t3. The EQ-5D-3 L assesses five dimensions (mobility, self-care, usual activities, pain/ discomfort and anxiety/ depression) which are rated within three sever-ity levels (no problems, some or moderate problems,
extreme problems or unable). A single one-dimensional index value is generated based on a simple sum score ac-cording to Hinz et al. [21]. This sum score was subjected to a linear transformation leading to values between 0 and 100. Higher values indicate a higher health-related quality of life. In the present study Cronbach’sα for the EQ-5D-3 L was .74 at t2 and .75 at t3.
The diagnosis of major depression was ascertained via SCID-I at t2 and t3. A clinical psychologist with at least five years of clinical practice applied the SCID-I via tele-phone contact.
The present study protocol was in consent with the Declaration of Helsinki and a positive votum was re-ceived by the Ethics Committee (No 3278–10/11) of the Friedrich-Schiller-University, Jena, Germany.
Statistical analysis
Sociodemographic and item characteristics were dis-played as frequencies. Mean values, standard deviations, medians and interquartile ranges were reported depend-ing on the distribution of the dependent variables. Chi-s-quared tests or Fisher’s exact tests were applied to compare categorical data. Mann-Whitney U tests were calculated to compare ordinally or non-normally distrib-uted data. Standardized Cronbach’s α, item-total sub-scale (corrected-to-total) and inter-item correlations were calculated as parameters of internal consistency. Cronbach’sα values >.70, item-total subscale (corrected-to-total) correlations≥.30 and inter-item correlations of .30 to .70 were acceptable [22, 23]. Measurement error, defined as systematic or random error not attributed to true changes in fatigue between the two consecutive as-sessments of the MFI, was calculated according to Elbers et al. [22] using Bland and Altman plots [24]. The limits of agreement were determined using the mean difference values (MFI-total, MFI subscales) between t2 and t3 ± 1.96 x standard deviation (SD) of the difference. A linear regression between difference and mean scores was ap-plied in order to detect a proportional bias. MFI sub-scales were intercorrelated controlling for age and gender [12, 20, 23]. Confirmatory factor analyses (CFA) was applied using the maximum likelihood estimation (MLE) in order to assess the structural validity of the MFI-20 in the present sample of CCI patients at t2 and t3 (see Table 4, Additional file 1: Table S3). Separate CFAs were applied in the sample of CCI patients at t2 (n= 113) and t3 (n= 91). The MFI-20 may be regarded as structurally valid if the items adequately represent the proposed latent factors or measurement model. The fol-lowing models were evaluated: model A assuming the original five latent fatigue factors (GF, PF, MF, RA, RM), model B assuming one single underlying latent factor, model C with a 2-factor model combining model A and B. Since the subscales representing the three factors GF,
PF and RA showed high intercorrelations (see Table 3), these factors were summarized and tested in model D (3-factor model). In models A, C, and D, the latent fa-tigue factors were allowed to covary with mean values fixed to 0 and variances to 1. The fitness of each model with the data were evaluated using comparative fit indices (CFI, cut-off > .95; Tucker-Lewis Index, TLI,cut-off > .95) and absolute fit indices (Chi2goodness-of-fit, Root Mean Square Error of Approximation, RMSEA, cut-off <.08) [25,26]. A Chi2value smaller than the number of degrees of freedom (atp> .05), can be regarded to be good. The CFA was carried out using IBM® SPSS® AMOS 24.0.0. The convergent validity was assessed via Spearman’s and point-bisearial correlation with the health-related quality of life and the SCID-based diagnosis of major depression. Above, the convergent validity was evaluated by compos-ite reliability (CR > .7) and average variance extracted (AVE > .5) value of each factor. Discriminant validity was evaluated by maximum shared variance (MSV < AVE), average shared variance (ASV < AVE) and square root of AVE greater than inter-factor correlations [27]. CR, AVE, MSV, ASV and square root of AVE were calculated using stats tool package. Floor and ceiling effects were ascer-tained if more than 15% of the CCI patients had ei-ther the lowest or highest possible score on the MFI subscales at t2 or t3. For the statistical analyses SPSS 24.0 was used. All results were considered significant at p≤. 05 (two-tailed).
Results
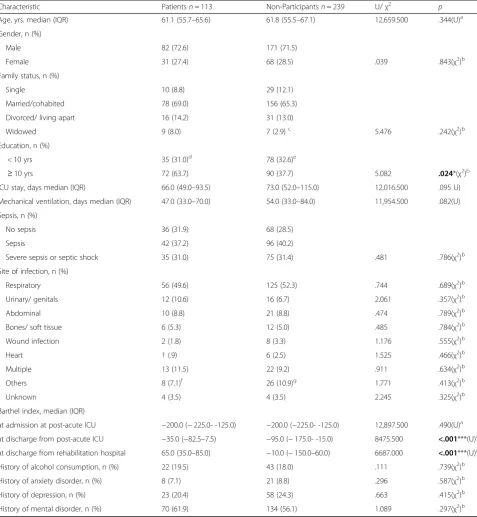
Table 1Descriptive characteristics of chronically critically ill (CCI) patients three months (t2) following discharge from ICU at acute care hospital (n= 113). Non-participants were defined as all patients of the potentially to be enrolled patients who could not be interviewed at t1, t2 and t3 for different reasons (see Flow chart, Fig.1)
Characteristic Patientsn= 113 Non-Participantsn= 239 U/χ2 p
Age, yrs. median (IQR) 61.1 (55.7–65.6) 61.8 (55.5–67.1) 12,659.500 .344(U)a
Gender, n (%)
Male 82 (72.6) 171 (71.5)
Female 31 (27.4) 68 (28.5) .039 .843(χ2)b
Family status, n (%)
Single 10 (8.8) 29 (12.1)
Married/cohabited 78 (69.0) 156 (65.3)
Divorced/ living apart 16 (14.2) 31 (13.0)
Widowed 9 (8.0) 7 (2.9)c 5.476 .242(χ2)b
Education, n (%)
< 10 yrs 35 (31.0)d 78 (32.6)e
≥10 yrs 72 (63.7) 90 (37.7) 5.082 .024*(χ2)b
ICU stay, days median (IQR) 66.0 (49.0–93.5) 73.0 (52.0–115.0) 12,016.500 .095 U)
Mechanical ventilation, days median (IQR) 47.0 (33.0–70.0) 54.0 (33.0–84.0) 11,954.500 .082(U)
Sepsis, n (%)
No sepsis 36 (31.9) 68 (28.5)
Sepsis 42 (37.2) 96 (40.2)
Severe sepsis or septic shock 35 (31.0) 75 (31.4) .481 .786(χ2)b
Site of infection, n (%)
Respiratory 56 (49.6) 125 (52.3) .744 .689(χ2)b
Urinary/ genitals 12 (10.6) 16 (6.7) 2.061 .357(χ2)b
Abdominal 10 (8.8) 21 (8.8) .474 .789(χ2)b
Bones/ soft tissue 6 (5.3) 12 (5.0) .485 .784(χ2)b
Wound infection 2 (1.8) 8 (3.3) 1.176 .555(χ2)b
Heart 1 (.9) 6 (2.5) 1.525 .466(χ2)b
Multiple 13 (11.5) 22 (9.2) .911 .634(χ2)b
Others 8 (7.1)f 26 (10.9)g 1.771 .413(χ2)b
Unknown 4 (3.5) 4 (3.5) 2.245 .325(χ2)b
Barthel index, median (IQR)
at admission at post-acute ICU −200.0 (−225.0- -125.0) −200.0 (−225.0- -125.0) 12,897.500 .490(U)a
at discharge from post-acute ICU −35.0 (−82.5–7.5) −95.0 (−175.0- -15.0) 8475.500 <.001***(U)a
at discharge from rehabilitation hospital 65.0 (35.0–85.0) −10.0 (−150.0–60.0) 6687.000 <.001***(U)a
History of alcohol consumption, n (%) 22 (19.5) 43 (18.0) .111 .739(χ2)b
History of anxiety disorder, n (%) 8 (7.1) 21 (8.8) .296 .587(χ2)b
History of depression, n (%) 23 (20.4) 58 (24.3) .663 .415(χ2)b
History of mental disorder, n (%) 70 (61.9) 134 (56.1) 1.089 .297(χ2)b
a
p-value from Mann-Whitney-U test; b
p-value from McNemar test c
n= 16 missing values d
n= 6 missing values e
n= 71 missing values f
n= 1 brain,n= 5 central venous catheter,n= 1 port system,n= 1 urinary catheter g
Reliability
The internal consistency values were reasonsable for the MFI-total (Cronbach’sα= .91) and four of the five sub-scales (GF, PF, RA, MF, Cronbach’sαrange: .69–.86). An inadequate value (Cronbach’s α= .50) was received for the subscale RM (Table2). Regarding the inter-item cor-relations, a mean value of≥ .30 was ascertained for the MFI-total and all but the RM subscale (.20, range .06–.32). The lowest correlation was present between item 15 („I have a lot of plans.“) with item 18 („I don’t feel like doing anything.”) (.06) and item 12 („I feel rested.“) (.02), suggesting item redundancy for item 15. Item-total correlations were≥.30 for all but the subscale RM (range: .22–.37) as well as the MFI-total (range: .23–.71) (Table2). Pearson item subscale correlation co-efficients ranged from .11 to .58 (absolute values) with the lowest and non-significant values for items 6, 11 and 20. Of them, only the removal of item 20 (“Physically I feel I am in an excellent condition.”) would lead to an increase of Cronbach’s α for the respective subscale (Additional file3: Table S2). Values at t2 and t3 were not systematically different as shown in the Bland and Altman plots (Additional file 4: Figure S1).
Pairwise correlations between the MFI subscales
There was no effect of gender for all the MFI subscales. Only the MFI subscale GF was positively associated with age (Spearman’s rho = .24, p= .01). Nevertheless, partial correlations were calculated controlling for age and gen-der. At t2, the MFI subscales showed medium-sized to high correlations between each other, ranging from .37 to .77. At t3, the pairwise correlations ranged from .55 to .76 (see Table3).
Structural validity
Fit statistics revealed a poor model fit for all models at both time points (Table 4, Additional file 1: Table S3). According to the original 5-factor model (A), all but one standardized regression weights β (corresponding to
factor-item correlation coefficients) were > .05 at p < .001. The lowest estimates were observed for item 15 for models A and B (t2/ t3, model A: β= .363/ .465, model B: β= .242/ .358). For model C, only the items of the MF subscale showed highly significant βcoefficients at both t2 and t3. The best fit to the data (RMSEA ≤ .089) could be obtained for the 3-factor solution both at t2 and t3. All but items 9 and 16 were highly signifi-cantly correlated to the subscales. When each of the five factors was evaluated in separate CFAs, the factor RM turned out to show the poorest fit indices at both t2 and t3.
Convergent and discriminant validity
According to model A, the composite reliability (CR) was appropriate (CR > .7) for all MFI subscales at both time points. AVE was acceptable (> .5) besides for RM. Discriminant validity (MSV < AVE, ASV < AVE) could not be ascertained at both time points. The square root of AVE was greater than the inter-factor correlations only for the subscale MF.
According to model C, the CR was appropriate (CR > .7) only for MF at both time points. AVE was inappropriate and only acceptable (> .5) for MF at t2. Discriminant val-idity (MSV < AVE, ASV < AVE) could be ascertained at both time points.
Referring to model D, the CR was acceptable for all subscales besides RM. AVE was only appropriate for MF. Discriminant validity (MSV > AVE) was only appro-priate for MF as well. Square root of AVE was smaller than inter-factor correlations besides for MF at t3.
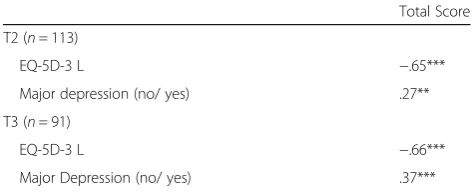
Since no unequivocal factor model of the MFI-20 could be confirmed in the present sample of CCI patients, corre-lations were calculated only with the MFI-total but not with the single MFI subscales. The relationship between the MFI-total and the health-related quality of life (EQ-5D-3 L) yielded significant high-sized correlations at both t2 and t3 (range: −65-(−)66). Significant small- to
medium-Table 2Item characteristics and internal consistency reliabilities for the MFI-20 subscales and total fatigue score in patients with chronic critical illness three months (t2) following the transfer from ICU at acute care hospital (n= 113)
Internal consistency and reliability
Mean (Median) SD (Q1-Q3) Standardized
Cronbach’s alphaa Corrected-to-totalcorrelationa Inter-itemcorrelationa
Total 55.9 (55.0) 16.5 (43.5–67.0) .91 .23–.71 .35 (.02–.73)
MFI subscales
General Fatigue (GF) 12.2 (12.0) 4.0 (9.0–15.0) .69 .37–.56 .36 (.24–.44)
Physical Fatigue (PF) 13.4 (13.0) 3.7 (11.0–16.0) .74 .42–.64 .42 (.28–.59)
Reduced Activity (RA) 12.6 (12.0) 4.6 (9.0–16.5) .85 .42–.64 .42 (.28–.59)
Mental Fatigue (MF) 8.7 (8.0) 4.5 (4.0–11.0) .86 .63–.80 .61 (.45–.73)
Reduced Motivation (RM) 8.9 (9.0) 3.5 (6.0–11.0) .50 .22–.37 .20 (.06–.32)
a
sized correlations (range: .27–.37) could be obtained with the diagnosis of major depression (see Table5).
Floor and ceiling effects
There was neither a floor nor a ceiling effect for the sub-scales GF, PF, RA and RM. For the MF subscale, floor ef-fects were detected.N= 30 patients (26.5%) had the lowest possible test score at t2,n= 19 patients (20.9%) at t3.
Discussion
Fatigue is a common symptom in patients following ICU stay [13]. It is supposed that especially CCI patients are affected by a persisting feeling of exhaustion [3,9]. How-ever, to what extent the Multidimensional Fatigue Inven-tory (MFI) is a reliable and valid measure of fatigue in CCI patients, remains to be elucidated. Therefore, the present study investigated the measurement properties of the MFI in a sample of patients at three and six months following the transfer from acute care ICU to post-acute ICU at the rehabilitation hospital.
Overall, in the present sample of CCI patients the MFI values of the subscales General Fatigue (GF), Physical Fatigue (PF) and Reduced Activity (RA) were higher than those of cancer patients [28]. Likewise, CCI pa-tients showed higher values in the above mentioned MFI subscales compared with a representative German popu-lation, whereas the subscales RM and MF were similarly scored [20]. The internal consistency was adequate for the MFI-total and the GF, PF, MF, RA subscales suggest-ing unidimensionality of the appropriate subscales. For the RM subscale a value smaller than the cut-off criter-ion of .70 for Cronbach’s α was shown. The other reli-ability tests (corrected item-to-total and inter-item correlation) showed inadequate values for the MFI-total and the RM subscale (values < .30). This is in accord-ance with the literature showing low reliability for the RM subscale either [12,29]. One explanation might be a possible response dependency between items of this sub-scale [29]. Alternatively, it can be supposed that the content of the items does not correctly mirror the cir-cumstances of the CCI patients. These often old-aged patients are in a fatal situation with a high ongoing mor-tality rate, increased risk for recurrent complications and persistent suffering from profound functional impair-ments to master basic activities of daily life. Thus, given the vague situation of CCI patients, the item content (es-pecially from item 15: I have a lot of plans.) seems to be irrelevant for them, leading to inconsistent response pat-terns [12]. With respect to measurement error, the Bland and Altman plots suggest overall agreement between the assessment of fatigue at t2 and t3, with a wide range of MFI values as shown by the limits of agreement.
Floor and ceiling effects could be precluded for the MFI-total and all but the MF subscale. For the latter, 26.5% of the patient sample achieved the lowest
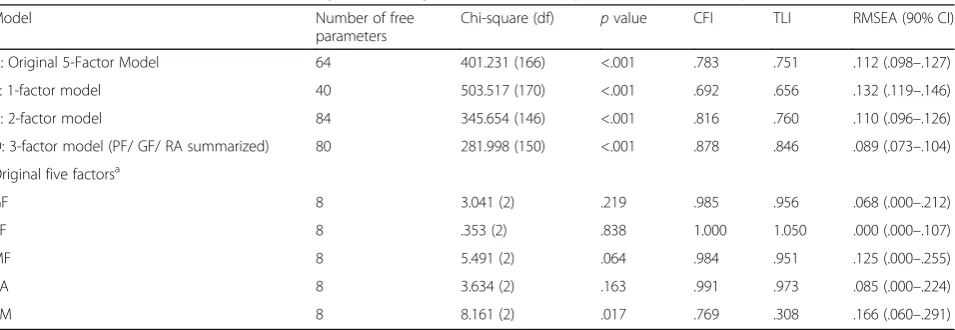
Table 4MFI-20 models tested via Confirmatory Factor Analysis (CFA) inn= 113 patients three months post-ICU (t2)
Model Number of free
parameters
Chi-square (df) pvalue CFI TLI RMSEA (90% CI)
A: Original 5-Factor Model 64 401.231 (166) <.001 .783 .751 .112 (.098–.127)
B: 1-factor model 40 503.517 (170) <.001 .692 .656 .132 (.119–.146)
C: 2-factor model 84 345.654 (146) <.001 .816 .760 .110 (.096–.126)
D: 3-factor model (PF/ GF/ RA summarized) 80 281.998 (150) <.001 .878 .846 .089 (.073–.104)
Original five factorsa
GF 8 3.041 (2) .219 .985 .956 .068 (.000–.212)
PF 8 .353 (2) .838 1.000 1.050 .000 (.000–.107)
MF 8 5.491 (2) .064 .984 .951 .125 (.000–.255)
RA 8 3.634 (2) .163 .991 .973 .085 (.000–.224)
RM 8 8.161 (2) .017 .769 .308 .166 (.060–.291)
RMSEARoot Mean Squared Error of Approximation,CFIConfirmatory Fit Index,CIConfidence Interval,TLITucker-Lewis Index,dfdegrees of freedom,MFI-20 Multi-dimensional Fatigue Inventory-20,GFGeneral Fatigue,MFMental Fatigue,PFPhysical Fatigue,RAReduced Activity,RMReduced Motivation
a
each factor of the original MFI-20 was analyzed in independent models. In models A, C and D, the mean values of each latent variable were fixed to 0 and variances to 1. The latent fatigue factors were intercorrelated. In models B mean values and variance of the latent factor were not specified
Table 3Pairwise correlations between the MFI subscales at t2 and t3
GF PF RA MF RM
t2/t3 t2/t3 t2/t3 t2/t3 t2/t3
GF .702/.662 .722/.762 .582/.582 .572/.622
PF .701/.671 .772/.752 .402/.512 .532/.632
RA .701/.751 .771/.741 .552/.552 .602/.622
MF .581/.571 .411/.501 .551/.511 .372/.642
RM .581/.661 .531/.621 .601/.611 .431/.621
1
Partial correlations controlling for age and gender;2
Spearman’s rank correlation coefficients
GFGeneral Fatigue,MFMental Fatigue,PFPhysical Fatigue;RAReduced Activity,RMReduced Motivation
possible test score at t2 and 20.9% at t3. This finding confirms existing results in patients with chronic ill-nesses (e.g. [22]) and a population-based sample of well participants [23].
In the present sample of CCI patients, a reliable factor structure of the MFI-20 could not be ascertained. Fit statistics revealed poor model fit for the original 5-factor model as originally suggested by Smets et al. [12]. Alter-native models (1-factor, 2-factor) evaluated in our sam-ple also showed no satisfying fit to the data. Fit indices rather hint towards a 3-factor solution summarizing the subscales GF/ PF/ RA. In line, other studies (e.g. [12, 22, 30]) also could not fully replicate the five factors of the MFI-20 and summarized a GF/ PF-factor. However, the model fit indices are not un-equivocal since the Chi2values surmount the degrees of freedom and were significant at p< .05. One rea-son for the lack of a reliable factor structure may be the high intercorrelations between the fatigue sub-scales as formerly shown in different patient samples (e.g. radiotherapy patients/ chronic fatigue patients/ psychology or medical students/ army recruits [12]; cancer patients [31, 32]; haemodialysis patients [26]). In the present study, the strong associations (r≥.70) between the subscales GF, PF and RA hint toward a large amount of shared variance. However, the 3-factor model did not reveal satisfying model fit indi-ces as well. Regarding the high intercorrelations particularly between the subscales GF, PF, RA and the unclear factorial structure [20], the MFI-total is a more valid score for fatigue than the single MFI-subscale scores.
Consequently, a low validity of the MFI-20 has to be supposed in CCI patients. The latter has been already shown in a similar setting investigating fatigue in
chronically ill haemodialysis patients [26]. Similar rea-sons for the lacking reliability of the factor structure can be supposed in our sample, including comprehension dif-ficulties and a high relation of item content to the multi-morbid as well as potentially life-threatening health status in the present study population. In this context, the item content of some items seems to be not relevant or in-appropriate (e.g. item 6„I think I do a lot in a day.“). In the aftermath of the ICU treatment, CCI patients are mainly involved with the recovery from the serious phys-ical illness and their rehabilitation process [33]. The item content is therefore primarily attributed to the chronic morbidity already present in the forefront of the ICU treatment or following ICU and not to fatigue per se [26]. In line, patients particularly pay attention to the physical aspects of fatigue (e.g. vitality, activity) rather than mental complaints (e.g. concentration, mood difficulties). This is supported by significantly higher values for physical fa-tigue than for mental fafa-tigue at both t2 and t3 in our CCI patients. Moreover, fatigue was predominantly related to somatic or medical reasons (e.g. efforts during rehabilita-tion, musculoskeletal deconditioning and general weakness following long duration of immobility, sleep disorders, pain, dyspnoea, dialysis, medication).
The models which were examined by us, only partly agreed with the criteria for convergent and discrimin-ant validity suggested by Hair et al. [27]. Good agree-ment could be achieved for the subscale MF, poor agreement was obvious for RM. Above, significant correlations between fatigue and related constructs (e.g. health-related quality of life) could be shown. This has been already proven in other samples (e.g. Chronic Fatigue Syndrome, ovarian carcinoma pa-tients) using different measurements (e.g. Short Form-36, SF-36) (see [23, 34]). Above, a significant associ-ation with depression has been shown in our sample of CCI patients and corroborates former findings where recurrent or chronic fatigue has been turned out to be a risk factor for major depression and, vice versa [35, 36]. In line, a high rate of psychiatric comorbidity has been reported in patients with chronic fatigue syndrome [11].
Our results should be interpreted in the context of the methodological strengths and limitations. The main strengths of the present study includes the investigation of a homogeneous sample of CCI patients, a prospective-longitudinal design, the long-term assessment up to six months following ICU treatment, the application of the SCID-I, and the oral data assessment via direct interview-ing. The latter ensured that no missing values were pro-duced. However, the present results should be cautiously evaluated. The kind of medical interventions or rehabilita-tion programmes (e.g. physiotherapy, neuropsychological interventions, ergotherapy) taking place between the
Table 5Convergent validity. Spearman’s correlation between the total score of the MFI-20 and EQ-5D-3 L, point-biserial correlation between the MFI-total and the diagnosis of major depression according to SCID-I
Total Score
T2 (n= 113)
EQ-5D-3 L −.65***
Major depression (no/ yes) .27**
T3 (n= 91)
EQ-5D-3 L −.66***
Major Depression (no/ yes) .37***
EQ-5D-3 L = Euro-Quality of life [18]; MFI-20 = Multidimensional Fatigue Inventory [12]; SCID-I = Structured Clinical Interview for the Diagnostic and Statistical Manual of mental disorders DSM-IV [19]
***p≤.001; **p≤.01
assessment time points (t2 and t3) were not controlled for and might have compromised the comparability of fatigue assessment. Likewise, in the present study the time period between the assessment points was too long (three months) in order to gain an appropriate estimate for the reproducibility of the fatigue measurement over time or to calculate test-retest reliability. Although three months rep-resents a commonly accepted interval for measuring the rate of stress-related disorders following ICU [16], future studies should apply a much shorter time frame e.g. be-tween three and seven days when the test-retest reliability of patient-reported outcome measurements is of interest (for a systematic review see [37]). Information about the pre-ICU severity of fatigue could not be obtained, there-fore the severity of fatigue found in the present study can-not be attributed to the ICU treatment as causative factor. Moreover, the rate of non-participants, although similar to other studies on patient samples after long-term mechan-ical ventilation (e.g. [3,38,39]), was quite high. The sam-ple size of CCI patients was small. Therefore, conclusions based on the present sample should be drawn with utmost caution. Future studies are needed to replicate the results of this present study in a larger sample of CCI patients, additionally using other fatigue measures such as the Chalder Fatigue Questionnaire in order to ascertain con-vergent validity. Furthermore, the diagnosis of major de-pression should be assessed using DSM-V criteria [40]. Above, future studies should also address the minimal clinically important differences of the MFI-20 and its sub-scales in CCI patients (for a systematic review see [41]_ENREF_[35]).
Conclusion
To conclude, the present study shows that the MFI-20 cannot be regarded as valid instrument for use in clinical practice and research, measuring fatigue as multidimen-sional construct following ICU treatment in CCI pa-tients. Particularly the subscale Reduced Motivation showed insufficient reliability as well as validity and should be interpreted with caution. The factorial struc-ture of the original MFI-20 could not be unequivocally approved. Our data rather hint towards a 3-factor factor solution combining General -, Physical Fatigue and Reduced Activity. Because of the unclear factorial struc-ture, the MFI-20 cannot be considered as appropriate tool for the assessment of fatigue in CCI patients follow-ing ICU treatment. The present results demand replica-tion in a larger sample of CCI patients. Future research according to clinical important changes of fatigue symp-toms in these patients are needed using anchor-based responsiveness. Above, future research should investi-gate the appropriateness of the MFI-sum score in CCI patients using Rasch analysis.
Additional files
Additional file 1:Table S3.MFI-20 models tested via Confirmatory
Factor Analysis (CFA) inn= 91 patients six months post-ICU (t3). (DOCX 16 kb)
Additional file 2:Table S1.Medical comorbidities of the patients being
followed-up (n= 113) and the non-participants (n= 239). Patients who could not be included or followed-up for different reasons were referred to as non-participants. (DOCX 17 kb)
Additional file 3:Table S2.Correlation coefficients of the MFI-20 items
with the subscales. The item-subscale correlation coefficients are significant with **p< .01 or ***p< .001. (DOCX 15 kb)
Additional file 4:Figure S1.Bland and Altman plot comparing the five
subscales and the total score of the MFI-20 between t2 (three months post-ICU) and t3 (six months post-ICU). Bold lines represent the mean differences, dotted lines represent the 95% limits of agreement (see Additional files). Differences and mean values were created using MFI-20 scores of t2 and t3. (JPEG 2516 kb)
Abbreviations
AGFI:Adjusted Goodness of Fit Index; ASV: Average Shared Variance; AVE: Average Variance Extracted; BI: Barthel-Index; CAM-ICU: Cognitive Assessment for the Intensive Care Unit; CCI: Chronic Critical Illness; CFA: Confirmatroy Factory Analysis; CIM: Critical Illness Myopathy; CIP: Critical Illness Polyneuropathy; CR: Composite Reliability; DSM: Diagnostic and Statistical Manual of mental disorders; EQ-5D-3 L: Euro-Quality of Life;; GF: General Fatigue; GFI: Goodness of Fit Index; ICU: Intensive Care Unit; MF: Mental Fatigue; MFI: Multidimensional Fatigue Inventory; MSV: Maximum Shared Variance; PCA: Principal Component Analysis; PF: Physical Fatigue; RA: Reduced Activity; RM: Reduced Motivation; SCID-I: Structured Clinical Interview for the DSM-IV; SF: Short Form
Acknowledgments
We would like to kindly thank Stefan Rueckriem, Sara Wuestemann, Clara L. Buck, Christine Schier, and Corinna Klotzsche for their dedicated support in patient enrollment and data assessment. We also thank Stefan Rueckriem, Prof. Frank Oehmichen and Prof. Marcus Pohl for supervising data acquisition and contributing their expertise for the improvement of the present study design.
Fundings
This study was supported by the German Federal Ministry of Education and Research grant 01EO1002.
Availability of data and materials
Data sharing consent was not obtained. Requests for data access may be sent to the corresponding author and will be judged individually with regard to the Data Protection Act of Saxony.
Authors’contributions
GBW performed the statistical analyses and wrote the manuscript. JR designed the study protocol and proof-read the manuscript. KW, BS, AH and KP contrib-uted to the study conception and improved the final version of the manuscript. KP supervised the enrollment of the patients. All authors meet all authorship re-quirements, read and approved the final manuscript version.
Ethics approval and consent to participate
All participants gave written informed consent for study participation. The study was conducted in accordance with the Declaration of Helsinki. The study protocol was approved by the Ethics Committee (No 3278–10/11) of the Friedrich-Schiller-University, Jena, Germany.
Consent for publication Not applicable.
Competing interests
Publisher’s Note
Springer Nature remains neutral with regard to jurisdictional claims in published maps and institutional affiliations.
Author details
1Department of Psychotherapy and Psychosomatic Medicine, Medizinische
Fakultät Carl Gustav Carus, Technische Universität Dresden, Dresden Fetscherstraße 74, 01307 Dresden, Germany.2Center for Sepsis Control and Care, Jena University Hospital, Friedrich-Schiller University, Jena, Germany.
3Institute of Psychosocial Medicine and Psychotherapy, Jena University
Hospital, Friedrich-Schiller University, Jena, Germany.4Department of Medical
Psychology and Medical Sociology, University of Leipzig, Leipzig, Germany.
Received: 27 February 2017 Accepted: 7 February 2018
References
1. Chaboyer W, Grace J. Following the path of ICU survivors: a quality-improvement activity. Nurs Crit Care. 2003;8(4):149–55.
2. Steenbergen S, Rijkenberg S, Adonis T, Kroeze G, van Stijn I, Endeman H. Long-term treated intensive care patients outcomes: the one-year mortality rate, quality of life, health care use and long-term complications as reported by general practitioners. BMC Anesthesiol. 2015;15:142.
3. Spadaro S, Capuzzo M, Valpiani G, et al. Fatigue in intensive care survivors one year after discharge. Health Qual Life Outcomes. 2016;14(1):148. 4. Nelson JE, Cox CE, Hope AA, Carson SS. Chronic critical illness. Am J Respir
Crit Care Med. 2010;182(4):446–54.
5. Thomas DC, Kreizman IJ, Melchiorre P, Ragnarsson KT. Rehabilitation of the patient with chronic critical illness. Crit Care Clin. 2002;18(3):695–715. 6. Benjamim CF, Hogaboam CM, Kunkel SL. The chronic consequences of severe
sepsis. J Leukoc Biol. 2004;75(3):408–12.
7. Fukuda K, Straus SE, Hickie I, Sharpe MC, Dobbins JG, Komaroff A. The chronic fatigue syndrome: a comprehensive approach to its definition and study. International Chronic Fatigue Syndrome Study Group. Ann Intern Med. 1994; 121(12):953–9.
8. Carruthers BM, van de Sande MI, De Meirleir KL, et al. Myalgic encephalomyelitis: international consensus criteria. J Intern Med. 2011;270(4):327–38.
9. Jaenichen D, Brunkhorst FM, Strauss B, Rosendahl J. Physical and mental long-term sequelae following intensive care of severe sepsis in patients and relatives. Psychother Psychosom Med Psychol. 2012;62(9– 10):335–43.
10. Fuller-Thomson E, Nimigon J. Factors associated with depression among individuals with chronic fatigue syndrome: findings from a nationally representative survey. Fam Pract. 2008;25(6):414–22.
11. Nater UM, Lin JM, Maloney EM, et al. Psychiatric comorbidity in persons with chronic fatigue syndrome identified from the Georgia population. Psychosom Med. 2009;71(5):557–65.
12. Smets EM, Garssen B, Bonke B, De Haes JC. The multidimensional fatigue inventory (MFI) psychometric qualities of an instrument to assess fatigue. J Psychosom Res. 1995;39(3):315–25.
13. Hashem MD, Nallagangula A, Nalamalapu S, et al. Patient outcomes after critical illness: a systematic review of qualitative studies following hospital discharge. Crit Care. 2016;20(1):345.
14. Ely EW, Margolin R, Francis J, et al. Evaluation of delirium in critically ill patients: validation of the confusion assessment method for the intensive care unit (CAM-ICU). Crit Care Med. 2001;29(7):1370–9.
15. Klugkist M, Sedemund-Adib B, Schmidtke C, Schmucker P, Sievers HH, Huppe M. Confusion assessment method for the intensive care unit (CAM-ICU): diagnosis of postoperative delirium in cardiac surgery. Anaesthesist. 2008;57(5):464–74.
16. Wintermann GB, Brunkhorst FM, Petrowski K, et al. Stress disorders following prolonged critical illness in survivors of severe sepsis. Crit Care Med. 2015; 43(6):1213–22.
17. O’Sullivan SB, Schmitz TJ. Physical rehabilitation. Philadelphia, PA: F.A. Davis; 2007. 18. Rabin R, de Charro F. EQ-5D: a measure of health status from the EuroQol
group. Ann Med. 2001;33(5):337–43.
19. Wittchen H-U, Zaudig M, Fydrich T. Strukturiertes Klinisches Interview für DSM-IV.: Göttingen: Hogrefe; 1997.
20. Schwarz R, Krauss O, Hinz A. Fatigue in the general population. Onkologie. 2003;26(2):140–4.
21. Hinz A, Kohlmann T, Stobel-Richter Y, Zenger M, Brahler E. The quality of life questionnaire EQ-5D-5L: psychometric properties and normative values for the general German population. Qual Life Res. 2014;23(2):443–7. 22. Elbers RG, van Wegen EE, Verhoef J, Kwakkel G. Reliability and structural
validity of the multidimensional fatigue inventory (MFI) in patients with idiopathic Parkinson's disease. Parkinsonism Relat Disord. 2012;18(5):532–6. 23. Lin JM, Brimmer DJ, Maloney EM, Nyarko E, Belue R, Reeves WC. Further
validation of the Multidimensional Fatigue Inventory in a US adult population sample. Popul Health Metr. 2009;7:18.
24. Bland JM, Altman DG. Statistical methods for assessing agreement between two methods of clinical measurement. Lancet. 1986;1(8476):307–10. 25. Hu LT, Bentler PM. Evaluating model fit. In: Hoyle R, editor. Structural equation
modeling: concepts, issues, and applications. Thousand Oaks: Sage; 1995. p. 76–99.
26. Chilcot J, Guirguis A, Friedli K, et al. Measuring fatigue using the multidimensional fatigue Inventory-20: a questionable factor structure in Haemodialysis patients. Nephron. 2017;136(2):121–6.
27. Hair J, Black W, Babin B, Anderson R. Multivariate data analysis. Upper Saddle River: Prentice-Hall, Inc; 2010.
28. Singer S, Kuhnt S, Zwerenz R, et al. Age- and sex-standardised prevalence rates of fatigue in a large hospital-based sample of cancer patients. Br J Cancer. 2011;105(3):445–51.
29. Dencker A, Sunnerhagen KS, Taft C, Lundgren-Nilsson A. Multidimensional fatigue inventory and post-polio syndrome - a Rasch analysis. Health Qual Life Outcomes. 2015;13:20.
30. Fillion L, Gelinas C, Simard S, Savard J, Gagnon P. Validation evidence for the French Canadian adaptation of the multidimensional fatigue inventory as a measure of cancer-related fatigue. Cancer Nurs. 2003;26(2):143–54. 31. Hagelin CL, Wengstrom Y, Runesdotter S, Furst CJ. The psychometric
properties of the Swedish multidimensional fatigue inventory MFI-20 in four different populations. Acta Oncol. 2007;46(1):97–104.
32. Buss T, Kruk A, Wisniewski P, Modlinska A, Janiszewska J, Lichodziejewska-Niemierko M. Psychometric properties of the polish version of the multidimensional fatigue Inventory-20 in cancer patients. J Pain Symptom Manage. 2014;48(4):730–7.
33. Myhren H, Ekeberg O, Toien K, Karlsson S, Stokland O. Posttraumatic stress, anxiety and depression symptoms in patients during the first year post intensive care unit discharge. Crit Care. 2010;14(1):R14.
34. Holzner B, Kemmler G, Meraner V, et al. Fatigue in ovarian carcinoma patients: a neglected issue? Cancer. 2003;97(6):1564–72.
35. Addington AM, Gallo JJ, Ford DE, Eaton WW. Epidemiology of unexplained fatigue and major depression in the community: the Baltimore ECA follow-up, 1981-1994. Psychol Med. 2001;31(6):1037–44.
36. McCann K, Boore JR. Fatigue in persons with renal failure who require maintenance haemodialysis. J Adv Nurs. 2000;32(5):1132–42.
37. Paiva CE, Barroso EM, Carneseca EC, et al. A critical analysis of test-retest reliability in instrument validation studies of cancer patients under palliative care: a systematic review. BMC Med Res Methodol. 2014;14:8.
38. Jubran A, Lawm G, Duffner LA, et al. Post-traumatic stress disorder after weaning from prolonged mechanical ventilation. Intensive Care Med. 2010;36(12):2030–7.
39. Chiumello D, Taccone P, Berto V, et al. Long-term outcomes in survivors of acute respiratory distress syndrome ventilated in supine or prone position. Intensive Care Med. 2012;38(2):221–9.
40. American Psychiatric Association A. Diagnostic and statistical manual of mental disorders: DSM-5 TM. 5th ed. Arlington, VA: American Psychiatric Association; 2013.