R E S E A R C H
Open Access
Development and validation of the
pulmonary tuberculosis scale of the system
of Quality of Life Instruments for Chronic
Diseases (QLICD-PT)
Yanchun Sun
1†, Zheng Yang
2†, Chonghua Wan
3*, Chuanzhi Xu
4, Liuping Chen
5, Lin Xu
5, Xiaoqing Zhang
4and Fei Yan
1*Abstract
Background:Generic assessments are less responsive to subtle changes due to specific diseases, making it challenging to fully understand the impact of pulmonary tuberculosis (TB) on patient’s quality of life (QOL).
Methods:We applied programmed decision procedures and theories on instrument development to develop the scale.
Two hundred patients with pulmonary TB participated in measuring QOL three times before and after treatments. We assessed the validity, reliability, and responsiveness of QLICD-PT using correlation analysis, factor analysis, multi-trait scaling analysis, randomized block analyses of variance with Least Significant Difference post-hoc tests.
Results:We composed QLICD-PT with 3 domains (28 items) for general QOL and 1 pulmonary TB specific domain (12 items). Correlation and factor analysis confirmed good structure validity and criterion-related validity when using Chinese version of the Medical Outcomes Short-Form Health Survey (SF-36) as a criterion. The internal consistency ofαvalues were higher than 0.70. The score changes after treatment were of statistical significance for the overall scale, physical domain and specific domain with effect size ranging from 0.32 to 0.72. No floor effects but small ceiling effects were observed at domain level.
Conclusions:As the first pulmonary TB-specific QOL scale developed by a module approach in Chinese, QLICD-PT has an acceptable degree of validity, reliability and responsiveness, and can be used to measure the life quality of PT patients specifically and sufficiently.
Keywords:Quality of life, Disease-specific instrument, QLICD-GM, Pulmonary tuberculosis
* Correspondence:[email protected];[email protected] †Yanchun Sun and Zheng Yang contributed equally to this work.
3School of Humanities and Management, Research Center for Quality of Life and Applied Psychology, Guangdong Medical University, Dongguan 523808, China
1
Department of Social Medicine, School of Public Health, National Key Laboratory of Health Technology Assessment (National Health and Family Planning Commission), Collaborative Innovation Center of Social Risks Governance in Health, Fudan University, Shanghai 200032, China Full list of author information is available at the end of the article
Pulmonary Tuberculosis (TB) is a chronic pulmonary in-fection caused by Mycobacterium tuberculosis. As a major global public health challenge, TB remained one of the top 10 causes of deaths worldwide, leading to more deaths than HIV/AIDS did [1]. According to World Health Organization, around 9.6 million people were diagnosed with TB in 2014, 1.2 million died from the disease [2]. With almost one million new cases in 2015, approximately 10% of the global incident cases, TB continues to be a major public health problem in China, and making China the third among the high TB burden countries [3].
Compared with the general population, patients with TB reported more deficits in their physical and mental well-being. TB patients are facing various formats of social rejections and isolations because TB has been stigmatized as a source of infection for the healthy indi-viduals [4–6], which may lead to work absenteeism, and in turn, substantial amounts of loss of productivity, and reduced monthly income. Stigmatization and negative emotions resulting from the illness could result in a long-term impairment of patient’s psychosocial well-being [7]. Emerging evidence also suggest that psychosocial bur-den amongst TB patients, after microbiological cure, may have a greater impact on health-related quality of life (HRQOL) than clinical symptoms [5,8], and QOL of TB patients has been substantially compromised [7–9].
The term quality of life (QOL) and HRQOL have been created to pivot a collection of health outcome research over the past decades. The term HRQOL is often used to indicate QOL from the perspective of health care or medical services people experience [10], hence, in this study, the term of QOL and HRQOL are interchange-able. QOL instruments are usually classified as being ei-ther generic or disease-specific. Generic measures can be used in almost any population, irrespective of the underlying condition or disorder. Since generic measures apply to a wide variety of populations, they allow for broad comparisons of relative impact of various diseases or interventions on QOL [11,12]. However, generic assess-ments are less responsive to subtle changes due to specific diseases or in specific population. The disease-specific in-struments have the advantage for assessing domains rele-vant to specific diseases and sensitive to capture small changes [11, 12]. However, to the best of our knowledge, one study has been published to assess QOL for patients with TB [13], making it challenging to fully understand the impact of TB on patient’s QOL. Therefore, it is urgent to develop a tuberculosis-specific QOL scale under the Chin-ese culture context.
The Chinese QOL instruments, i.e. Quality of Life Instru-ments for Chronic Diseases (QLICD), were developed, in-cluding both a generic module (QLICD-GM) [14], and
have been developed and validated for coronary heart dis-ease (QLICD-CHD) [15], irritable bowel syndrome (QLIC-D-IBS) [16] and for hypertension (QLICD-HY) [17] but not pulmonary TB, the leading causes of mortality and morbid-ity of infectious diseases among Chinese. Therefore, we made effort to make the missing piece of the puzzle and de-velop a set of QLICD, specifically for the Pulmonary TB (QLICD-PT). The aim of this paper was to describe the de-velopment and validation processes of QLICD-PT.
Methods
Development of the QLICD-PT
General principles and steps of developing QLICD-PT In principle, our effort to develop QLICD-PT followed the general steps described in detail elsewhere for QLICD-GM [14]. In brief, the QLICD-PT was created from two sub-modules, i.e., modified QLICD-GM (very left column of the Fig.1) and newly created pulmonary TB specific module (very right column of the Fig.1). We approached both modified QLICD-GM and pulmonary TB specific module by two mutually independent group efforts. The nominal group consisted of 16 individuals in-cluding six physicians, two nurses, one medical educator, and seven teachers/researchers (two in QOL/medical sta-tistics, one in epidemiology, two in sociology, two in psychology), and were created to make suggestions about what items should be included. The focus group with 10 experts including four physicians, one medical educator, and five teachers/ researchers (two in QOL/medical statis-tics, one in epidemiology, one in sociology, one in psych-ology) were formed to use programmed decision method to present the conceptual framework and select items pro-posed by nominal group. Overall, the nominal group was responsible for item presentation, whereas the focus group dealt with item selection and organization. During the process of item selection, we applied not only qualitative analysis such as group discussion, in-depth interviews, pilot tests and pretests, but also quantitative statistical methods of variation analysis, correlation analysis, factor analysis and cluster analysis procedures.
Modifying QLICD-GM
three facets: Cognition (COG), Will and Personality (WIP), and Emotion (EMO). Social domain (SOD) comprises 8 items (coded GSO1-GSO8), categorized into three facets: Interpersonal Communication (INC), Social Support and Security (SSS), and Social Role (SOR) (Table1).
Creating pulmonary TB specific module
Using similar procedure described above, we selected 21 items as the item pool of pulmonary TB specific module based on literature reviews, nominal/focus group discussion and patient interviews. A total of 4 facets with 12 items (coded PT1-PT12) made the way to the final module,
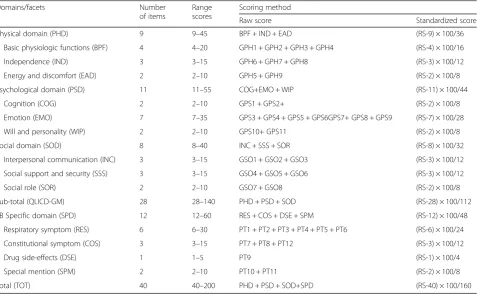
Table 1The construct and scoring method of the quality of life instrument QLICD-PT
Domains/facets Number
of items
Range scores
Scoring method
Raw score Standardized score
Physical domain (PHD) 9 9–45 BPF + IND + EAD (RS-9) × 100/36
Basic physiologic functions (BPF) 4 4–20 GPH1 + GPH2 + GPH3 + GPH4 (RS-4) × 100/16
Independence (IND) 3 3–15 GPH6 + GPH7 + GPH8 (RS-3) × 100/12
Energy and discomfort (EAD) 2 2–10 GPH5 + GPH9 (RS-2) × 100/8
Psychological domain (PSD) 11 11–55 COG+EMO + WIP (RS-11) × 100/44
Cognition (COG) 2 2–10 GPS1 + GPS2+ (RS-2) × 100/8
Emotion (EMO) 7 7–35 GPS3 + GPS4 + GPS5 + GPS6GPS7+ GPS8 + GPS9 (RS-7) × 100/28
Will and personality (WIP) 2 2–10 GPS10+ GPS11 (RS-2) × 100/8
Social domain (SOD) 8 8–40 INC + SSS + SOR (RS-8) × 100/32
Interpersonal communication (INC) 3 3–15 GSO1 + GSO2 + GSO3 (RS-3) × 100/12
Social support and security (SSS) 3 3–15 GSO4 + GSO5 + GSO6 (RS-3) × 100/12
Social role (SOR) 2 2–10 GSO7 + GSO8 (RS-2) × 100/8
Sub-total (QLICD-GM) 28 28–140 PHD + PSD + SOD (RS-28) × 100/112
TB Specific domain (SPD) 12 12–60 RES + COS + DSE + SPM (RS-12) × 100/48
Respiratory symptom (RES) 6 6–30 PT1 + PT2 + PT3 + PT4 + PT5 + PT6 (RS-6) × 100/24
Constitutional symptom (COS) 3 3–15 PT7 + PT8 + PT12 (RS-3) × 100/12
Drug side-effects (DSE) 1 1–5 PT9 (RS-1) × 100/4
Special mention (SPM) 2 2–10 PT10 + PT11 (RS-2) × 100/8
Total (TOT) 40 40–200 PHD + PSD + SOD+SPD (RS-40) × 100/160
RSraw score,SSstandardized score
covering Respiratory Symptom (RES), Constitutional Symp-tom (COS), Drug Side-effects (DSE) and Special Mention (SPM) to pulmonary TB (see Table1).
Validation of the QLICD-PT Data collection and scoring
The QLICD-PT, combining both modified QLICD-GM and pulmonary TB specific facets, was used to evaluate patients with pulmonary TB in a field survey for asses-sing the psychometric properties. The survey was carried out in ten Disease Control and Prevention Centers se-lected in Yunnan Province, China. The study population was limited to patients with pulmonary TB who were able to read and understand the questionnaire. The par-ticipating investigators included doctors, nurses, and medical postgraduates. The investigators explained the purpose and the scale to the patients and obtained in-formed consent from patients who agreed to participate in the study. The study protocol and informed consent form were approved by the Institutional Review Board of the investigators’institutions. Each respondent (n= 200) completed the questionnaire before receiving treatment as the 1st wave of assessment. After 2 months of treat-ment, respondents (n= 198) participated in the 2nd wave of assessment, and after 6 months of treatment, a total of 175 respondents participated in the 3rd wave of as-sessment to evaluate responsiveness.
Due to lack of an agreed-upon gold standard for assessing QOL of pulmonary TB, and convergent and discriminant validity of QLICD-PT, we used the Chinese version of the Medical Outcomes Study 36-Item Short-Form Health Sur-vey (SF-36) [18], one of the commonly used generic QOL scales to collect data for assessing the criterion-related val-idity of QLICD-PT. SF-36 included eight subscales: Physical Function (PF), Role-Physical (RP), Bodily Pain (BP), General Health (GH), Vitality (VT), Social Function (SF), Role-Emotional (RE), and Mental Health (MH).
Analytic steps and indicators used to measure the validity Each item of QLICD-PT is rated in a five-level Likert scoring system, namely, not at all, a little bit, somewhat, quite a bit, and very much. The positively stated items were scored from one to five, while the negatively stated items were scored from five to one. By adding together within the domain/facet item scores, we obtained the raw scores by items, facets, and domains. The overall score of the scale is the sum of all domain scores. For the purpose of comparison, all the domain scores were linearly converted into a standardized score (SS) ranging from 0 to 100 using the following equation: SS = (RS -Min) × 100/R, where RS, Min, and R represent the raw score, minimum score, and range of scores, respectively (see Table 1 for details). We assessed the validity of QLICD-PT from perspective of validity (construct validity,
content validity), reliability (internal consistency), and re-sponsiveness as recommended [13].
Construct validity
We calculated Pearson’s correlation coefficient between the similar domains of QLICD-PT and SF-36 to assess convergent validity, one aspect of construct validity. Multi-trait scaling analysis [19] was applied to test item convergent and discriminant validity with the following two criteria: convergent validity is supported when the item-domain/facet correlation is 0.40 or above; and dis-criminant validity is showed when the item-domain/facet correlation is higher than that of other domains/facets. We performed factor analysis with Varimax Rotation to examine the coincidence between components extracted from data and theoretical construct of the instrument, and confirm the construct validity.
Content validity
The floor and ceiling effects are characterized by scores being concentrated on the lowest and highest sides of the overall distribution, respectively. If floor and ceiling effects are present, it is likely that extreme items are missing in the lower or upper end of the scale, indicating limited content validity. As a result, patients with the lowest or highest score can’t be distinguished from each other, thus reliability is reduced [20]. The floor and ceil-ing effects of each domain/facet were evaluated. Floor and ceiling effects were defined to be present if more than 15% of the patients reported the minimum or max-imum possible score [20].
Internal consistency (reliability)
Cronbach’s alpha coefficient is common practice in scale development to evaluate the internal consistency of reli-ability. A score between 0.70 and 0.95 has been sug-gested as evidence of adequate internal consistency [19]. To assess internal consistency, Cronbach’s alpha coeffi-cient was calculated separately for each domain/facet.
Responsiveness
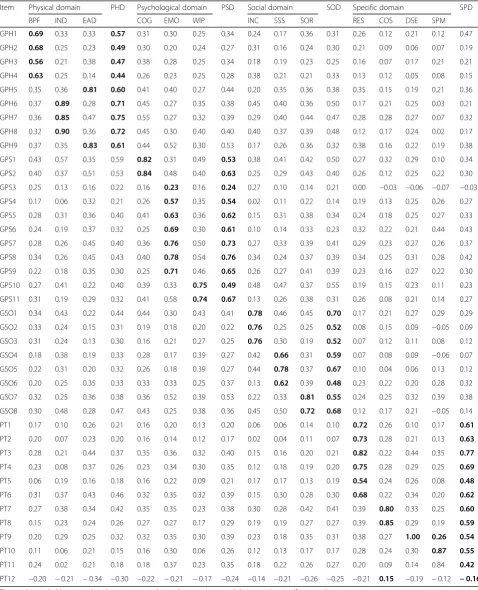
Table 2Correlation coefficients r among items and domains/facets of QLICD-PT (n= 200)
Item Physical domain PHD Psychological domain PSD Social domain SOD Specific domain SPD
BPF IND EAD COG EMO WIP INC SSS SOR RES COS DSE SPM
GPH1 0.69 0.33 0.33 0.57 0.31 0.30 0.25 0.34 0.24 0.17 0.36 0.31 0.26 0.12 0.21 0.12 0.47
GPH2 0.68 0.25 0.23 0.49 0.30 0.20 0.24 0.27 0.31 0.16 0.24 0.30 0.21 0.09 0.06 0.07 0.19
GPH3 0.56 0.21 0.38 0.47 0.38 0.28 0.25 0.34 0.18 0.19 0.23 0.25 0.16 0.07 0.17 0.21 0.21
GPH4 0.63 0.25 0.14 0.44 0.26 0.23 0.25 0.28 0.38 0.21 0.21 0.33 0.13 0.12 0.05 0.08 0.15
GPH5 0.35 0.36 0.81 0.60 0.41 0.40 0.27 0.44 0.20 0.35 0.36 0.38 0.35 0.15 0.19 0.21 0.36
GPH6 0.37 0.89 0.28 0.71 0.45 0.27 0.35 0.38 0.45 0.40 0.36 0.50 0.17 0.21 0.25 0.03 0.21
GPH7 0.36 0.85 0.47 0.75 0.55 0.27 0.32 0.39 0.29 0.40 0.44 0.47 0.28 0.28 0.27 0.07 0.32
GPH8 0.32 0.90 0.36 0.72 0.45 0.30 0.40 0.40 0.40 0.37 0.39 0.48 0.12 0.17 0.24 0.02 0.17
GPH9 0.37 0.35 0.83 0.61 0.44 0.52 0.30 0.53 0.17 0.26 0.36 0.32 0.38 0.16 0.22 0.19 0.38
GPS1 0.43 0.57 0.35 0.59 0.82 0.31 0.49 0.53 0.38 0.41 0.42 0.50 0.27 0.32 0.29 0.10 0.34
GPS2 0.40 0.37 0.51 0.53 0.84 0.48 0.40 0.63 0.25 0.29 0.43 0.40 0.26 0.12 0.25 0.22 0.30
GPS3 0.25 0.13 0.16 0.22 0.16 0.23 0.16 0.24 0.27 0.10 0.14 0.21 0.00 −0.03 −0.06 −0.07 −0.03
GPS4 0.17 0.06 0.32 0.21 0.26 0.57 0.35 0.54 0.02 0.11 0.22 0.14 0.19 0.13 0.25 0.26 0.27
GPS5 0.28 0.31 0.36 0.40 0.41 0.63 0.36 0.62 0.15 0.31 0.38 0.34 0.24 0.18 0.25 0.27 0.33
GPS6 0.24 0.19 0.37 0.32 0.25 0.69 0.30 0.61 0.10 0.14 0.33 0.23 0.32 0.22 0.21 0.44 0.43
GPS7 0.28 0.26 0.45 0.40 0.36 0.76 0.50 0.73 0.27 0.33 0.39 0.41 0.29 0.23 0.27 0.26 0.37
GPS8 0.34 0.26 0.45 0.43 0.40 0.78 0.54 0.76 0.34 0.24 0.37 0.39 0.34 0.25 0.31 0.28 0.42
GPS9 0.22 0.18 0.35 0.30 0.25 0.71 0.46 0.65 0.26 0.27 0.41 0.39 0.23 0.16 0.27 0.22 0.30
GPS10 0.27 0.41 0.22 0.40 0.39 0.33 0.75 0.49 0.48 0.47 0.37 0.55 0.19 0.15 0.23 0.11 0.23
GPS11 0.31 0.19 0.29 0.32 0.41 0.58 0.74 0.67 0.13 0.26 0.38 0.31 0.26 0.08 0.21 0.14 0.27
GSO1 0.34 0.43 0.22 0.44 0.44 0.30 0.43 0.41 0.78 0.46 0.45 0.70 0.17 0.21 0.27 0.29 0.29
GSO2 0.33 0.24 0.15 0.31 0.19 0.18 0.20 0.22 0.76 0.25 0.25 0.52 0.08 0.15 0.09 −0.05 0.09
GSO3 0.31 0.24 0.13 0.30 0.16 0.21 0.27 0.25 0.76 0.30 0.19 0.52 0.07 0.12 0.11 0.08 0.12
GSO4 0.18 0.38 0.19 0.33 0.28 0.17 0.39 0.27 0.42 0.66 0.31 0.59 0.07 0.08 0.09 −0.06 0.07
GSO5 0.22 0.31 0.20 0.32 0.26 0.18 0.39 0.27 0.44 0.78 0.37 0.67 0.10 0.04 0.06 0.13 0.12
GSO6 0.20 0.25 0.35 0.33 0.33 0.33 0.25 0.37 0.13 0.62 0.39 0.48 0.23 0.22 0.20 0.28 0.32
GSO7 0.32 0.25 0.36 0.38 0.36 0.52 0.39 0.53 0.22 0.33 0.81 0.55 0.24 0.25 0.32 0.39 0.38
GSO8 0.30 0.48 0.28 0.47 0.43 0.25 0.38 0.36 0.45 0.50 0.72 0.68 0.12 0.17 0.21 −0.05 0.14
PT1 0.17 0.10 0.26 0.21 0.16 0.20 0.13 0.20 0.06 0.06 0.14 0.10 0.72 0.26 0.10 0.17 0.61
PT2 0.20 0.07 0.23 0.20 0.16 0.14 0.12 0.17 0.02 0.04 0.11 0.07 0.73 0.28 0.21 0.13 0.63
PT3 0.28 0.21 0.44 0.37 0.35 0.36 0.32 0.40 0.15 0.16 0.20 0.21 0.82 0.22 0.44 0.35 0.77
PT4 0.23 0.08 0.37 0.26 0.23 0.34 0.30 0.35 0.12 0.18 0.19 0.20 0.75 0.28 0.29 0.25 0.69
PT5 0.06 0.19 0.16 0.18 0.16 0.22 0.09 0.21 0.17 0.17 0.13 0.19 0.54 0.24 0.26 0.08 0.48
PT6 0.31 0.37 0.43 0.46 0.32 0.35 0.32 0.39 0.15 0.30 0.28 0.30 0.68 0.22 0.34 0.20 0.62
PT7 0.27 0.38 0.34 0.42 0.35 0.35 0.23 0.38 0.30 0.28 0.42 0.41 0.39 0.80 0.33 0.25 0.60
PT8 0.15 0.23 0.24 0.26 0.27 0.27 0.17 0.29 0.19 0.19 0.27 0.27 0.39 0.85 0.29 0.19 0.59
PT9 0.20 0.29 0.25 0.32 0.32 0.35 0.30 0.39 0.23 0.18 0.35 0.31 0.38 0.27 1.00 0.26 0.54
PT10 0.11 0.06 0.21 0.15 0.16 0.30 0.06 0.26 0.12 0.13 0.17 0.17 0.28 0.24 0.30 0.87 0.55
PT11 0.24 0.02 0.21 0.18 0.18 0.37 0.23 0.35 0.18 0.22 0.26 0.27 0.20 0.09 0.14 0.84 0.42
PT12 −0.20 −0.21 −0.34 −0.30 −0.22 −0.21 −0.17 −0.24 −0.14 −0.21 −0.26 −0.25 −0.21 0.15 −0.19 −0.12 −0.16
The numbers in bold are aimed to show strong correlations between items and their own domains/facets easily
PHDphysical domain,BPFbasic physiological functions,INDindependence,EADenergy and discomfort,PSDpsychological domain,COGcognition,EMOemotion,
WIPwill and personality,SODsocial domain,INCinterpersonal communication,SSSsocial support and security,SORsocial role,SPDspecific domain,RES
Socio-demographic characteristics of the sample
The 200 patients with pulmonary TB varied in age from 15 to 79 years with a median age of 37.0 and a mean age of 39.2 ± 16.5 years old. About two thirds (68.0%) were men, and 131 (65.5%) were of Han ethnicity, including minorities of Yi, Bai, Hui, etc. The majority were currently married (133 cases, 66.5%), while 67 (33.5%) were single or previ-ously married. Regarding of education level, 71 (35.5%) completed primary school, while 107 (53.5%) were gradu-ates of middle school and 22 (11.0%) had a college or post-graduate degree. More than half of the study partici-pants were farmers (n= 116, 58.0%), with 15 cases (7.5%) of workers, 4 (2.0%) cases of governmental officers, 65 (32.5%) unspecified cases. Government-sponsored health insurance program covered 70% of the cases (n= 141, 70.5%).
Correlation analyses showed that there were strong asso-ciations between items and their own domains/facets (most correlation coefficients are higher than 0.5), but weak relationship between items across domains/facets and between domains/facets (Table2). For example, cor-relation coefficients between items of GPH1-GPH9 (in bold) are higher than those across domains.
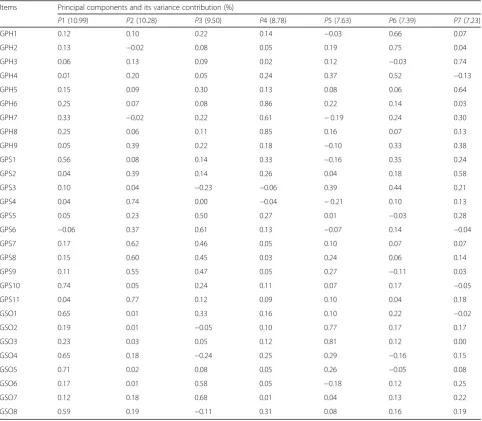
The Kaiser-Meyer-Olkin values for general module and specific module were 0.84, and 0.75, respectively, ex-ceeding the recommended value of 0.60, indicating a suitability of factor analysis. And Bartlett’s Tests of Sphericity were statistically significant (P < 0.001), also supporting the factorability of the correlation matrix. There were seven principal components (initial eigen-values> 1) abstracted from 28 items of the general
Table 3Principal components and factor loadings of the general module of QLICD-PT (n= 200) Items Principal components and its variance contribution (%)
P1 (10.99) P2 (10.28) P3 (9.50) P4 (8.78) P5 (7.63) P6 (7.39) P7 (7.23)
GPH1 0.12 0.10 0.22 0.14 −0.03 0.66 0.07
GPH2 0.13 −0.02 0.08 0.05 0.19 0.75 0.04
GPH3 0.06 0.13 0.09 0.02 0.12 −0.03 0.74
GPH4 0.01 0.20 0.05 0.24 0.37 0.52 −0.13
GPH5 0.15 0.09 0.30 0.13 0.08 0.06 0.64
GPH6 0.25 0.07 0.08 0.86 0.22 0.14 0.03
GPH7 0.33 −0.02 0.22 0.61 −0.19 0.24 0.30
GPH8 0.25 0.06 0.11 0.85 0.16 0.07 0.13
GPH9 0.05 0.39 0.22 0.18 −0.10 0.33 0.38
GPS1 0.56 0.08 0.14 0.33 −0.16 0.35 0.24
GPS2 0.04 0.39 0.14 0.26 0.04 0.18 0.58
GPS3 0.10 0.04 −0.23 −0.06 0.39 0.44 0.21
GPS4 0.04 0.74 0.00 −0.04 −0.21 0.10 0.13
GPS5 0.05 0.23 0.50 0.27 0.01 −0.03 0.28
GPS6 −0.06 0.37 0.61 0.13 −0.07 0.14 −0.04
GPS7 0.17 0.62 0.46 0.05 0.10 0.07 0.07
GPS8 0.15 0.60 0.45 0.03 0.24 0.06 0.14
GPS9 0.11 0.55 0.47 0.05 0.27 −0.11 0.03
GPS10 0.74 0.05 0.24 0.11 0.07 0.17 −0.05
GPS11 0.04 0.77 0.12 0.09 0.10 0.04 0.18
GSO1 0.65 0.01 0.33 0.16 0.10 0.22 −0.02
GSO2 0.19 0.01 −0.05 0.10 0.77 0.17 0.17
GSO3 0.23 0.03 0.05 0.12 0.81 0.12 0.00
GSO4 0.65 0.18 −0.24 0.25 0.29 −0.16 0.15
GSO5 0.71 0.02 0.08 0.05 0.26 −0.05 0.08
GSO6 0.17 0.01 0.58 0.05 −0.18 0.12 0.25
GSO7 0.12 0.18 0.68 0.01 0.04 0.13 0.22
module (QLICD-PT) by factor analysis, accounting for 61.80% of the cumulative variance (Table 3). The first, third and fifth principal components mainly represented the social domain with higher loadings on GSO1 (0.65), GSO4 (0.65), GSO5 (0.71), GSO8 (0.59), GSO6 (0.58), GSO7 (0.68), GSO2 (0.77) and GSO3 (0.81). The second principal component largely reflected the psychological do-main with higher loadings on GPS4 (0.74), GPS7 (0.62), GPS8 (0.60), GPS9 (0.55) and GPS11 (0.77). The fourth, sixth and seventh generally depicted the physical domain with higher loadings on GPH6 (0.86), GPH7 (0.61), GPH8 (0.85), GPH1 (0.66), GPH2 (0.75), GPH4 (0.52), GPH3 (0.74) and GPH5 (0.64). Similarly, the principal component factor analysis extracted 4 principal components from the 12 items of the specific module with the cumulative vari-ance of 65.70%, reflecting 4 facets of this module (Table4). The first and third components represented the two facts of respiratory symptom and drug side-effects with higher factor loadings on PT3 (0.74), PT4 (0.72), PT5 (0.64), PT6 (0.77), PT9 (0.55), PT1 (0.90) and PT2 (0.87). The second component depicted the facet of constitutional symptom with higher factor loadings on PT7 (0.83) and PT8 (0.81). The fourth component captured the facet of special men-tion with higher factor loadings on PT10 (0.76) and PT11
(0.85). The above analysis results confirmed the theoretical construct, showing good construct validity.
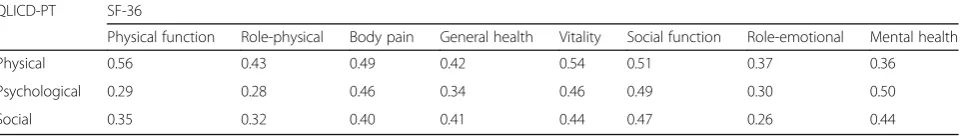
Correlation coefficients among the domain scores of the QLICD-PT and SF-36 were presented in the Table5, showing that the correlations between the same and similar domains are generally higher than those between different and non-similar domains. For example, the co-efficient between the physical of QLICD-PT and physical function of SF-36 was 0.56, higher than any other coeffi-cients in this row. Similarly, the coefficient between the social domain of QLICD-PT and social function of SF-36 was 0.47, higher than any other coefficients in this row. These confirmed the criterion-related validity to a reasonable degree and an acceptable level of the conver-gent and diverconver-gent validity. For Content validity, No floor effects was detected, but small ceiling effects (≤2%) were identified in the domains and in the total scale. While at the facets, significant ceiling effects were also found in three facets, ie. IND (48.5%), WIP (17.5%) and DSE (53.0%). (Table6).
Reliability and responsiveness
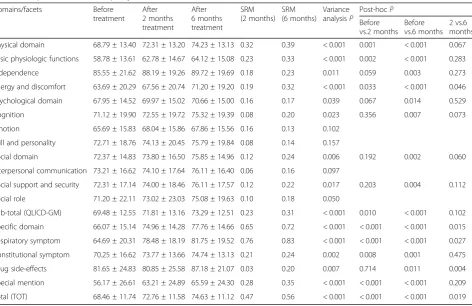
The domain-specific Cronbach’sα(for internal consistency) were higher than 0.70 for all domains. At the facet level, values of Cronbach’sαranged from 0.20 to 0.83 (Table6). There were statistically significant differences between before and after 2 months treatments for physical domain, specific domain, general module and the overall scale (P < 0.05) with SRMs ranging from 0.23 to 0.65. There were statistically significant differences between before and after 6 months treatments for all domains, general module and the overall scale (P < 0.05) with SRMs ran-ging from 0.17 to 0.72. At the domain level, significant dif-ference was observed between 2 and 6 months treatments only for specific domain (P< 0.05) (Table7).
Discussion
Based on the original version QLICD-GM (a generic QOL evaluation instruments for Chronic disease), this version of QLICD-GM has made several improvements to in-crease the comprehensibility and accessibility. For ex-ample, sexual function was adopted as one component of the facet BPF (Basic Psychological Functions) rather than listing as an independent facet since the low response rate
Table 5Correlation coefficients among domains scores of QLICD-PT and SF-36 (n= 200) QLICD-PT SF-36
Physical function Role-physical Body pain General health Vitality Social function Role-emotional Mental health
Physical 0.56 0.43 0.49 0.42 0.54 0.51 0.37 0.36
Psychological 0.29 0.28 0.46 0.34 0.46 0.49 0.30 0.50
Social 0.35 0.32 0.40 0.41 0.44 0.47 0.26 0.44
*All coefficients have statistical significance (P< 0.05)
Table 4Principal components and factor loadings of the specific module of QLICD-PT (n= 200)
Items Principal components and its variance contribution (%)
P1 (21.54) P2 (15.97) P3 (15.13) P4 (13.05)
PT1 0.18 0.16 0.90 0.07
PT2 0.22 0.22 0.87 0.02
PT3 0.74 0.11 0.31 0.33
PT4 0.72 0.13 0.21 0.20
PT5 0.64 0.05 0.13 −0.18
PT6 0.77 0.08 0.10 0.10
PT7 0.21 0.83 0.11 0.10
PT8 0.21 0.81 0.15 −0.02
PT9 0.55 0.39 −0.15 0.18
PT10 0.21 0.15 0.02 0.76
PT11 0.02 0.08 0.06 0.85
n
Domains/facets Internal consistency Coefficientα Floor effects (%) Ceiling effects (%)
Physical domain (PHD) 0.78 0.0 0.5
Basic physiologic functions (BPF) 0.50 0.0 1.0
Independence (IND) 0.83 0.5 48.5
Energy and discomfort (EAD) 0.51 1.0 3.0
Psychological domain (PSD) 0.81 0.0 0.5
Cognition (COG) 0.55 0.0 13.0
Emotion (EMO) 0.74 0.0 0.5
Will and personality (WIP) 0.20 0.0 17.5
Social domain (SOD) 0.72 0.0 2.0
Interpersonal communication (INC) 0.61 0.0 11.5
Social support and security (SSS) 0.42 0.0 4.5
Social role (SOR) 0.30 1.5 14.5
Sub-total (QLICD-GM) 0.89 0.0 0.0
Specific domain (SPD) 0.78 0.0 0.0
Respiratory symptom (RES) 0.80 0.5 1.5
Constitutional symptom (COS) 0.26 0.0 1.0
Drug side-effects (DSE) – 2.0 53.0
Special mention (SPM) 0.62 5.5 5.5
Total (TOT) 0.90 0.0 0.0
-not acceptable/suitable
Table 7Responsiveness of the quality of life instrument QLICD-PT (xs) (n= 158) Domains/facets Before
treatment After 2 months treatment
After 6 months treatment
SRM (2 months)
SRM (6 months)
Variance analysisP
Post-hocP
Before vs.2 months
Before vs.6 months
2 vs.6 months
Physical domain 68.79 ± 13.40 72.31 ± 13.20 74.23 ± 13.13 0.32 0.39 < 0.001 0.001 < 0.001 0.067
Basic physiologic functions 58.78 ± 13.61 62.78 ± 14.67 64.12 ± 15.08 0.23 0.33 < 0.001 0.002 < 0.001 0.283
Independence 85.55 ± 21.62 88.19 ± 19.26 89.72 ± 19.69 0.18 0.23 0.011 0.059 0.003 0.273
Energy and discomfort 63.69 ± 20.29 67.56 ± 20.74 71.20 ± 19.20 0.19 0.32 < 0.001 0.033 < 0.001 0.046
Psychological domain 67.95 ± 14.52 69.97 ± 15.02 70.66 ± 15.00 0.16 0.17 0.039 0.067 0.014 0.529
Cognition 71.12 ± 19.90 72.55 ± 19.72 75.32 ± 19.39 0.08 0.20 0.023 0.356 0.007 0.073
Emotion 65.69 ± 15.83 68.04 ± 15.86 67.86 ± 15.56 0.16 0.13 0.102
Will and personality 72.71 ± 18.76 74.13 ± 20.45 75.79 ± 19.84 0.08 0.14 0.157
Social domain 72.37 ± 14.83 73.80 ± 16.50 75.85 ± 14.96 0.12 0.24 0.006 0.192 0.002 0.060
Interpersonal communication 73.21 ± 16.62 74.10 ± 17.64 76.11 ± 16.40 0.06 0.16 0.097
Social support and security 72.31 ± 17.14 74.00 ± 18.46 76.11 ± 17.57 0.12 0.22 0.017 0.203 0.004 0.112
Social role 71.20 ± 22.11 73.02 ± 23.03 75.08 ± 19.63 0.10 0.18 0.050
Sub-total (QLICD-GM) 69.48 ± 12.55 71.81 ± 13.16 73.29 ± 12.51 0.23 0.31 < 0.001 0.010 < 0.001 0.102
Specific domain 66.07 ± 15.14 74.96 ± 14.28 77.76 ± 14.66 0.65 0.72 < 0.001 < 0.001 < 0.001 0.015
Respiratory symptom 64.69 ± 20.31 78.48 ± 18.19 81.75 ± 19.52 0.76 0.83 < 0.001 < 0.001 < 0.001 0.027
Constitutional symptom 70.25 ± 16.62 73.77 ± 13.66 74.74 ± 13.13 0.21 0.24 0.002 0.008 0.001 0.475
Drug side-effects 81.65 ± 24.83 80.85 ± 25.58 87.18 ± 21.07 0.03 0.20 0.007 0.714 0.011 0.004
Special mention 56.17 ± 26.61 63.21 ± 24.89 65.59 ± 24.30 0.28 0.35 < 0.001 < 0.001 < 0.001 0.209
of sex-related item among Chinese participants would in-fluence the whole score of facet due to the privacy of sex issue in China. Moreover, several items were reworded for better straightforwardness, and similar items were com-bined for better simplicities. Furthermore, TB-specific do-main rather than generic dodo-main was developed and applied to measure the characteristics of pulmonary TB. By combining the modified general module QLICD-GM and the newly developed disease-specific module for pulmonary TB, we created a new QOL assessment scale QLICD-PT with psychometric strength.
Generally, a practical QOL instrument should be vali-dated in terms of at least three aspects: validity, reliability and responsiveness [13]. In this study, correlation coeffi-cients between the similar domains of QLICD-PT and SF-36 revealed a reasonably good criterion-related validity, and convergent and divergent validity. Correlation analysis indicated that strong association between items and their own domains/facets, but weak correlations between items and other domains/facets. Factor analysis showed that components extracted from the data coincided with the theoretical constructs of the instrument, confirming the construct validity. No floor effects and very small ceiling effects (≤2%) in the domains indicated a possibility to de-tect QOL improvement and deterioration over time if there are, and the item design of the scale QLICD-PT is reasonable. Internal consistency was moderate. Table7 re-vealed that QOL score changes after treatment were of statistically significance on physical domain, specific do-main and overall scale with SRMs ranging from 0.32 to 0.72. Given that no significant changes is expected for the psychological and social domains pertaining stable traits posttreatment, QLICD-PT can be concluded to be moder-ate responsiveness.
Limited efforts have been made to develop specific in-struments to assess QOL of patients with tuberculosis (TB) [22], including DR-12 [23], and FACIT-TB (Functional As-sessment of Chronic Illness Therapy-tuberculosis) [13]. DR-12 was developed in Indian and first published in 2003, which consists of 12 items, among them 7 cover TB symp-toms and 5 relate to socio-psychological characteristics and exercise adaptation. However, response options were pre-sented on 3 point scale, largely reducing the variation of the data collected, compromising its discriminant validity. FACIT-TB was developed in Iraq and published in 2015, which consists of 27 items of the core questionnaire, and a set of 20 items referring to diseases symptoms [13]. With more items included than DR-12, FACIT-TB is capable to pick up five domains. Being relatively brief and easy to ad-ministrate and calculate scores, FACIT-TB is in particularly suitable for the use in clinical trials [22]. However, using Consensus-Based Standards for the assortment of health status measurement instruments (COSMIN) check-list to assess methodologic quality of the HRQOL measures in
development studies, Khan et al. shown that most of the studies, including DR-12 and FACIT-TB, were rated as fair to poor largely due to insufficient information collected. Therefore, it was recommended to take the advantage of good sensitivity of generic scales and excellent speci-ficity of disease-specific scales and combine generic and disease-specific scale for a mixed scale to quantify the QOL of TB patients [24]. Our effort supports this suggestion and created a scale with both feasibility of measurement uses and qualities of methodology.
Strengths and limitations
A recent literature failed to identify any non-English HRQOL measure developed in TB population of non-English speaking countries [22]. The current study is the first one developed in non-English language for TB patients among non-English speaking countries. The QLICD-PT is certainly subject to various limita-tions. The TB patients who participated in the valid study were limited with the individuals who were able to read and understand the questionnaire. Although illiterate rate in China is overall very low, however, studies have repeated demonstrated that population with low level of educational attainment and low come levels are substantially more vulnerable to TB in-fections, and TB prevalence is relatively high among poor communities with low education levels. Cautions must be exercised. Psychometric properties and exter-nal validity of QLID-PT should be further evaluated among population with low educational attainment when proxy interview is used. Cultural proficiency should also be carefully assessed when QLICD-PT was translated into language other than Chinese.
Conclusions
Combining modified generic model and TB specific model, we used a rigorous method to develop a scale to better characterize QOL in Chinese patients with pul-monary TB. The 40-item QLICD-PT is a part of the QLICD instrument system, which showed acceptable certain degrees of validity, reliability, and responsiveness. Published evidence of reliability and validity indicates that FACIT-TB is the best QOL measurement tool and one of the commonly used among TB patients [22], QLICD-PT evaluated in the current study provides an alternative, at least, among Chinese.
Abbreviations
In carrying out this research project, we have received substantial assistance from staffs of Yunnan CDC, the first affiliated hospital of Kunming Medical University and the affiliated hospital of Guangdong Medical University. We sincerely acknowledge all the support. We would like to thank Prof. Jian Zhang from Georgia Southern University, Prof. Truls Ostbye from Duke University and Yi Qian from Fudan University for revising the manuscript.
Funding
This study was supported by the National Natural Science Foundation of China (71373058, 30860248), the Science and Technological Planning Program of Guangdong Province (2013B021800074).
Availability of data and materials Please contact the authors for data requests.
Authors’contributions
YCS, ZY, CHW, CZX, and FY designed the study. YCS, LPC, LX, and XQZ performed the data collection. YCS, CZX, and LPC performed data analyses. YCS drafted the manuscript and FY revised the manuscript deeply. All authors contributed to interpreting the data. All authors have read and approved the final manuscript.
Ethics approval and consent to participate
The study protocol was approved by the Institutional Review Board of the investigators’institutions. The respondents were anonymous, voluntary and provided consent for participation.
Consent for publication
No individual’s personal data has been included.
Competing interests
The authors declare that they have no competing interests.
Publisher’s Note
Springer Nature remains neutral with regard to jurisdictional claims in published maps and institutional affiliations.
Author details
1
Department of Social Medicine, School of Public Health, National Key Laboratory of Health Technology Assessment (National Health and Family Planning Commission), Collaborative Innovation Center of Social Risks Governance in Health, Fudan University, Shanghai 200032, China.2School of Public Health, Guangdong Medical University, Dongguan 523808, China. 3School of Humanities and Management, Research Center for Quality of Life and Applied Psychology, Guangdong Medical University, Dongguan 523808, China.4School of Public Health, Kunming Medical University, Kunming 650500, China.5Yunnnan Center for Disease Control and Prevention, Kunming 650022, China.
Received: 5 January 2018 Accepted: 25 June 2018
References
1. Organization WH: Global Tuberculosis Report 2017.http://www.who.int/tb/ publications/global_report/en/.
2. Silva JP, Appelberg R, Gama FM. Antimicrobial peptides as novel anti-tuberculosis therapeutics. Biotechnol Adv. 2016;34:924–40. 3. Huang L, Li XX, Abe EM, Xu L, Ruan Y, Cao CL, Li SZ. Spatial-temporal
analysis of pulmonary tuberculosis in the northeast of the Yunnan province, People's Republic of China. Infect Dis Poverty. 2017;6:53.
4. Marra CA, Marra F, Cox VC, Palepu A, Fitzgerald JM. Factors influencing quality of life in patients with active tuberculosis. Health Qual Life Outcomes. 2004;2:58.
5. Hansel NN, Wu AW, Chang B, Diette GB. Quality of life in tuberculosis: patient and provider perspectives. Qual Life Res. 2004;13:639–52. 6. Macq J, Solis A, Martinez G, Martiny P, Dujardin B. An exploration of the
social stigma of tuberculosis in five“municipios”of Nicaragua to reflect on local interventions. Health Policy. 2005;74:205–17.
7. Guo N, Marra F, Marra CA. Measuring health-related quality of life in tuberculosis: a systematic review. Health Qual Life Out. 2009;7:14.
review of the English language literature. Qual Life Res. 2004;13:1633–42. 9. Bauer M, Leavens A, Schwartzman K. A systematic review and meta-analysis
of the impact of tuberculosis on health-related quality of life. Qual Life Res. 2013;22:2213–35.
10. Bonomi AE, Patrick DL, Bushnell DM, Martin M. Validation of the United States’version of the World Health Organization quality of life (WHOQOL) instrument. J Clin Epidemiol. 2000;53:1–12.
11. European Network for Health Technolology Assessment (eunethta): Guideline Endpoints used for Relative Effectiveness Assessment: Health-Related Quality of Life and Utility Measures.; 2015.
12. Patrick DL, Deyo RA. Generic and disease-specific measures in assessing health status and quality of life. Med Care. 1989;27:S217–32.
13. Abdulelah J, Sulaiman SAS, Hassali MA, Blebil AQ, Awaisu A, Bredle JM. Development and psychometric properties of a tuberculosis-specific multidimensional health-related quality-of-life measure for patients with pulmonary tuberculosis. Value Health Reg Issues. 2015;6:53–9.
14. Wan C, Tu X, Messing S, Li X, Yang Z, Zhao X, Gao L, Yang Y, Pan J, Zhou Z. Development and validation of the general module of the system of quality of life instruments for chronic diseases and its comparison with SF-36. J Pain Symptom Manag. 2011;42:93–104.
15. Wan C, Li H, Fan X, Yang R, Pan J, Chen W, Zhao R. Development and validation of the coronary heart disease scale under the system of quality of life instruments for chronic diseases QLICD-CHD: combinations of classical test theory and generalizability theory. Health Qual Life Outcomes. 2014;12:82. 16. Lei P, Lei G, Tian J, Zhou Z, Zhao M, Wan C. Development and validation of
the irritable bowel syndrome scale under the system of quality of life instruments for chronic diseases QLICD-IBS: combinations of classical test theory and generalizability theory. Int J Color Dis. 2014;29:1245–55. 17. Wan C, Jiang R, Tu XM, Tang W, Pan J, Yang R, Li X, Yang Z, Zhang X. The
hypertension scale of the system of quality of life instruments for chronic diseases, QLICD-HY: a development and validation study. Int J Nurs Stud. 2012;49:465–80.
18. Ware JJ. SF-36 health survey update. Spine (Phila Pa 1976). 2000;25:3130–9. 19. D R H. Beyond internal consistency reliability: rationale and user's guide for
multitrait analysis program on the microcomputer. Behav Res Methods Instrum Comp. 1990;22:167–75.
20. Terwee CB, Bot SD, de Boer MR, van der Windt DA, Knol DL, Dekker J, Bouter LM, de Vet HC. Quality criteria were proposed for measurement properties of health status questionnaires. J Clin Epidemiol. 2007;60:34–42. 21. Husted JA, Cook RJ, Farewell VT, Gladman DD: Methods for assessing
responsiveness: a critical review and recommendations. J Clin Epidemiol. 2000 53:459–468.
22. Khan S, Imtiaz A, Khan AN. Health status and quality of life in tuberculosis: systematic review of study design, instruments, measuring properties and outcomes. Health Sci J. 2017 11: 1.
23. Dhingra VK, Rajpal S. Health related quality of life (HRQL) scoring (DR-12 score) in tuberculosis–additional evaluative tool under DOTS. J Commun Dis. 2005;37:261–8.