Identify Families at Risk for Food Insecurity
WHAT’S KNOWN ON THIS SUBJECT: Food insecurity (FI) in the United States is a public health problem. FI among young children is often invisible, because although young children who
experience FI may experience negative health and developmental outcomes, their growth is often unaffected.
WHAT THIS STUDY ADDS: Providers need efficient methods for identifying young children in food-insecure households to ensure that families have access to nutrition-related services that provide healthy food and alleviate caregiver stress. We present here a brief, sensitive, specific, and valid FI screen.
abstract
OBJECTIVES:To develop a brief screen to identify families at risk for food insecurity (FI) and to evaluate the sensitivity, specificity, and con-vergent validity of the screen.
PATIENTS AND METHODS:Caregivers of children (age: birth through 3 years) from 7 urban medical centers completed the US Department of Agriculture 18-item Household Food Security Survey (HFSS), reports of child health, hospitalizations in their lifetime, and developmental risk. Chil-dren were weighed and measured. An FI screen was developed on the basis of affirmative HFSS responses among food-insecure families. Sensi-tivity and specificity were evaluated. Convergent validity (the correspon-dence between the FI screen and theoretically related variables) was as-sessed with logistic regression, adjusted for covariates including study site; the caregivers’ race/ethnicity, US-born versus immigrant status, mar-ital status, education, and employment; history of breastfeeding; child’s gender; and the child’s low birth weight status.
RESULTS:The sample included 30 098 families, 23% of which were food insecure. HFSS questions 1 and 2 were most frequently endorsed among food-insecure families (92.5% and 81.9%, respectively). An af-firmative response to either question 1 or 2 had a sensitivity of 97% and specificity of 83% and was associated with increased risk of reported poor/fair child health (adjusted odds ratio [aOR]: 1.56;P⬍.001), hos-pitalizations in their lifetime (aOR: 1.17;P⬍.001), and developmental risk (aOR: 1.60;P⬍.001).
CONCLUSIONS:A 2-item FI screen was sensitive, specific, and valid among low-income families with young children. The FI screen rapidly identifies households at risk for FI, enabling providers to target ser-vices that ameliorate the health and developmental consequences as-sociated with FI.Pediatrics2010;126:e26–e32
AUTHORS:Erin R. Hager, PhD,aAnna M. Quigg, MA,a,b Maureen M. Black, PhD,aSharon M. Coleman, MS, MPH,c Timothy Heeren, PhD,cRuth Rose-Jacobs, ScD,dJohn T. Cook, PhD,dStephanie A. Ettinger de Cuba, MPH,cPatrick H. Casey, MD,eMariana Chilton, PhD,fDiana B. Cutts, MD,g Alan F. Meyers, MD, MPH,dand Deborah A. Frank, MDd
aDepartment of Pediatrics, University of Maryland School of
Medicine, Baltimore, Maryland;bDepartment of Psychology,
University of Maryland Baltimore County, Baltimore, Maryland;
cData Coordinating Center, Boston University School of Public
Health, Boston, Massachusetts;dDepartment of Pediatrics,
Boston University School of Medicine, Boston, Massachusetts;
eDepartment of Pediatrics, University of Arkansas for Medical
Sciences, Little Rock, Arkansas;fDepartment of Health
Management and Policy, Drexel University School of Public Health, Philadelphia, Pennsylvania; andgDepartment of
Pediatrics, Hennepin County Medical Center, Minneapolis, Minnesota
KEY WORDS
food insecurity, screening tools, nutrition, child development, hunger
ABBREVIATIONS
FI—food insecurity
HFSS—Household Food Security Survey
PEDS—Parents’ Evaluations of Developmental Status aOR—adjusted odds ratio
CI— confidence interval
The authors take public responsibility for the content. All authors certify that they contributed substantially to conception and design or analysis and interpretation of the data, drafting, or revision of content and approval of the final version. www.pediatrics.org/cgi/doi/10.1542/peds.2009-3146 doi:10.1542/peds.2009-3146
Accepted for publication Apr 5, 2010
Address correspondence to Erin R. Hager, PhD, Department of Pediatrics, University of Maryland School of Medicine, 737 W Lombard St, Room 163, Baltimore, MD 21201. E-mail: ehager@peds.umaryland.edu
PEDIATRICS (ISSN Numbers: Print, 0031-4005; Online, 1098-4275). Copyright © 2010 by the American Academy of Pediatrics
The US Department of Agriculture has reported that 14.6% of US households in 2008 were food insecure, meaning that at some time during the year they were unable to obtain adequate food
because of constrained resources.1
“Adequate” refers to the quantity or quality of food for all household mem-bers to maintain an active lifestyle at all times. Among households with chil-dren, 21% were food insecure.1Black
or Hispanic households with single parents, young children, and incomes below the federal poverty line are at increased risk for food insecurity (FI).2,3
Household FI is a serious public health concern, particularly for young chil-dren. Children in food-insecure house-holds experience adverse health and development attributable to the inade-quate quality and quantity of foods and to overall family stress.4Our research
group (Children’s HealthWatch) found that children younger than 3 years who live in food-insecure households have 90% greater adjusted odds of be-ing in fair/poor health (versus good/ excellent), 31% greater adjusted odds of being hospitalized since birth,5and
76% greater adjusted odds of being at increased developmental risk com-pared with food-secure families.6
Care-givers with positive depression-screen results have 2.69 times the odds of re-porting FI compared with caregivers
with negative depression-screen
results.7
Providers need efficient methods for identifying young children in food-insecure households to ensure that families have access to nutrition-related services that provide healthy food and alleviate caregiver stress. Several questionnaires are available to identify food-insecure households. The 18-item US Household Food Secu-rity Scale (HFSS) is used by the Current Population Survey to monitor national food-security status annually.2,8,9
Al-though the HFSS is widely used, it is time-consuming to administer and has a complex scoring algorithm, which limits its use as a clinical tool. Several shortened questionnaires have been published, including the HFSS Short Form (a 6-item version with excellent sensitivity and good specificity)9,10
and a recently developed single-item screen for hunger.11Although the
hun-ger question has acceptable sensitivity and specificity for identifying families at risk for hunger (ie, the sensation caused by involuntary lack of food),11
the exclusive focus on hunger may miss food-insecure families that expe-rience stress related to uncertain ac-cess to enough food but not the physi-ologic sensation of hunger. Data from the Community Childhood Hunger Iden-tification Project12,13 and Children’s
HealthWatch5,6 suggest that negative
effects of FI (“at risk for hunger”) on child health and behavior are present before reaching the threshold for hunger.14
Data collected by Children’s Health-Watch provide a unique opportunity to develop an FI screen, to test the sensi-tivity and specificity of the screen against the HFSS, and to test the
con-vergent validity against negative
health outcomes for caregivers and children known to be associated with FI. The purpose of this study was to de-velop a brief screen to identify families at risk for FI and to examine the sensi-tivity, specificity, and convergent valid-ity of the screen in a multisite sample of low-income families with young children.
PATIENTS AND METHODS
Participants
Data were obtained from 30 098 care-givers interviewed in hospital-based settings between 1998 and 2005 as part of Children’s HealthWatch (for-merly the Children’s Sentinel Nutrition Assessment Program [C-SNAP]) in
Baltimore, Maryland; Boston, Massa-chusetts; Little Rock, Arkansas; Los An-geles, California; Minneapolis, Minne-sota; Philadelphia, Pennsylvania; and Washington, DC. Institutional review board approval was obtained from each site.
Trained interviewers surveyed care-givers who accompanied children younger than 36 months in acute/ primary care clinics and hospital emergency departments during peak patient flow times. Caregivers of criti-cally ill or injured children were not approached. Potential respondents were excluded if they did not speak En-glish, Spanish, or (in Minneapolis only) Somali, were not knowledgeable about the child’s household, lived out of state, or did not provide informed con-sent. To ensure that families had low income, analyses were limited to fam-ilies who were uninsured or receiving public insurance.
Measures
All measures are part of the Children’s HealthWatch survey instrument.
Demographics
Caregivers reported their age, race/ ethnicity, country of origin, marital and employment status, level of education, and the child’s age and gender.
Food Insecurity
The 18-item US HFSS,2,8,9which serves
as the gold standard in the assess-ment of household food security, was used in this study. According to estab-lished procedures from the US Depart-ment of Agriculture, households are classified as food insecure if they
en-dorseⱖ3 affirmative responses to 18
total questions.2,9
Child Health Outcomes
Caregivers reported their child’s birth weight, breastfeeding history, and number of lifetime hospitalizations (excluding birth). Caregivers rated the
able (excellent/good versus fair/
poor).15 Developmental risk was
measured by using the Parents’ Evalu-ations of Developmental Status (PEDS), a 10-item screen of parents’ concerns about their children’s development that meets standards set by the Amer-ican Academy of Pediatrics for devel-opmental screening.16–20
“Developmen-tal risk” was defined by using
published guidelines21as caregiver
re-port of 1 or more developmentally ap-propriate concerns. The PEDS sample was restricted to children older than 4 months, because the sensitivity and specificity of the PEDS are better for children than for infants younger than
4 months of age.22 The PEDS
instru-ment was incorporated into the Chil-dren’s HealthWatch survey instrument in 2004.
Child Anthropometric Measurements
At the time of the interview, the child’s weight and length were measured and recorded by using equipment and pro-tocols standardized across Children’s HealthWatch sites.6 Weight-for-length
and weight-for-agezscores were cal-culated by using the 2000 US Centers for Disease Control and Prevention age- and gender-specific reference val-ues.23 “At risk for underweight” was
defined as weight for age at⬍5th per-centile or weight for length at⬍10th percentile. “Overweight” was defined as weight for length atⱖ95th percen-tile for children younger than 24 months and BMI for age atⱖ85th per-centile for children 24 months of age or older.
Caregiver Health Outcomes
Caregivers rated their physical health as excellent, good, fair, or poor, which yielded a binary variable (excellent/ good versus fair/poor).15 Caregivers
completed a 3-item depression screen that has a sensitivity of 100%,
specific-screening instrument.24 Respondents
with 2 or more positive responses were coded as having a positive depression-screen result.24
FI-Screen Development
Screen development includes consid-eration of sensitivity (the screen’s abil-ity to correctly identify food-insecure households), specificity (the screen’s ability to correctly identify food-secure households), and convergent validity (correspondence between the screen and theoretically related variables).25–27
We sought to develop an FI screen from the HFSS with 5 specific characteris-tics: (1) applicable to families with young children; (2) brief; (3) highly sensitive (⬎90%); (4) specific (⬎80%); and (5) valid (convergent validity). The prevalence of affirmative responses for each item on the HFSS was calcu-lated for the total sample and for food-insecure families. Prevalence data were used to generate sensitivity and specificity tables for combinations of 1 or 2 questions with the highest preva-lence of affirmative responses among food-insecure families. Convergent va-lidity was examined by using demo-graphic and health information on a sample of low-income families across 7 diverse US cities.
Statistical Analyses
Analyses were conducted by using SAS 9.1 (SAS Institute Inc, Cary, NC).
Demographics and Health Outcomes
Data were examined by using frequen-cies of demographic and health-related variables for children and caregivers according to FI status based on the 18-item HFSS.2analyses
were conducted to determine differ-ences in demographics and health out-comes according to FI status.
criteria and the FI screen was gener-ated. Sensitivity was calculated as the number of food-insecure families cor-rectly identified by the FI screen di-vided by the number of food-insecure families identified with HFSS criteria. Specificity was calculated as the num-ber of families correctly identified by the FI screen as food secure divided by the number of food-secure families identified with HFSS criteria.
Convergent Validity
Convergent validity was tested by us-ing 2 sets of logistic regressions to ex-amine patterns of negative health out-comes by comparing the FI screen with the HFSS. The independent variable in each set of models was FI status (mea-sured by the FI screen or the HFSS). The dependent variables were child’s health, number of hospitalizations in the child’s life, child being at risk for
underweight or overweight, child
being at developmental risk, caregiv-er’s health, and caregivcaregiv-er’s positive depression-screen result. All models were adjusted for Children’s Health-Watch site, caregivers’ race/ethnicity, US-born versus immigrant status, marital status, education, employ-ment, history of breastfeeding, child’s gender, and low birth weight. Covari-ates were chosen on the basis of theo-retical and bivariate associations with both FI and the outcomes.
RESULTS
Sample
and December 2008 were included in the final analyses (n⫽30 098).
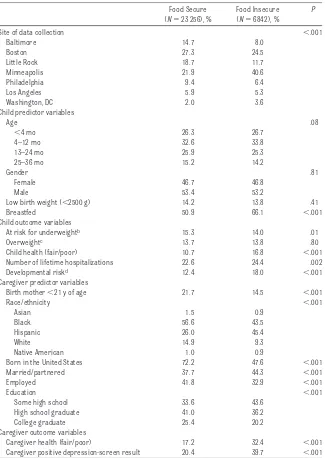
Table 1 lists the sample according to FI status based on the HFSS; 23% were food insecure. Of the 7 Children’s HealthWatch sites, Minneapolis had the highest overall prevalence of FI, fol-lowed by the Boston site. Nearly 60% of the data were collected from caregiv-ers of a child younger than 12 months, and there was no difference in preva-lence of FI status according to child’s age or gender. Compared with food-secure households, a higher propor-tion of children in food-insecure households were breastfed. A lower proportion of caregivers in food-insecure households were younger than 21 years, born in the United States, employed, and had a high school diploma or college degree com-pared with caregivers in food-secure households. The majority of caregivers interviewed were black or Hispanic. A higher proportion of Hispanic
caregiv-ers compared with other ethnic
groups were food insecure.
Compared with caregivers in secure households, caregivers in food-insecure households were more likely to report their own health as fair or poor, to have a positive depression-screen result, and to rate their child’s health as fair or poor (see Table 1). In addition, children in food-insecure households were more likely to be at developmental risk and to have been hospitalized at least once since birth. Compared with children in food-secure households, fewer children in food-insecure households were at risk for underweight. No differences were found with respect to child overweight or low birth weight according to FI status.
FI Screen
Most respondents who lived in food-insecure households answered affir-matively (often true or sometimes true
versus never true) to questions 1 and 2 of the HFSS: 92.5% and 81.9%, respec-tively. These questions asked (1) “Within the past 12 months we worried whether our food would run out before we got money to buy more” and (2) “Within the past 12 months the food we
bought just didn’t last and we didn’t have money to get more.”
Sensitivity and Specificity
Cross-tabulation tables were gener-ated for combinations of the first 2 questions of the HFSS to examine
sen-TABLE 1 Sample Description According to FI Status (Determined by the 18-Item HFSS) (N⫽30 098a)
Food Secure (N⫽23 256), %
Food Insecure (N⫽6842), %
P
Site of data collection ⬍.001
Baltimore 14.7 8.0
Boston 27.3 24.5
Little Rock 18.7 11.7
Minneapolis 21.9 40.6
Philadelphia 9.4 6.4
Los Angeles 5.9 5.3
Washington, DC 2.0 3.6
Child predictor variables
Age .08
⬍4 mo 26.3 26.7
4–12 mo 32.6 33.8
13–24 mo 25.9 25.3
25–36 mo 15.2 14.2
Gender .81
Female 46.7 46.8
Male 53.4 53.2
Low birth weight (⬍2500 g) 14.2 13.8 .41
Breastfed 50.9 66.1 ⬍.001
Child outcome variables
At risk for underweightb 15.3 14.0 .01
Overweightc 13.7 13.8 .80
Child health (fair/poor) 10.7 16.8 ⬍.001 Number of lifetime hospitalizations 22.6 24.4 .002
Developmental riskd 12.4 18.0 ⬍.001
Caregiver predictor variables
Birth mother⬍21 y of age 21.7 14.5 ⬍.001
Race/ethnicity ⬍.001
Asian 1.5 0.9
Black 56.6 43.5
Hispanic 26.0 45.4
White 14.9 9.3
Native American 1.0 0.9
Born in the United States 72.2 47.6 ⬍.001
Married/partnered 37.7 44.3 ⬍.001
Employed 41.8 32.9 ⬍.001
Education ⬍.001
Some high school 33.6 43.6
High school graduate 41.0 36.2
College graduate 25.4 20.2
Caregiver outcome variables
Caregiver health (fair/poor) 17.2 32.4 ⬍.001 Caregiver positive depression-screen result 20.4 39.7 ⬍.001
aLimited to families who were uninsured or receiving public insurance.
bAt risk for underweight was defined as weight for age at⬍5th percentile or weight for height at⬍10th percentile. cOverweight was defined as weight-for-length atⱖ95th percentile for children younger than 24 months and BMI for age at ⱖ85th percentile for children aged 24 months or older. If length data were not available, weight for age atⱖ95th percentile was used as a proxy.
dDevelopmental risk was determined by the PEDS (ⱖ1 concern) only for children older than 4 months, and data collection
began in 2004 (n⫽10 874).
sponse to question 1 only or question 2 only of the HFSS provided a sensitivity of 93% or 82% and a specificity of 85% or 95%, respectively. An affirmative re-sponse to both questions 1 and 2 pro-vided a sensitivity of 78% and specific-ity of 96%. An affirmative response to question 1 and/or question 2 of the HFSS provided a sensitivity of 97% and specificity of 83% (Table 2); therefore, these are the criteria that comprise the FI screen.
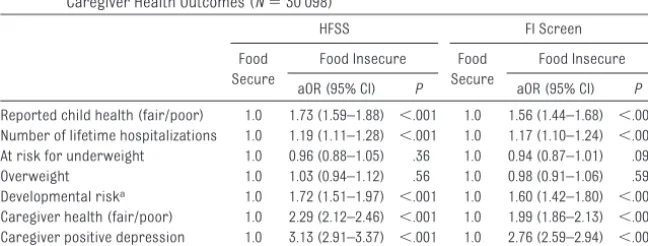
Risk for Negative Health Outcomes Adjusted logistic regression models were conducted by using both the HFSS and the FI screen (separately) to examine how FI status is related to child and caregiver health outcomes while controlling for covariates (Table 3). Compared with caregivers in secure households, those in food-insecure households (as measured by the FI screen) were 1.56 times more likely to report their child’s health as
1.44 –1.68];P⬍.001), 1.99 times more likely to report their own health as fair or poor (aOR: 1.99 [95% CI: 1.86 –2.13];
P⬍.001), and 2.76 times more likely to have a positive depression-screen re-sult (aOR: 2.76 [95% CI: 2.59 –2.94];P⬍
.001). Compared with those in food-secure households, children from food-insecure households (as mea-sured by the FI screen) were 1.17 times more likely to have had hospitaliza-tions in their lifetime (aOR: 1.17 [95% CI: 1.10 –1.24];P⬍.001) and 1.6 times more likely to be at developmental risk
(aOR: 1.60 [95% CI: 1.42–1.80]; P ⬍
.001) (see Table 3). These associations
are similar to, although slightly
weaker than, the corresponding
asso-ciations with the 18-item HFSS,5–7
which demonstrates convergent valid-ity of the FI screen as a measure of FI. Differences in child anthropometric in-dices (at risk for underweight or over-weight) as detected by the 18-item
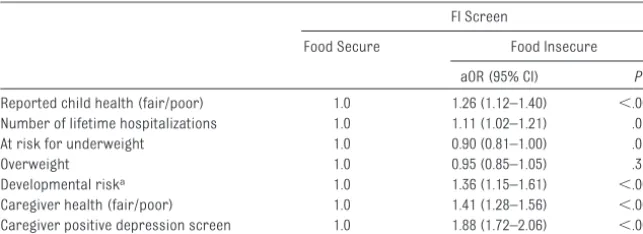
To assess whether the households identified as food insecure by the FI screen experienced risk despite clas-sification as food secure by the 18-item HFSS, analyses were repeated among those who were classified as food se-cure on the basis of the 18-item HFSS
(N ⫽ 23 256). The FI-screen results
show attenuated, but statistically sig-nificant, associations with poor child and caregiver health outcomes. Care-givers classified as food insecure by the FI screen but not the 18-item HFSS were 1.26 times more likely to report their child’s health as fair or poor
(aOR: 1.26 [95% CI: 1.12–1.40]; P ⬍
.001), 1.41 times more likely to report their own health as fair or poor (aOR: 1.41 [95% CI: 1.28 –1.56];P⬍.001), and 1.88 times more likely to have a posi-tive depression-screen result (aOR: 1.88 [95% CI: 1.72–2.06];P⬍.001) com-pared with caregivers classified as food secure by the FI screen. Children in these households were 1.11 times more likely to have had hospitalizations in their life-time (aOR: 1.11 [95% CI: 1.02–1.21];P⬍
.001) and 1.36 times more likely to be at developmental risk (aOR: 1.36 [95% CI: 1.15–1.61];P⬍.001) than children iden-tified as food secure by the FI screen in this subsample of food-secure house-holds (see Table 4).
DISCUSSION
We used a 2-item screen to identify families of young children at risk for FI. The FI screen is brief, with high sensi-tivity, good specificity, and convergent validity. A sensitivity of 97% indicates that only 3% of families who experi-enced FI were likely to be misclassi-fied. With this highly sensitive screen, providers can identify nearly all chil-dren who lived in food-insecure fami-lies. A specificity of 83% indicates that 17% of families who were food secure according to the HFSS were classified
TABLE 2 Cross-tabulation of Overlap Between the 18-Item HFSS and the FI Screen in Identifying Food-Insecure Households
Identified by the HFSS,n(%)
Not Identified by the HFSS,n(%)
Total,n(%)
Identified by the FI screen 6614 (97) 3977 (17) 10 591 (35) Not identified by the FI screen 228 (3) 19 279 (83) 19 507 (65)
Total 6842 (23) 23 256 (77) 30 098 (100)
TABLE 3 Relation Between FI Status on the HFSS and on the 2-Item FI Screen With Child and Caregiver Health Outcomes (N⫽30 098)
HFSS FI Screen
Food Secure
Food Insecure Food Secure
Food Insecure
aOR (95% CI) P aOR (95% CI) P
Reported child health (fair/poor) 1.0 1.73 (1.59–1.88) ⬍.001 1.0 1.56 (1.44–1.68) ⬍.001 Number of lifetime hospitalizations 1.0 1.19 (1.11–1.28) ⬍.001 1.0 1.17 (1.10–1.24) ⬍.001 At risk for underweight 1.0 0.96 (0.88–1.05) .36 1.0 0.94 (0.87–1.01) .09 Overweight 1.0 1.03 (0.94–1.12) .56 1.0 0.98 (0.91–1.06) .59 Developmental riska 1.0 1.72 (1.51–1.97) ⬍.001 1.0 1.60 (1.42–1.80) ⬍.001 Caregiver health (fair/poor) 1.0 2.29 (2.12–2.46) ⬍.001 1.0 1.99 (1.86–2.13) ⬍.001 Caregiver positive depression
screen
1.0 3.13 (2.91–3.37) ⬍.001 1.0 2.76 (2.59–2.94) ⬍.001
Data were adjusted for site, race/ethnicity, US-born mother versus immigrant, marital status, education, child gender, caregiver employment, breastfeeding, low birth weight, and maternal age. The sample was limited to families that were uninsured or receiving public insurance.
aDevelopmental risk was determined by the PEDS (ⱖ1 concern) only for children older than 4 months, and data collection
as being at risk for FI by the screener. Results of 2 analyses demonstrate that households identified as at risk for FI were at increased risk for adverse child and caregiver health outcomes compared with households identified as food secure by the FI screen. Re-gardless of whether analyses were conducted across the entire sample or restricted to food-secure households based on the HFSS, households identi-fied as at risk for FI by the FI screen were at increased risk for negative child and caregiver health outcomes, which suggests that intervention, such as referral to services, is warranted.
In this sample, FI was not associated with children’s anthropometry, which suggests that FI is often invisible among young children because they may not appear undernourished (or overweight) yet still experience nega-tive health and developmental out-comes. The FI screen can be easily ad-ministered in pediatric offices, by clinicians or practitioners working with young families (ie, Department of Social Services, school systems,
Sup-plemental Nutrition Program for
Women, Infants, and Children [WIC], child care programs, etc), or by com-munity groups to assess individual and community needs. The FI screen has important clinical implications for all practitioners who work with very
young children and families. By identi-fying interventions designed for fami-lies identified as at risk for FI, practi-tioners can help families identify resources. For example, in Baltimore, the City Health Commissioner advo-cated for widespread use of the FI screen and developed a Web site
(www.hungryinbaltimore.org) that
identifies resources including food banks, food pantries, social services, and federally funded nutrition pro-grams such as the Special Nutrition Assessment Program (SNAP), formerly the Food Stamp Program, and WIC. In addition, the Minnesota Department of Health Family Home Visiting Program has incorporated the FI screen into their protocol along with referrals to financial and food resources.
The FI screen is an efficient and valid way to identify families at risk for FI. For a more comprehensive assess-ment of FI, the 18-item HFSS should be administered.
There were limitations to this study. First, although the method used for identifying items to be included in the FI screen was systematic and met the set criteria of this study, it was not as precise as methods used in traditional item-response theory, a scientific ap-proach often used to create shortened versions of large questionnaires.
Sec-ond, the data used in these analyses included a large, multisite, clinical sample of exclusively urban, low-income families of very young children. Although there is a strong link be-tween poverty and FI, the validity of the FI screen has not been tested in a pop-ulation of varying socioeconomic sta-tus, in rural populations, or in families without young children. Further inves-tigations of the FI screen should be conducted in these populations. Third, participants responded to these ques-tions as part of a larger questionnaire delivered by an interviewer with the assurance that their responses would be confidential and not influence their medical care. It is not known to what extent responses might have differed if the questions were administered in the context of a clinical interview by a health care practitioner. Additional testing of the screen in clinical set-tings is warranted. Finally, as with any self-report measure, families could
have intentionally misrepresented
themselves and incorrectly reported FI. However, the sensitivity, specificity, and convergent validity demonstrat-ed suggest increasdemonstrat-ed vulnerability among children at risk for FI. To guard against misrepresentation, providers should incorporate the FI screen into other clinical assessments.
CONCLUSIONS
A 2-item FI screen for identifying fami-lies at risk for FI was developed and demonstrated sensitivity, specificity, and convergent validity. The FI screen quickly identifies households with young children at risk for FI, which enables providers to target services to ameliorate the health and developmen-tal consequences associated with FI.
ACKNOWLEDGMENT
This research was supported by unre-stricted funding from the following
sources: W.K. Kellogg Foundation;
MAZON: A Jewish Response to Hunger;
TABLE 4 Relation Between FI Status on the 2-Item FI Screen and Child and Caregiver Health Outcomes Among the Subset of Food-Secure Households on the HFSS (N⫽23 256)
FI Screen
Food Secure Food Insecure
aOR (95% CI) P
Reported child health (fair/poor) 1.0 1.26 (1.12–1.40) ⬍.001 Number of lifetime hospitalizations 1.0 1.11 (1.02–1.21) .01 At risk for underweight 1.0 0.90 (0.81–1.00) .05
Overweight 1.0 0.95 (0.85–1.05) .31
Developmental riska 1.0 1.36 (1.15–1.61) ⬍.001 Caregiver health (fair/poor) 1.0 1.41 (1.28–1.56) ⬍.001 Caregiver positive depression screen 1.0 1.88 (1.72–2.06) ⬍.001
Data were adjusted for site, race/ethnicity, US-born mother versus immigrant, marital status, education, child gender, caregiver employment, breastfeeding, low birth weight, and maternal age. The sample was limited to families that were uninsured or receiving public insurance.
aDevelopmental risk was determined by the PEDS (ⱖ1 concern) only for children older than 4 months, and data collection
began in 2004 (n⫽8497).
ger; Sandpiper Foundation; Anthony Spinazzola Foundation; Daniel Pitino Foundation; Candle Foundation; Wilson Foundation; Abell Foundation; Claneil
Foundation; Beatrix Fox Auerbach
donor-advised fund of the Hartford Foundation (on the advice of Jean Schiro Zavela and Vance Zavela);
phon Fund; Shoffer Foundation; An-nie E. Casey Foundation; and anony-mous donors.
We would like to thank Dr Joshua Sharfstein for his collaboration and contribution to this project as Health Commissioner for the City of Balti-more. We also acknowledge Zhaoyan
programming; and Kathleen Barrett, MSE, Jennifer Breaux, MPH, Joni Gep-pert, MPH, Katherine Joyce, MPH, and Tu Quan, MPH for excellent training, scheduling, and supervising of inter-view staff members and for diligence in coding, cleaning, and preparing questionnaires for data entry.
REFERENCES
1. Nord M, Andrews M, Carlson S. Household food security in the United States, 2008. A v a i l a b l e a t : w w w . e r s . u s d a . g o v / Publications/ERR83. Accessed May 10, 2010 2. Nord M, Andrews M, Carlson S. Household food security in the United States, 2007. A v a i l a b l e a t : w w w . e r s . u s d a . g o v / Publications/ERR66. Accessed May 10, 2010 3. Alaimo K, Olson CM, Frongillo EA Jr, Briefel RR. Food insufficiency, family income, and health in US preschool and school-aged children.Am J Public Health.2001;91(5): 781–786
4. Cook JT, Frank DA. Food security, poverty, and human development in the United States.Ann N Y Acad Sci. 2008;1136:193–209 5. Cook JT, Frank DA, Berkowitz C, et al. Food insecurity is associated with adverse health outcomes among human infants and toddlers.J Nutr.2004;134(6):1432–1438 6. Rose-Jacobs R, Black MM, Casey PH, et al.
Household food insecurity: associations with at-risk infant and toddler develop-ment.Pediatrics.2008;121(1):65–72 7. Casey P, Goolsby S, Berkowitz C, et al;
Chil-dren’s Sentinel Nutritional Assessment Pro-gram Study Group. Maternal depression, changing public assistance, food security, and child health status.Pediatrics.2004; 113(2):298 –304
8. Nord M, Hopwood H. Recent advances pro-vide improved tools for measuring chil-dren’s food security.J Nutr.2007;137(3): 533–536
9. Bickel G, Nord M, Price C, Hamilton W, Cook J. Guide to Measuring Household Food Security: Revised 2000. Alexandria, VA: US Department of Agriculture, Food and Nutri-t i o n S e r v i c e ; 2 0 0 0 . A v a i l a b l e a Nutri-t :
www.fns.usda.gov/fsec/files/fsguide.pdf. Accessed May 4, 2010
10. Blumberg SJ, Bialostosky K, Hamilton WL, Briefel RR. The effectiveness of a short form of the Household Food Security Scale.Am J Public Health.1999;89(8):1231–1234 11. Kleinman RE, Murphy JM, Wieneke KM,
Des-mond MS, Schiff A, Gapinski JA. Use of a single-question screening tool to detect hunger in families attending a neighbor-hood health center.Ambul Pediatr.2007; 7(4):278 –284
12. Murphy JM, Wehler CA, Pagano ME, Little M, Kleinman RE, Jellinek MS. Relationship be-tween hunger and psychosocial functioning in low-income American children. J Am Acad Child Adolesc Psychiatry.1998;37(2): 163–170
13. Weinreb L, Wehler C, Perloff J, et al. Hunger: its impact on children’s health and mental health.Pediatrics.2002;110(4). Available at: www.pediatrics.org/cgi/content/full/110/ 4/e41
14. Kleinman RE, Murphy JM, Little M, et al. Hun-ger in children in the United States: poten-tial behavioral and emotional correlates.
Pediatrics. 1998;101(1). Available at: www.pediatrics.org/cgi/content/full/101/ 1/e3
15. US Department of Health and Human Ser-vices.National Health and Nutrition Exami-nation Survey III Data Collection Forms. Hyattsville, MD: US Department of Health and Human Services; 1991
16. Glascoe FP. Evidence-based approach to de-velopmental and behavioural surveillance using parents’ concerns.Child Care Health Dev.2000;26(2):137–149
17. Glascoe FP, Oberklaid F, Dworkin PH, Trimm F. Brief approaches to educating patients and
parents in primary care.Pediatrics.1998; 101(6). Available at: www.pediatrics. org/cgi/content/full/101/6/e10
18. Halfon N, Regalado M, Sareen H, et al. As-sessing development in the pediatric office.
Pediatrics.2004;113(6 suppl):1926 –1933 19. Developmental surveillance and screening
of infants and young children.Pediatrics.
2001;108(1):192–196
20. Glascoe FP. Early detection of developmen-tal and behavioral problems.Pediatr Rev.
2000;21(8):272–279; quiz 280
21. Voigt RG, Johnson SK, Mellon MW, et al. Re-lationship between parenting stress and concerns identified by developmental screening and their effects on parental medical care-seeking behavior.Clin Pediatr (Phila).2009;48(4):362–368
22. Glascoe FP.Collaborating With Parents: Us-ing Parents’ Evaluation of Developmental Status to Detect and Address Developmen-tal and Behavioral Problems. Nashville, TN: Ellsworth & Vandemeer Press, Ltd; 1998 23. Kuczmarski RJ, Ogden CL, Grummer-Strawn
LM, et al. CDC growth charts: United States.
Adv Data.2000;(314):1–27
24. Kemper KJ, Babonis TR. Screening for ma-ternal depression in pediatric clinics.Am J Dis Child.1992;146(7):876 – 878
25. Gordis L.Epidemiology. 2nd ed. Philadel-phia, PA: W.B. Saunders; 2000
26. Rosnow RL, Rosenthal R.Beginning Behav-ioral Research: A Conceptual Primer. 3rd ed. Upper Saddle River, NJ: Prentice Hall, Inc; 1999
DOI: 10.1542/peds.2009-3146
2010;126;e26
Pediatrics
Casey, Mariana Chilton, Diana B. Cutts, Alan F. Meyers and Deborah A. Frank
Heeren, Ruth Rose-Jacobs, John T. Cook, Stephanie A. Ettinger de Cuba, Patrick H.
Erin R. Hager, Anna M. Quigg, Maureen M. Black, Sharon M. Coleman, Timothy
Food Insecurity
Development and Validity of a 2-Item Screen to Identify Families at Risk for
Services
Updated Information &
http://pediatrics.aappublications.org/content/126/1/e26
including high resolution figures, can be found at:
References
http://pediatrics.aappublications.org/content/126/1/e26#BIBL
This article cites 15 articles, 6 of which you can access for free at:
Subspecialty Collections
http://www.aappublications.org/cgi/collection/nutrition_sub
Nutrition
following collection(s):
This article, along with others on similar topics, appears in the
Permissions & Licensing
http://www.aappublications.org/site/misc/Permissions.xhtml
in its entirety can be found online at:
Information about reproducing this article in parts (figures, tables) or
Reprints
http://www.aappublications.org/site/misc/reprints.xhtml
DOI: 10.1542/peds.2009-3146
2010;126;e26
Pediatrics
Casey, Mariana Chilton, Diana B. Cutts, Alan F. Meyers and Deborah A. Frank
Heeren, Ruth Rose-Jacobs, John T. Cook, Stephanie A. Ettinger de Cuba, Patrick H.
Erin R. Hager, Anna M. Quigg, Maureen M. Black, Sharon M. Coleman, Timothy
http://pediatrics.aappublications.org/content/126/1/e26
located on the World Wide Web at:
The online version of this article, along with updated information and services, is
by the American Academy of Pediatrics. All rights reserved. Print ISSN: 1073-0397.