Epidemiology of SIDS and Explained Sudden Infant Deaths
Charlotte E. A. Leach, BSc*; Peter S. Blair, BSc, MSc, PhD*;
Peter J. Fleming, MB, ChB, PhD, FRCP, FRCPCH*; Iain J Smith, MB, ChB, MPH, MRCP‡; Martin Ward Platt, MB, ChB, MD, FRCP§; Peter J. Berry, BA, MB, BCH, FRCP, FRCPath*;
Jean Golding, MA, PhD, DSc, FRCPCH*; and the CESDI SUDI Research Group
ABSTRACT. Objectives. To establish whether epide-miologic characteristics for sudden infant death syn-drome (SIDS) have changed since the decrease in death rate after the “Back to Sleep” campaign in 1991, and to compare these characteristics with sudden and unex-pected deaths in infancy (SUDI) from explained causes.
Design. Three-year, population-based, case-control study. Parental interviews were conducted soon after the death and for 4 controls matched for age and date of interview. All sudden unexpected deaths were included in the study and the cause of death was established by a multidisciplinary panel of the relevant health care pro-fessionals taking into account past medical and social history of the mother and infant, the circumstances of death, and a full pediatric postmortem examination. Con-tributory factors and the final classification of death were made using the Avon clinicopathologic system.
Setting. Five regions in England, with a total popula-tion of>17 million people, took part in the study. The number of live births within these regions during the particular time each region was involved in the study was 473 000.
Study Participants. Three hundred twenty-five SIDS infants (91.3% of those available), 72 explained SUDI infants (86.7% of those available), and 1588 matched con-trol infants (100% of total for cases included).
Results. Many of the epidemiologic features that characterize SIDS infants and families have remained the same, despite the recent decrease in SIDS incidence in the United Kingdom. These include the same charac-teristic age distribution, few deaths in the first few weeks of life or after 6 months, with a peak between 4 and 16 weeks, a higher incidence in males, lower birth weight, shorter gestation, and more neonatal problems at deliv-ery. As in previous studies there was a strong correlation with young maternal age and higher parity and the risk increased for infants of single mothers and for multiple births. A small but significant proportion of index moth-ers had also experienced a previous stillbirth or infant death. The majority of the SIDS deaths (83%) occurred during the night sleep and there was no particular day of the week on which a significantly higher proportion of deaths occurred. Major epidemiologic features to change since the decrease in SIDS rate include a reduction in the
previous high winter peaks of death and a shift of SIDS families to the more deprived social grouping. Just more than one quarter of the SIDS deaths (27%) occurred in the 3 winter months (December through February) in the 3 years of this study. In half of the SIDS families (49%), the lone parent or both parents were unemployed compared with less than a fifth of control families (18%). This difference was not explained by an excess of single moth-ers in the index group. Many of the significant factors relating to the SIDS infants and families that distinguish them from the normal population did not distinguish between SIDS and explained SUDI. In the univariate analysis many of the epidemiologic characteristics sig-nificant among the SIDS group were also identified and in the same direction among the infants dying as SUDI attributable to known causes. The explained deaths were similarly characterized by the same infant, maternal, and social factors, 48% of these families received no waged income. Using logistic regression to make a direct com-parison between the two index groups there were only three significant differences between the two groups of deaths: 1) a different age distribution, the age distribu-tion of the explained deaths peaked in the first 2 months and was more uniform thereafter; 2) more congenital anomalies were noted at birth (odds ratio [OR] 53.14; 95% confidence intervals [CI]: 1.52– 6.51) among the ex-plained deaths (20%) compared with the SIDS (8%), which was not surprising given that 10% of these deaths were explained by congenital anomalies; and 3) a higher incidence of maternal smoking during pregnancy among the SIDS mothers, the proportion of smokers within the explained SUDI group was much higher (49%) than the controls (27%), but among SIDS mothers the proportion of smokers was higher still (66%) and this difference was significant (66% vs 49%; OR5 2.03; 95% CI: 1.16 –3.54). The largest subgroup of explained SUDI deaths were those attributable to infection (46%). There was a winter peak of deaths from infection, the highest number occur-ring in December (21%) but this was not significant. A multivariate model of these deaths showed parental unemployment to be the most significant factor (OR5 27.74; 95% CI: 3.19 –241.34). Short gestational age (OR 5 11.67; 95% CI: 1.84 –74.14), neonatal problems (OR514.27; 95% CI: 1.89 –107.81), and higher prevalence of males (OR5 9.26; 95% CI: 1.63–52.52) were also sig-nificant. Half of the deaths from infection occurred in crowded households (>1 adult or child per room exclud-ing hallways, toilets, bathrooms, and kitchens if not used as a dining room) which was also a significant factor (OR510.37; 95% CI: 1.08 –99.59).
Conclusions. The study identifies changes in the ep-idemiologic characteristics of SIDS that have followed the “Back to Sleep” campaign, and confirms that many underlying factors are similar between infants who die as SIDS and those dying suddenly of explained causes.
From the *FSID Unit, Department of Child Health, Royal Hospital for Children, St Michael’s Hill, Bristol, United Kingdom; the ‡Nuffield Institute for Health, Leeds, United Kingdom; and the §Newcastle Neonatal Service, Royal Victoria Infirmary, Newcastle upon Tyne, United Kingdom. Received for publication Dec 7 1998; accepted Apr 27, 1999.
Address correspondence to Professor Peter Fleming, FSID Unit, Depart-ment of Child Health, Royal Hospital for Children, St Michael’s Hill, Bristol BS2 8BJ, United Kingdom. E-mail: peter.fleming@bris.ac.uk
Many studies investigating SIDS have reported numer-ous epidemiologic characteristics and risk factors strongly associated with SIDS when compared with live control infants. It has been generally assumed that these factors are specific to SIDS to the extent that the syn-drome has been described as an “epidemiologic entity.” Many of the factors associated with SIDS that were sig-nificantly different from the control population were not significantly different when compared with the ex-plained deaths. This suggests that SUDI share some of the same underlying factors irrespective of the clinical or pathologic findings, and challenges a rigid concept of SIDS as an epidemiologic entity. The particular finding that the incidence of maternal smoking during preg-nancy, although high among mothers of explained SUDI infants, was significantly higher among SIDS mothers, lends weight to the mounting evidence that the associa-tion between smoking and SIDS may be part of a causal mechanism. Pediatrics 1999;104(4). URL: http://www. pediatrics.org/cgi/content/full/104/4/e43;SIDS, SUDI, epi-demiology, smoking, social deprivation.
ABBREVIATIONS. SIDS, sudden infant death syndrome; SUDI, sudden unexpected deaths in infancy; OR, odds ratio; CI, 95% confidence interval.
E
ach year between 1993 and 1996,.500 infants between 1 week and 1 year old died suddenly and unexpectedly in England and Wales.1Themajority of these deaths were attributed to sudden infant death syndrome (SIDS) whereas a fifth were because of other causes, including death as a result of a previously unrecognized infection or congenital anomaly, accidental death, and nonaccidental injury.2
The epidemiology of infant deaths classified as SIDS has been extensively reported.2– 4Their
charac-teristics are well established from previous studies before the “Back to Sleep” campaign conducted in 1991. Known factors have included a higher inci-dence in boys, infants of low birth weight or short gestational age, a peak in the winter months, and a characteristic age distribution. Few infants die of SIDS in the first few weeks of life, deaths peak be-tween 2 and 5 months, after which a steady decline is observed. There has been a strong association with young maternal age and higher parity, with an in-creased risk for the infants of single mothers and for multiple births. Deaths have occurred across all so-cial strata, but a significant proportion have been among socially deprived families. However, much less is known about the epidemiology of sudden unexpected deaths in infancy (SUDI) for which a sufficient explanation was forthcoming.
The marked reduction in incidence of SIDS since the “Back to Sleep” campaign in 1991 has led to an apparent increase in the proportion of explained sud-den infant deaths.2Results published from the first 2
years of this study have concentrated on deaths at-tributable to SIDS with reference in particular to the infants’ sleeping environment5and the effect of
cig-arette smoking.6We now report the results of a study
of all explained SUDI from 1 week to 1 year of age in a 3-year period that started 1 year after the “Back to Sleep” campaign. This is the first large study to be
conducted after the dramatic decrease in the SIDS rate in England, and one of the first to include all sudden unexpected deaths. The aim is to establish whether any of the previously described epidemio-logic features characteristic of SIDS infants and fam-ilies have changed since this campaign, and to com-pare these characteristics with those who died suddenly and unexpectedly, but for whose deaths a full explanation was forthcoming (explained SUDI).
METHODS
The study was conducted in five former National Health Service regions of England as part of the National Confidential Enquiry into Stillbirths and Deaths in Infancy, funded by the Department of Health. Health regions were chosen rather than other geographical boundaries because of the availability of na-tional statistics for births and deaths broken down specifically within these areas. A detailed case-control study and confidential inquiry of all sudden unexpected postperinatal deaths was con-ducted during a 3-year period from 1993 to 1996. The study aimed to include all sudden unexpected deaths of infants aged 7 to 364 days in two National Health Service regions in the United King-dom (South-West, Yorkshire) from February 1993, and a third region (Trent) from September 1993. For a third year (April 1995– March 1996) Northern and Wessex regions were also included. The population for all five regions was 17.7 million and the number of live births within these regions during the particular time each region was involved in the study was 473 000. Infants were ascertained through a communication network of profes-sionals and lay organizations who reported all sudden unexpected deaths within 24 hours. Data were collected on a standard ques-tionnaire by research interviewers, consistency of approach being maintained by regular training meetings. The interviewers visited each bereaved family twice. On the first occasion, usually within 5 days of the death and after obtaining informed consent, they took a standardized semistructured history, including a narrative account of events leading up to and surrounding the infant’s final sleep or death. On the second visit, a few days later and usually within 2 weeks of the death, they completed the full questionnaire. Details of the methodology have been previously reported.5,6
The questionnaire2,5 included a total of .600 fields, including
demographic and social data; the medical history of the infant and other family members; use of cigarettes, alcohol, and drugs; the precise sleeping arrangements for the infant; full details of the events preceding and the circumstances surrounding the death. Information was collected with regard to both the family’s usual practices by day and by night, the last 24 hours of the infant’s life, and to the period when the infant died.
For those deaths for which, within the first few days after the death, harm by a parent or caregiver was suspected as the cause of death by the police or health care professionals, no interview was conducted with the parents. Where such suspicions were raised at a later stage, after the interview had been conducted, the data collected were included in the study, but no further information was collected from such parents. For all cases, including those for which parental consent to interview was refused, and those for which nonaccidental injury was suspected, information was col-lected from public records (birth and death certificates, court records). Because of the wide range of causes of infant deaths in this study some questionnaire items were not always relevant (eg, questions about the sleeping arrangements for the last sleep were not applicable for infants who died in road traffic accidents). The exclusion of inappropriate items was left to the discretion of the research interviewer.
health visitor did not have 4 suitable infants on her own list she drew from the list of her nearest colleague. The interviewer visited each control family within a week of the death to collect the same data as for the index case. A period of sleep (the reference sleep) was identified in the control infant’s life in the 24 hours before the interview corresponding to the time of day during which the index infant had died, particular importance being given to the index parents’ view of whether it had been a night or a daytime sleep. Data were collected for this period equivalent to those collected for the index infant. Because the controls were taken from the caseload listing of the index health visitor, control infants were partially matched by locality. Using the index health visitor had both the advantage of immediate access to control families and increased compliance especially among those families more socially deprived but the possible disadvantage of partial match-ing by socioeconomic status. Before undertakmatch-ing the analysis a comparison of maternal occupation was therefore conducted us-ing the control mothers in the study with 1991 Great Britain census data from the South-West health region of 70 000 mothers with at least one dependent child,1 year old. Any discrepancies would be taken into account in both the analyses and interpretation of results.
Classification of the Cause of Death
All sudden unexpected deaths of infants were initially re-viewed at a local multidisciplinary case discussion meeting, which involved all relevant health care professionals, and was chaired by a pediatrician or pediatric pathologist, 2 to 4 months after the death. At this meeting the cause of death was classified, and future care of the parents and surviving siblings planned. The results of this discussion, together with all available records, postmortem report, and the research questionnaire, were carefully anonymised and then reviewed by a multidisciplinary regional confidential inquiry committee, which included a family doctor, a pediatric pathologist, a health visitor, a pediatrician, an obstetrician or a midwife, and a specialist in public health medicine. Care was taken to ensure that no member of this committee had knowledge or involvement with the cases being discussed. All deaths were classified by such a committee, using the Avon clinicopathologic system2,7to identify the cause of death and potentially significant
contributory factors, as described below.
For each of the major areas of available information (clinical history, psychosocial factors, gross pathology, histopathology, biochemistry, microbiology, virology, radiology), any findings were classified into one of three broad categories: I) no significant findings, II) findings that may have contributed to ill-health and possibly to death, and III) findings that provided a full explana-tion of the death.
An overall classification of the death was then defined by the highest category obtained in any of the areas of assessment (eg, if gross pathology and histopathology showed evidence of adrenal hemorrhage, and microbiology showed a growth of meningococ-cus from blood cultures, the death would be classified as III: meningococcal septicemia).
Deaths that were unexpected by history and for which no sufficient cause was found (categories I and II) were attributed to
SIDS. Deaths in group III were sudden and unexpected but fully explained (explained SUDI).
Statistical Methodology
Odds ratios (OR), 95% confidence intervals (CI), andPvalues were calculated taking into account the matching using the statis-tical package SAS.8The same package was used to conduct
con-ditional logistic regression for the multivariate analysis to com-pare each index group with matched controls. Models were constructed using the stepwise method for selection of variables,9
each nonsignificant variable was added to the final model to produce the appropriate relative statistic. A direct comparison of factors between SIDS infants and explained SUDI infants was made using logistic regression. Because the age distribution of the two groups was different, age was used as a mandatory covariate in each model. Nonparametric distributions were described using medians and interquartile ranges. The Kolmogorov-Smirnov one-sample test was used as a test of goodness-of-fit when the indi-vidual categories being tested were small.10
RESULTS Ascertainment
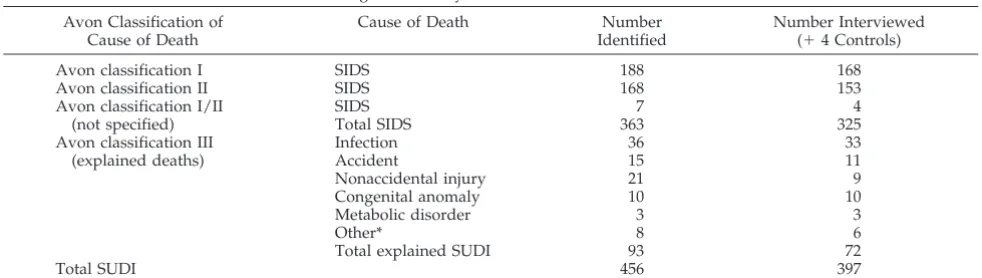
During the 3-year study period a total of 456 SUDI were identified in the study regions. By a compari-son with officially collected statistics on infant deaths (Office for National Statistics) we have subsequently identified a total of 8 infant deaths in the study regions that met our entry criteria but were not in-cluded, mostly because the infants died outside the regions. Overall, we identified 98.3% of SUDI that occurred in the study regions during this period. More than three quarters (n 5 363) of these deaths were attributed to SIDS, the remaining 93 deaths were classified as explained SUDI.
The number of live births within the study regions during the period of the study was 473 000. This gives an incidence of SIDS of 0.77 out of 1000 live births, and an incidence of 0.20 out of 1000 live births for explained SUDI.
The classification of the SIDS deaths and the causes of the 93 explained deaths are shown in Table 1. Of the total 363 SIDS deaths identified in the study regions, 38 were excluded from the analysis: 4 be-cause of police involvement (suspected nonacciden-tal injury was not subsequently confirmed, but ex-cluded because of the study design); 7 because the families could not be traced, having moved from the area; 24 because the parents refused an interview; and 3 because the families did not live in the study
TABLE 1. Cause of Death Classification Using the Avon System Avon Classification of
Cause of Death
Cause of Death Number
Identified
Number Interviewed (14 Controls)
Avon classification I SIDS 188 168
Avon classification II SIDS 168 153
Avon classification I/II SIDS 7 4
(not specified) Total SIDS 363 325
Avon classification III (explained deaths)
Infection 36 33
Accident 15 11
Nonaccidental injury 21 9
Congenital anomaly 10 10
Metabolic disorder 3 3
Other* 8 6
Total explained SUDI 93 72
Total SUDI 456 397
Abbreviations: SIDS, sudden infant death syndrome; SUDI, sudden and unexpected deaths in infancy.
regions (and were therefore excluded by the study design). Of the 356 infants thus potentially included according to the study design, interviews were con-ducted for 325 (91.3%).
Of the 21 explained SUDI families who were not interviewed, 10 were subject to police investigation (and thus excluded according to the study design), 6 families declined an interview, 2 could not be con-tacted, 1 was considered unsuitable because of the mother’s ill health, and for 2 cases we failed to find replacement controls within the required time limit after refusal by the original families. Of the total of 83 families potentially included according to the study design, interviews were conducted with 72 (86.7%).
Controls were sought for 448 of the total of 449 deaths included according to the study design. Of the 1792 controls required, a total of 134 (7.5%) were excluded; 44 families refused to take part in the study (2.5%), 49 families could not be contacted after at least two attempts (2.7%), and 41 (2.3%) were deemed unsuitable (most commonly because of re-cent bereavement or psychiatric illness of a parent) by the family’s health visitor after discussion with the regional scientific supervisor (see above). For each of these exclusions a replacement was immedi-ately found. Thus, 92.5% of control families ap-proached were used in the study.
The median time to the first interview of the be-reaved families was 4 days (interquartile range: 2–10 days; full range: 0 –23 days) and 7 days (interquartile range: 5–10 days; full range: 3–94 days) for the sec-ond interview. The median time from death of the index infant to control interviews was 11 days (in-terquartile range: 9 –12 days; full range: 4 –15 days). The age of the control infant was taken as the age at reference sleep in the 24 hours before interview. Be-cause of the time lag to arrange 4 control interviews the control infants were ;10 days older than the index infants. This difference was taken into account in any subsequent analyses.
Figure 1 compares the maternal occupation of the control mothers in the study with 1991 census data from the South-West health region of mothers with at least one dependent infant. The breakdown is identical except for the division of nonmanual and manual occupations in the third stratum, a similar proportion of control mothers (38.5%) and mothers from the census (40.2%) fall into this stratum overall.
This study deals with the 72 explained SUDI deaths and the 325 SIDS deaths for whom interview data were available from the index family and the full set of four matched controls.
Age Distribution
The age distributions of SIDS infants and ex-plained SUDI deaths are shown in Fig 2. These dis-tributions significantly differed (P,.0001). The pat-tern among the SIDS infants in this study was typical of the age distribution from previous studies before the decrease in SIDS rates. Few deaths occurred in the first month (12%), there was a peak between 28 and 112 days (median591 days, interquartile range: 55–150 days) and fewer deaths after 196 days (14%). The average age of the explained SUDI infants was higher (median5 127 days, interquartile range: 40 – 224 days) with a higher proportion of deaths in the first month of life (18%) and after 196 days (35%).
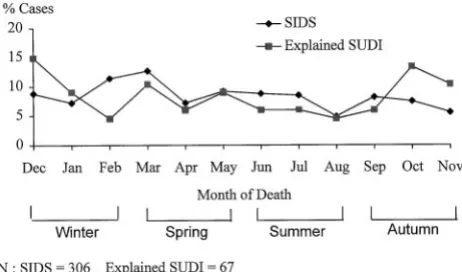
Seasonal Occurrence
The seasonal incidence of the SIDS and explained SUDI deaths are shown in Fig 3. Observations for the first year have been excluded from one region that started data collection part-way through the year. For both groups, between 15% and 30% of deaths occurred in each season. Among SIDS infants the greatest incidence was in the spring (29%), the lowest incidence in the autumn, (21%). Among the ex-plained SUDI infants the greatest incidence was in the autumn (30%) and the lowest in the summer months (16%). For neither group was the monthly
Fig 2. Age distributions of sudden infant death syndrome and explained sudden and unexpected deaths in infancy infants.
Fig 3. Seasonal occurrence of sudden infant death syndrome and explained sudden and unexpected deaths in infancy infants.
variation significantly different (Kolmogorov-Smir-nov one-sample test: .5,P,.10) from the theoret-ical distribution that would occur by chance (;1/12 of deaths occurring each month).
Most of the SIDS deaths (83%) occurred during what the parent classified as the night sleep, for explained deaths this proportion was lower (62%) and there was no significant difference between numbers of deaths on different days of the week for either group (Kolmogorov-Smirnov one-sample test:
P. .20).
Epidemiologic Characteristics of the Two Index Groups Compared With the Controls
Table 2 shows the epidemiologic characteristics relating to the infant, the mother, and the family that were statistically significant in the univariate analy-sis of the SIDS or the explained SUDI deaths. The characteristics of the two index groups were very similar and both were significantly different from the control population. The presence of a congenital anomaly recognized in the newborn period was the only factor significant in the explained SUDI but not in the SIDS, although for both groups the prevalence was higher than for the controls. Given the different
group sizes, the comparative strength of findings is difficult to interpret but strikingly, all the findings were in the same direction for both SIDS and ex-plained SUDI.
When compared with control infants, both SIDS and explained SUDI infants showed an increased prevalence of compromise at birth in terms of short gestation, neonatal problems, resuscitation at deliv-ery using intubation or cardiopulmonary resuscita-tion techniques, and admission to a neonatal inten-sive care unit. A greater proportion of both SIDS and explained SUDI than of controls were male. Taking into account gender and gestational age, low birth weight was an important factor among SIDS infants but just failed to reach significance among the ex-plained SUDI infants. In both groups, a small but significant proportion of infants were one of twins or triplets.
Similar maternal factors were characteristic of SIDS and the explained SUDI group. Both SIDS mothers (median age: 23 years 3 months) and ex-plained SUDI mothers (median age: 24 years 8 months) were younger than the control mothers (me-dian age: 26 years 10 months), a greater proportion were unsupported by a partner and a greater
pro-TABLE 2. Epidemiological Univariate Findings of SIDS and Explained SUDI
Variable Non-Ref Group SIDS Explained SUDI
Index Controls OR (95% Confidence
Interval)
Index Controls OR (95% Confidence
Interval)
Infant factors
Birth weight centiles* ,10th centile 50/323 99/1286 2.27 [1.50–3.45] 8/69 21/278 1.86 [0.70–4.93] Gestational age ,37 wk 63/323 70/1288 3.44 [2.47–4.79] 11/69 12/279 4.93 [1.77–13.77] Neonatal problems Any problem 83/322 143/1291 2.72 [1.93–3.83] 26/69 36/278 3.46 [1.64–7.28] Admission to NICU For any reason 80/323 92/1291 4.25 [2.91–6.21] 23/71 20/277 4.60 [2.01–10.51] Multiple births Twin or triplet 17/325 12/1300 8.27 [3.41–20.05] 5/69 6/288 5.16 [1.00–26.67] Resuscitation at delivery Intubation or CPR 25/321 24/1281 4.11 [2.13–7.92] 6/69 7/274 1.71 [0.45–6.48] Gender Male 205/325 672/1300 1.66 [1.26–2.18] 44/72 146/288 1.57 [0.86–2.88] Congenital anomaly Any anomaly 25/323 66/1290 1.49 [0.89–2.49] 14/69 12/279 5.32 [1.76–16.09] Maternal factors
Maternal age 25 to 21 y 114/325 362/1300 1.76 [1.28–2.41] 25/72 72/288 1.78 [0.91–8.81] 20 y or less 83/325 122/1300 4.27 [2.90–6.29] 14/72 25/288 4.48 [1.77–11.33] Marital status at interview† No current partner 45/325 69/1300 3.00 [1.89–4.77] 14/67 15/288 4.25 [1.65–10.96] Number of children‡ 2 or 3 live births 179/325 642/1300 1.78 [1.31–2.42] 32/69 140/288 1.33 [0.66–2.68]
4 or more live births 56/325 100/1300 3.93 [2.52–6.12] 14/69 22/288 3.43 [1.37–8.56] Previous infant death 1 or more 12/323 15/1298 3.82 [1.58–9.22] 4/65 5/283 5.96 [1.29–27.63] Previous stillbirth 1 or more 10/325 15/1300 2.82 [1.16–6.85] 3/69 2/280 5.53 [0.65–47.15] Social factors
Parent(s) unemployed§ No waged income 158/323 237/1298 4.67 [3.42–6.38] 32/67 44/288 5.56 [2.68–11.55] Occupational classification\ IIIM, IV, V, Unemployed 191/322 446/1296 2.97 [2.22–3.96] 42/67 120/283 2.11 [1.06–4.20] Receipt of income support ie, family credit 206/319 381/1295 5.76 [4.15–7.99] 38/60 78/288 3.85 [1.96–7.55] Parental education Below GCSE 164/317 381/1294 2.62 [1.95–3.53] 34/61 92/288 2.47 [1.28–4.77] Housing tenure Rented/with parents 241/323 510/1297 5.07 [3.67–7.01] 50/66 104/288 5.27 [2.52–11.02] Overcrowding¶ .1 person/room 129/320 284/1296 2.43 [1.81–3.27] 24/62 60/288 2.17 [1.09–4.32] Maternal
Smoking During pregnancy 212/322 348/1299 5.59 [4.10–7.64] 30/61 81/288 3.54 [1.74–7.18] Illegal drug use# During pregnancy 26/314 20/1297 6.88 [3.17–14.93] 3/60 5/288 4.79 [0.89–25.92] Alcohol consumption** .10 units/wk 40/309 91/1296 1.76 [1.13–2.76] 5/59 24/288 1.23 [0.41–3.70]
* Taking into account gender and gestational age (usingzscores).
† Reference group includes mothers married, cohabiting, or supported by partner if not cohabiting. ‡ Including the index or control infant.
§ Both parents (or single parent) unemployed at the time of interview.
\Based on highest classification of either parent and previous occupation if currently unemployed. ¶ Excluding hallways, toilets, bathrooms, and kitchen if not used as a dining room.
# Any illegal substance more than once.
** Before pregnancy. Exact figures during pregnancy were not available but data indicates fewer SIDS mothers decreased consumption during this period.
portion had more children. More of the index moth-ers in both groups had experienced a previous infant death or stillbirth.
Several markers were used for socioeconomic sta-tus. A separate analysis was conducted to predeter-mine the best proxy marker for social deprivation but there was insufficient correlation or agreement within different strata to choose a single measure that was sufficiently representative. Results from all markers have therefore been reported The extent of social deprivation was more widespread among SIDS and explained SUDI families in contrast with the controls whether using unemployment, occupa-tional classification (see definition at end of article), receipt of income support, or parental education as a socioeconomic measure. Figure 4 illustrates the oc-cupational classification of SIDS, explained SUDI,
and the control parents (using the higher of the two parents in which both were working). A striking observation is the number of index households re-ceiving no waged income at the time of interview. Approximately half of the index families (49% SIDS, 48% explained SUDI) received no waged income compared with less than a fifth of the control families (18%). This difference was not explained by an excess of single mothers in the index groups, in 41% of SIDS households and 37% of explained SUDI households both parents were unemployed at the time of inter-view compared with 15% of control households.
Information was also collected on other factors related to socioeconomic status. A significant propor-tion of both SIDS and explained SUDI families had insecure tenure in terms of living in rented accom-modations or with relatives and lived in households that were overcrowded (defined as more than one adult or child per room excluding hallways, toilets, bathrooms, and kitchens if not used as a dining room). The incidence of cigarette smoking and illegal drug use during pregnancy was higher among the explained SUDI mothers compared with the control mothers but even higher among the SIDS mothers. In the latter group a greater proportion of mothers also consumed more than 10 units of alcohol a week.
Table 3 shows the multivariate findings of factors from the univariate analysis that remained signifi-cant when modeled together. Among SIDS infants, important factors included male gender, multiple births, and admission to the neonatal intensive care unit that would include preterm infants or those
Fig 4. Occupational classification of sudden infant death syn-drome, explained sudden and unexpected deaths in infancy, and control families.
TABLE 3. Epidemiological Multivariate Findings of SIDS and Explained SUDI
Variable SIDS Explained SUDI
Adjusted OR [95% CI] Adjusted OR [95% CI]
Infant factors
Birth weight centiles 1.61 [0.91–2.82] 0.97 [0.21–4.418]
Gestational age 1.59 [0.82–3.06] 3.77 [1.32–10.78]
Neonatal problems 1.62 [0.94–1.25] 3.76 [1.49–9.48]
Admission to NICU 3.66 [2.23–6.00] 1.43 [0.39–5.26]
Multiple births 4.03 [1.20–13.50] 3.16 [0.39–25.43]
Resuscitation at delivery 1.80 [0.68–4.78] 0.76 [0.31–4.44]
Gender 1.73 [1.21–2.47] 2.00 [0.88–4.58]
Congenital anomaly 1.71 [0.83–1.26] 4.00 [0.92–17.46]
Maternal factors Maternal age
25 to 21 y 1.70 [1.10–2.61] 2.03 [0.84–4.90]
20 y or less 4.96 [2.83–8.71] 2.26 [0.64–7.92]
Marital status (at interview) 1.39 [0.68–2.85] 2.80 [0.69–11.32] Number of children
2 or 3 2.66 [1.70–4.16] 1.48 [0.61–3.56]
4 or more 5.29 [2.70–10.36] 2.13 [0.66–6.85]
Previous infant death 1.97 [0.55–6.97] 2.40 [0.36–15.91]
Previous stillbirth 3.96 [1.19–13.14] 0.84 [0.06–11.24]
Social factors
Parent(s) unemployed 1.72 [1.11–2.66] 3.92 [1.62–9.48]
Occupational classification 1.17 [0.79–1.71] 1.66 [0.62–4.45]
Receipt of income support 2.08 [1.32–3.27] 1.73 [0.55–5.40]
Parental education 1.01 [0.68–1.49] 1.31 [0.58–2.97]
Housing tenure 1.42 [0.90–2.21] 2.99 [1.21–7.39]
Overcrowding 1.02 [0.67–1.54] 1.45 [0.56–3.72]
Maternal
Smoking 3.10 [2.13–4.51] 1.75 [0.65–4.68]
Illegal drug use more than once 2.11 [0.79–5.62] 0.82 [0.08–8.86]
with a very low birth weight. Young maternal age was significant, especially for mothers aged 20 years or less, along with a higher number of children, suggesting SIDS families were started at an earlier age. Both unemployment and receipt of income sup-port (a means-tested state benefit—see definition at the end of the article), used as proxy measures for socioeconomic status, remained significant in the multivariate model, yet despite this, both maternal smoking during pregnancy and maternal alcohol consumption remained significant. Stratifying mater-nal smoking by socioeconomic status showed that maternal smoking was equally significant in each social stratum whichever measure was used.
Among the explained SUDI infants many of the findings were in the same direction as those of the SIDS infants. The most significant infant factors were neonatal problems and short gestational age. None of the maternal factors remained significant but social factors were important in terms of households re-ceiving no waged income and families living in rented accommodations or with relatives.
Direct Comparison Between the Two Index Groups The above models establish differences between the two index groups and the control population but are difficult to compare across the index groups be-cause of the smaller number of explained SUDI cases and resultant lack of strength in the multivariate modeling process. To ascertain whether any of these factors significantly differed between the SIDS and unexplained SUDI infants a direct comparison was made between the index groups using logistic re-gression. Infant age was used as a covariate in the multivariate modeling process to take account of the difference in age distributions. The results showed that virtually all the comparisons were nonsignifi-cant suggesting the epidemiologic characteristics were similar between the two groups. The only two factors that differed significantly in the univariate analysis and subsequently remained significant in the multivariate analysis were a higher incidence of congenital anomalies at birth in the explained SUDI group (20% vs 8%, multivariate OR5 3.14; 95% CI: 1.52– 6.51;P5.002) and that significantly more SIDS mothers smoked during pregnancy compared with the explained SUDI mothers (66% vs 49%, multivar-iate OR52.03; 95% CI: 1.16 –3.54;P5 .01).
Cause-specific Explained Deaths
The largest subgroup of explained SUDI deaths were those attributable to infection (46%). The age distribution of this subgroup was similar to the ex-plained SUDI group as a whole; most deaths oc-curred in the first month of life (21%) and more than a third of deaths after 6 months. There was a winter peak of deaths from infection, the highest number occurring in December (21%) but this was not signif-icant (Kolmogorov-Smirnov test: 0.05 , P , .1). A multivariate model of these deaths showed unem-ployment to be the most significant factor (OR 5 27.74; 95% CI: 3.19 –241.34; P 5 .003). Short gesta-tional age (OR511.67; 95% CI: 1.84 –74.14;P5.009) and neonatal problems (OR 5 14.27; 95% CI: 1.89 –
107.81; P 5 .01) were also significant. There was a male preponderance (58%) and 50% of the deaths from infection occurred in crowded households (.1 person per room). Both of these factors remained significant in the multivariate model (OR59.26; 95% CI: 1.63–52.52; P 5 .01 and OR 5 10.37; 95% CI: 1.08 –99.59;P5 .04, respectively).
For the last sleep there were several factors among SIDS infants that remained highly significant in the multivariate analysis; a higher proportion were put down in the side or prone position, were covered by an infant or adult duvet, and were found after the sleep with bedding over their head. Although it is inappropriate to compare these factors with many of the explained deaths, a comparison can be made with those infants who died of infection. A higher proportion of infants in this small group were put down in the side position (9 of 26 [35%] infections vs 33 of 132 [25%] controls) and found with their heads covered (5 of 24 [21%] infections vs 17 of 107 [16%] controls) but these differences were not significant in the univariate analysis. A higher proportion were also put down in the prone position (3 of 26 [12%] infections vs 4 of 132 [0.3%] controls) that just reached significance (univariate OR5 5.67, 95% CI: 1.05–30.66). Although SIDS infants were more warmly wrapped than the controls (thermal resis-tance of bedding and clothing was one tog more) and significantly more used duvets, those who died of infection were wrapped less heavily (thermal resis-tance of bedding and clothing was one tog less) than the controls and a smaller proportion (6 of 28 [21%] infections vs 32 of 132 [24%] controls) used duvets.
Data were collected for 11 accidental deaths in this study. None of the factors listed in Table 2 were significant in this subgroup perhaps because of the small numbers, although most of the epidemiologic characteristics were in the same direction as for the SIDS and the deaths from infection.
Of the 10 infants who died unexpectedly from congenital abnormalities, these had been identified in the hospital records at birth for 5, but the infants had not been recognized as having a life-threatening abnormality before death.
Of the total of 21 deaths from nonaccidental injury in the study 12 were boys. The median age at death (median, 103 days; interquartile range: 60 –175 days) was higher than SIDS infants but lower than the overall explained SUDI infants. The age distribution of these infants was more uniform than the age dis-tribution of infants who died from other causes, be-tween 2 and 4 deaths occurring in each of the first 7 months, just 2 deaths occurring thereafter. Only 9 of these families were interviewed, the others being excluded according to the study design. Of the 6 families in this group for whom data were obtained on socioeconomic status, only 1 family received a waged income.
DISCUSSION
This is also the largest reported study of explained SUDI. The key findings are that the socioeconomic context of SIDS has altered, that seasonality seems to have almost disappeared, and that there is little ep-idemiologic difference between those infants dying suddenly of ascertained causes and those dying as SIDS, apart from different age distributions, a greater prevalence of congenital abnormalities at birth among the explained deaths, and an increased risk associated with maternal smoking during pregnancy among the SIDS.
The strength of the study lies in its geographical approach, the very high ascertainment rate, and the quality and comprehensiveness of data collected by trained professionals very soon after the death, min-imizing the risk of inaccurate or biased recall. These strengths are enhanced by the acquisition of 4 con-trols per case and by the use of two consensus pan-els, reviewing all available information, in coding the deaths. The methodology has been used successfully on a more restricted geographical scale for many years in Avon.7,11
Because the diagnosis of SIDS as a cause of death is primarily one of exclusion of known or identifiable conditions, it should, to be reliable, take account of information on the past medical and social history of the mother and infant, the circumstances of the death, a full pediatric postmortem examination, and a multidisciplinary discussion between the relevant health care professionals to identify possibly impor-tant contributory or causal factors.2,12Even after such
thorough investigation, there may be differences of opinion between experts as to whether a particular factor, identified in the history or postmortem exam-ination, was a sufficient cause, or merely a contribu-tory factor in the death.2,13For this reason it is
appro-priate that when investigating factors contributing to SIDS, all sudden unexpected deaths should be in-cluded and investigated, not merely those initially classified as SIDS. We have therefore clearly identi-fied criteria on which deaths were considered ex-plained and thus excluded from classification as SIDS.
Although there is a theoretical risk of matching-out socioeconomic factors by selecting controls from the same geographical area as the cases, cooperation with families, especially those from the socially de-prived group, is vastly improved by liaison with the health visitor from whose caseload the controls were chosen. A comparison of maternal occupational clas-sification among the controls of this study and the 1991 Great Britain census data in the South-West for mothers with dependent children ,1 year old was virtually identical for each social stratum. Each re-gion included in the study had a population of be-tween 3 and 5 million people, bebe-tween 35 000 and 65 000 live births per annum, and a mixture of large inner city connurbations and rural communities. A comparison of the distribution of maternal occupa-tion among control mothers between each of these regions showed no significant differences. Therefore, there was no evidence that the socioeconomic break-down of control mothers used in this study was different from the normal population.
Many studies investigating SIDS have reported numerous epidemiologic characteristics and risk fac-tors strongly associated with SIDS when compared with live control infants. It has been generally as-sumed that these factors are specific to SIDS to the extent that the syndrome has been described as an “epidemiologic entity.”3However, in the univariate
analysis many of the epidemiologic characteristics significant among the SIDS group were similarly identified and in the same direction among the in-fants dying as SUDI as a result of known causes. Many of the factors associated with SIDS that were significantly different from the control population were not significantly different when compared with the explained deaths. This suggests that SUDI possi-bly share some of the underlying factors irrespective of the clinical or pathologic findings, and challenges a rigid concept of SIDS as an epidemiologic entity.
However we found three clear differences between SIDS deaths and the others: first, the distinct age distribution of SIDS infants seen before the decrease in rates14 is still apparent and markedly different
from the age distribution of infants who died of explained causes. Second, more congenital anoma-lies at birth were noted among the explained deaths, although this is not surprising given that .10% of these deaths were explained by congenital anoma-lies. Third, the incidence of maternal smoking during pregnancy, although high among mothers of ex-plained SUDI infants, was significantly higher among SIDS mothers. This finding in particular lends weight to the mounting evidence that the as-sociation between smoking and SIDS may be part of a causal mechanism.
For both SIDS and explained SUDI infants more deaths occurred during the colder months but the trend was not significant. This lack of seasonal vari-ation among SIDS infants stands in marked contrast to the winter peaks apparent before the decrease in the SIDS rate. Although it has been claimed that seasonality still exists,15 national data for England
and Wales during the study period confirm our find-ings.16 The proportion of infants in England and
Wales who died during the winter months (Decem-ber through February) fell from 34% in 1990 to 1991 before the intervention campaign to 27% in 1995 to 1996 after the campaign. The proportion of deaths in this same yearly quarter from our 3-year study was also 27%.
Most previously reported studies of SIDS have included either a relatively low proportion of ex-plained SUDI, or none at all. The interpretation of the information from such studies is thus limited by the unknown numbers of non-SIDS deaths that have been excluded, and the lack in most such studies of parent-based information. A large study in Scot-land17 gathered information on 358 sudden and
of birth certificates18 comparing SIDS and sudden
explained deaths in New York showed many fea-tures in common such as low birth weight, young unsupported mothers, poor maternal education, and late prenatal care. Only SIDS deaths had a higher incidence in the colder months, and multiple births were only significantly associated with explained deaths. However, there was some concern that vital statistics data on cause of death in the United States lacked sufficient detail to distinguish reliably be-tween the index groups.
Data from the 1988 National Maternal and Infant Health Survey,19representative of 11 000 live births,
was used to determine if a number of previously established risk factors specific to SIDS were charac-teristic of postneonatal deaths in general. Both groups were epidemiologically very similar, the only significant differences were a higher prevalence of male gender and maternal smoking during preg-nancy in the SIDS group.20 Of the studies
compara-tively looking at SIDS and non-SIDS deaths, the ma-jority concurred with our finding of a significant difference of age at death with non-SIDS occurring more often in the first month of life and after 6 months.21–23
The similarity between the epidemiologic charac-teristics of the unexplained and the explained deaths (many of which were attributable to infections and some to previously unrecognized congenital anoma-lies) is consistent with the triple risk hypothesis, in which infants compromised by prenatal or perinatal factors are at increased risk of dying if subjected to an insult at a vulnerable stage of their development.24
However, this hypothesis is clearly not applicable to all causes of non-SIDS postneonatal death, for exam-ple accidents.
In comparison with previous studies in the United Kingdom conducted before the “Back to Sleep” cam-paign the proportion of SIDS families in this study classified by occupation class IV, V, or unemployed (63% SIDS vs 27% controls) seems to have markedly risen. The Avon study (1990 –1991)11reported 42% of
SIDS infants in these categories compared with 26% in the control population. A much earlier study con-ducted in Oxford (1966 –1970)25showed remarkably
similar findings (41% SIDS vs 27% controls) whereas a small study in Tameside26 in the 1980s reported a
much higher proportion of SIDS (60%) in the lower socioeconomic groups but this was a region of high unemployment as reflected in the similarly defined proportion of control families (40%). The data from our study therefore seems to show a marked rise of poorer families in the SIDS group, against the back-drop of a fairly constant secular trend in the lower socioeconomic group (between 26% and 29%) during the 1990s.27In half of the index families in this study,
the lone parent or both parents were unemployed. The multivariate analysis of explained SUDI deaths showed insecure tenure of the home to be a signifi-cant factor whereas the same analysis of deaths as a result of infections also showed that living in an overcrowded household was significant. A consis-tent thread through many of the cases was a back-ground of social chaos often coupled with abject
poverty. Indeed the research health visitors encoun-tered examples of poverty and deprivation of a de-gree that they could hardly believe was possible in late 20th century Britain. This striking association of absolute poverty with the risk of infant death re-mains as clear as when first described by Templeman in 1892.28
APPENDIX Definitions
(i) Health Visitor
A health visitor is a graduate nurse with special training in community-based child health surveillance and monitoring. All infants born in England and Wales are allocated a locally-based health visitor.
(ii) Income Support
Income support is a means-tested financial benefit provided by the government to all families with dependent children who re-ceive no waged income or a waged income below a minimum level.
(ii) Occupational Classification
This classification is widely used in the United Kingdom as a proxy marker for socioeconomic status. The underlying basis of the system is to classify people in terms of expected mortality given their occupation. Classification for families is based on either the mother or partner, usually taking the one with the longest life expectancy. The categories are: I) professional occupa-tion; II) managerial or technical occupaoccupa-tion; III) skilled occupation: N 5 nonmanual, M5 manual; IV) semiskilled occupation; V) unskilled occupation. The unemployed are sometimes represented as a sixth category if previous occupation is taken into account.
ACKNOWLEDGMENTS
This study was supported by research grants from the National Advisory Body for the Confidential Enquiry into Stillbirths and Deaths in Infancy and the Foundation for the Study into Infant Deaths.
REFERENCES
1. Bacon CJ, Leach C, Blair P, et al. Sudden unexpected deaths in infancy— the explained group. In:CESDI Fifth Annual Report. London, England: Maternal and Child Health Research Consortium; 1998
2. Blair P, Fleming PJ, Bensley D, et al. The SUDI case-control study. In: The Annual Report for 1994 of the National Advisory Body for CESDI. London, UK: Department of Health; 1996
3. Daltveit AK, Øyen N, Skjærven R, Irgens LM. The epidemic of SIDS in Norway 1967–93: changing effects of risk factors.Arch Dis Child. 1997; 77:23–27
4. Daltveit AK, Irgens LM, Skjærven R, et al. Sociodemographic risk factors for sudden infant death syndrome: associations with other risk factors.Acta Paediatr. 1998;87:284 –290
5. Fleming PJ, Blair PS, Bacon C, et al. Environment of infants during sleep and the risk of the sudden infant death syndrome: results of 1993–5 case-control study for confidential inquiry into stillbirths and deaths in infancy.Br Med J. 1996;313:191–195
6. Blair PS, Fleming PJ, Bensley D, et al. Smoking and the sudden infant death syndrome: results from 1993–5 case-control study for confidential inquiry into stillbirths and deaths in infancy.Br Med J. 1996;313:195–198 7. Gilbert R, Rudd P, Berry PJ, et al. Combined effect of infection and heavy wrapping on the risk of sudden unexpected infant death.Arch Dis Child. 1992;67:171–177
8. SAS Institute Inc. SAS Technical Report P-229, SAS/STAT Software: Changes and Enhancements, Release 6.07.Cary, NC: SAS Institute Inc; 1992 9. Kleinbaum DG. In: Kleinbaum DG, ed.Logistic Regression: A Self-learning Text.Statistics in the Health Sciences series. New York, NY: Springer-Verlag; 1994:134 –135
10. Siegel S, Castellan NJ Jr. The single-sample case. In: Siegel S, Castellan NJ Jr, eds.Nonparametric Statistics for the Behavioural Sciences. Singapore: McGraw-Hill Book Company; 1988
sleeping position in the sudden infant death syndrome: a population based case-control study.Br Med J. 1990;301:85– 89
12. Rognum TO, Willinger M. The story of the “Stavanger definition”. In: Rognum TO, ed.Sudden Infant Death Syndrome. New Trends in the Nine-ties. Oslo, Norway: Scandinavian University Press; 1995
13. Fleming PJ, Berry PJ, Rudd PT, et al. Categories of preventable unex-pected infant deaths.Arch Dis Child. 1991;66:170 –171
14. Peterson WR. Evolution of the epidemiology of sudden infant death syndrome.Epidemiol Rev. 1980;2:97–112
15. Douglas AS, Allan TM, Helms PJ. Seasonality and the sudden infant death syndrome 1987–9 and 1991–3 in Australia and Britain.Br Med J. 1996;312:1381–1383
16. Office for National Statistics (ONS).Sudden Infant Deaths, 1991–1995. Monitor for Population and Health 1996; DH3 96/2:4
17. Bartholomew SEM, Macarthur BA, Bain AD. Sudden infant death syn-drome in south east Scotland.Arch Dis Child. 1987;62:951–956 18. Standfast SJ, Jereb S, Janerich DT. The epidemiology of sudden infant
death in upstate New York II: birth characteristics.AJPH. 1980;70:10: 1061–1067
19. Sanderson M, Placek PJ, Keppel KG. The 1988 maternal and infant health survey: design, content and data availability.Birth. 1991:18;26 –32
20. Taylor JA, Sanderson M. A re-examination of the risk factors for the sudden infant death syndrome.J Pediatr. 1995;126:887– 891
21. Kraus JF, Borhani NO. Post-neonatal sudden unexplained death in California: a cohort study.Am J Epidemiol. 1972:95:497–510
22. Nelson EA, Williams SM, Taylor BJ, Morris B, Ford RPK. Postneonatal mortality in South New Zealand: necropsy data review.Paediatr Perinat Epidemiol. 1989;3:375–385
23. Standfast SJ, Jereb S, Janerich DT. The epidemiology of sudden infant death in upstate New York.JAMA. 1979;241:11:1121–1124
24. Filiano JJ, Kinney HC. A perspective on neuropathological findings in victims of sudden infant death syndrome. The triple risk model.Biol Neonate. 1994;65:194 –197
25. Fedrick J. Sudden unexpected death in infants in the Oxford record linkage area: the mother.Br J Prev Soc Med. 1974;28:93–97
26. McLoughlin A. Sudden infant deaths in Tameside.Health Visitor. 1988; 61:235–237
27. Living in Britain. Results From the 1996 General Household Survey 1998. London, UK: Crown Copyright
DOI: 10.1542/peds.104.4.e43
1999;104;e43
Pediatrics
Group
Platt, Peter J. Berry, BCH, FRCP, Jean Golding and the CESDI SUDI Research
Charlotte E. A. Leach, Peter S. Blair, Peter J. Fleming, Iain J Smith, Martin Ward
Epidemiology of SIDS and Explained Sudden Infant Deaths
Services
Updated Information &
http://pediatrics.aappublications.org/content/104/4/e43
including high resolution figures, can be found at:
References
http://pediatrics.aappublications.org/content/104/4/e43#BIBL
This article cites 16 articles, 8 of which you can access for free at:
Subspecialty Collections
http://www.aappublications.org/cgi/collection/epidemiology_sub Epidemiology
http://www.aappublications.org/cgi/collection/sids_sub SIDS
sub
http://www.aappublications.org/cgi/collection/fetus:newborn_infant_ Fetus/Newborn Infant
http://www.aappublications.org/cgi/collection/commentary Commentary
following collection(s):
This article, along with others on similar topics, appears in the
Permissions & Licensing
http://www.aappublications.org/site/misc/Permissions.xhtml
in its entirety can be found online at:
Information about reproducing this article in parts (figures, tables) or
Reprints
http://www.aappublications.org/site/misc/reprints.xhtml
DOI: 10.1542/peds.104.4.e43
1999;104;e43
Pediatrics
Group
Platt, Peter J. Berry, BCH, FRCP, Jean Golding and the CESDI SUDI Research
Charlotte E. A. Leach, Peter S. Blair, Peter J. Fleming, Iain J Smith, Martin Ward
Epidemiology of SIDS and Explained Sudden Infant Deaths
http://pediatrics.aappublications.org/content/104/4/e43
located on the World Wide Web at:
The online version of this article, along with updated information and services, is
by the American Academy of Pediatrics. All rights reserved. Print ISSN: 1073-0397.