ARTICLE
The Association of Child and Household Food
Insecurity With Childhood Overweight Status
Patrick H. Casey, MDa, Pippa M. Simpson, PhDa, Jeffrey M. Gossett, MSa, Margaret L. Bogle, PhDb, Catherine M. Champagne, PhDc, Carol Connell, PhDd, David Harsha, PhDc, Beverly McCabe-Sellers, PhDb, James M. Robbins, PhDa, Janice E. Stuff, PhDe, Judith Weber, PhDa
aDepartment of Pediatrics, College of Medicine, University of Arkansas for Medical Sciences and Arkansas Children’s Hospital Research Institute, Little Rock, Arkansas; bDelta Nutrition Intervention Research Initiative, US Department of Agriculture, Agricultural Research Service, Little Rock, Arkansas;cPennington Biomedical Research
Center, Baton Rouge, Louisiana;dNutrition and Food Systems, College of Health, University of Southern Mississippi, Hattiesburg, Mississippi;eChildren’s Nutrition
Research Center, Baylor College of Medicine, Houston, Texas
The authors have indicated they have no financial relationships relevant to this article to disclose.
ABSTRACT
CONTEXT.The prevalence of childhood overweight status is increasing. Some have
suggested that childhood overweight is associated with food insecurity, defined as limited or uncertain access to enough nutritious food.
OBJECTIVES.The purpose of this work was to assess the association of household and
child food insecurity with childhood overweight status.
METHODS.The National Health and Nutrition Examination Survey 1999 –2002 uses a
stratified multistaged probability sample and collects a broad array of data from a nationally representative sample of US citizens. All children 3 to 17 years old in this sample are included in these analyses. We measured BMI categorized as at risk for overweight or greater (ⱖ85%) or overweight (ⱖ95%) and household and child food security/insecurity using the US Food Security Scale.
RESULTS.When compared with children from food-secure households, children from
food-insecure households were more likely to demonstrate significant associations with being at risk for overweight or greater in the following demographic catego-ries: 12 to 17 years, girls, white, and in households with income⬍100% and⬎4 times the federal poverty level. Household food insecurity is associated with child overweight status in children aged 12 to 17, girls, and children who live in households with incomes⬎4 times the federal poverty level. Child food insecurity demonstrated the same associations with being at risk for overweight or greater, as did household food insecurity, but associations were also seen in 3- to 5-year-old children, boys, and Mexican American children. Child food insecurity is signifi-cantly associated with child overweight status for children aged 12 to 17, girls, white children, and children in families with income ⱕ100% poverty level. Controlling for ethnicity, gender, age, and family poverty index level, childhood food insecurity is associated with a child being at risk for overweight status or greater, but not overweight status.
www.pediatrics.org/cgi/doi/10.1542/ peds.2006-0097
doi:10.1542/peds.2006-0097
Key Words
food insecurity, child health status, overweight children
Abbreviations
OW— overweight
ARO—at risk for overweight or greater NHANES—National Health and Nutrition Examination Survey
CONCLUSIONS.Household and child food insecurity are as-sociated with being at risk for overweight and over-weight status among many demographic categories of children. Child food insecurity is independently associ-ated with being at risk for overweight status or greater while controlling for important demographic variables. Future longitudinal research is required to determine whether food insecurity is causally related to child over-weight status.
T
HE INCREASED PREVALENCEof childhood overweight (OW) status (BMIⱖ95%) and at risk for overweight or greater ([ARO] BMI ⱖ85%) was initially noted in national surveys in the late 1980s to early 1990s.1By the end of 1994,⬃11% of children in the United States aged 6 to 19 were overweight compared with ⬃5% in the 1970s.2This prevalence of overweight children had in-creased to just more than 15% by 20003and 16.5% by the end of 2002.4 During this time, the prevalence of overweight status among 2- to 5-year-old children dou-bled from 5% in the 1970s3to ⬎10% in 2002.4,5 The highest prevalence of overweight status occurs in black girls aged 6 to 19 years (⬃23%) and Mexican American boys aged 6 to 19 years (⬃25.5%).4Even higher preva-lence of overweight has been noted in Native American populations.6The severity of overweight status has also increased along with the prevalence. Although the prevalence of overweight status among children aged 2 to 19 years increased by 182% between the early 1970s and 2000, the severity or degree of overweight increased by 247% during this same time.7 The metabolic syndrome was found in 4% of all children aged 12 to 19 years by 1994, and ⬃29% of overweight adolescents had metabolic syndrome.8This striking increase in prevalence and se-verity of childhood overweight has been called a “pan-demic”9and is known to be associated with a broad array of long-term negative health consequences with corre-sponding economic burden.10–12
Household food insecurity is defined by national ex-perts as limited or uncertain availability of nutritionally adequate and safe foods and limited or uncertain ability to acquire acceptable foods in socially acceptable ways.13,14 The most recent national data in 2004 indi-cated that 11.9% of all households (13.5 million) were food insecure.15 Of households with children, 17.6% were food insecure at some time during that preceding year. The prevalence of food insecurity is higher in black (23.7%) and Hispanic households (21.7%) than in households of other racial groups. The prevalence is higher in households with incomes below the federal poverty line (36.8%). As measured by the US Food Security Scale, food security is considered a marker for the adequacy and stability of the household food supply over the preceding 12 months for active, healthy living
of all household members.13Eight of the 18 questions in this US Food Security Scale ask specifically about expe-riences and conditions of children in the household. These 8 child-referred questions have been used to con-struct a Child Food Security Scale.16 This measure is conceived as identifying a more severe form of food security than that based on the household. The Child Food Security Scale has not been used to date in pub-lished research.
Household food insecurity has been associated with lower nutrient intake and lower self-reported general physical and mental health status in adults.17–21Although the results are inconsistent among various studies, there is a suggestion that household food insecurity is associ-ated with obesity in women but not men.22–27 Early national surveys measured food insufficiency, a single question that assessed the quantity of food available at the household level but not the quality, uncertainty, or psychological components of food access as measured by the US Food Security Scale.28 Children in households judged to be food insufficient or to have hunger using other brief research measures have been noted to have lower general health status, more physical symptoms, more mental health and behavioral problems, and more academic difficulties.29–33 Recent studies that used the full US Food Security Scale found that household food insecurity was associated with poorer general health status and health-related quality of life in the children of these households.34,35
The possible paradoxical association of hunger and food insecurity with childhood obesity was first raised in a case report 10 years ago.36The author speculated that this association may be because of “an adaptive process to food shortages whereby increasing the consumption of inexpensive energy dense foods results in increasing body mass.” Plausible mechanisms that may explain this association include cheaper cost and overconsumption of energy-dense foods,36,37 overeating when foods be-come available,38 metabolic changes that may permit more efficient use of energy,39fear of food restriction,40 and higher susceptibility to hunger, disinhibition, and environmental cues.41A study of grade 5 Hispanic chil-dren found that those from the most food insecure households had significant decreases in energy intakes and meat consumption as payday approached.42To date, no empiric data of children has confirmed the associa-tion of food insecurity with childhood overweight status in this country.27,39,42,43
We used data collected in the 1999 –2002 National Health and Nutrition Examination Survey (NHANES).49 Using children ages 3 to 17 years in this nationally representative sample, we asked the following research questions: (1) is childhood overweight status associated with household food insecurity and childhood food in-security; (2) are these associations found in demographic subgroups of children, including age, gender, race, and household poverty status; and (3) does the association between household and child food insecurity with child-hood overweight persist after controlling for household poverty, child age, gender, and race?
METHODS
Sample
The NHANES is a series of national examination studies conducted in the United States since 1970. Since 1999, the surveys have been continuous; data have been col-lected every 2 years from a representative sample of the US population.49The NHANES design is a stratified mul-tistage probability sample of the civilian noninstitution-alized US population. In the basic protocol for these surveys, randomly selected subjects are first interviewed in their homes where information on a broad array of demographic-, diet-, and health-related questions is ob-tained. In a mobile examination center, body weight and height are measured with standard protocol. This report is based on an analysis of child and household food-security and overweight status (based on BMI percen-tiles) for US children 3 to 17 years of age in the NHANES 1999 –2002. Informed consent was obtained from all of the participants, and the protocol was approved by the Institutional Review Board of the National Center for Health Statistics. The NHANES recommends that analy-sis be conducted for the combined 1999 –2000 and 2001–2002 data sets. The appropriate 4-year sample weights have been calculated and added to the demo-graphic data files to facilitate the combined use of these 2 cycles.
Measures
Overweight Calculation
The NHANES body measurement component proce-dures are outlined in the NHANES Anthropometry Pro-cedures Manual (www.cdc.gov/nchs/data/nhanes/bm.pdf). The body measurement component was performed in a specially equipped room in a mobile examination center. A health technician assisted by a trained recorder gath-ered all of the data. For weight and standing height, data were captured electronically from the measuring instru-ments to minimize potential data entry errors. BMI was calculated from measures of height and weight (kg/m2).
BMI percentiles were calculated by age in months and gender according to the Centers for Disease Control and Prevention reference.50 These calculations were
per-formed by the NHANES and released in the data set. ARO is defined as BMIⱖ85%, and OW is defined as BMI ⱖ95% for gender and age.51
Household Food-Security Status
Household food security was evaluated using the 18-question US Food Security Scale.13,52 This instrument was administered to 1 adult in a household. Using stan-dard scoring methods, households were placed into 2 categories: food secure or food insecure, which included families who were food insecure with or without hun-ger.
Child Food Security
Eight of the 18 questions in the US Food Security Scale refer specifically to children. Affirmative responses toⱖ2 of these 8 child-referenced questions were used to cat-egorize the child as food insecure.16
Statistical Analyses
All of the analyses were performed according to NHANES analytic guidelines.53The household and child food-security status categories were calculated and re-leased in the NHANES data sets. Variables used in the analysis available in the NHANES data set include child age (3–5, 6 – 8, 9 –11, and 12–17 years), poverty index (0 –1,⬎1–2,⬎2–3,⬎3– 4, and⬎4 –5), gender, and race (non-Hispanic white, non-Hispanic black, Mexican American, and other). Poverty index of 0 to 1 included families whose household incomes wereⱕ100% of the poverty level, poverty index of 1 to 2 included families of income from 100% to 200% of the poverty level, and so forth.
All of the statistical analyses were conducted by using SAS 9.0 for Windows (SAS Institute, Inc, Cary, NC) and SUDAAN (Research Triangle Institute, Research Triangle Park, NC). All of the estimates were weighted by using the 4-year sample weights (WTMEC4YR). The sample weights account for the unequal probabilities of selec-tion resulting from the complex sample design, survey nonresponse, and the planned oversampling of selected
population subgroups. SEs were estimated with
SUDAAN using the Taylor series linearization.
Comparisons of categorical variables were performed by2analyses, using weighted percentages. The
RESULTS
A total of 6995 children from aged 3 to 17 years was available for analyses. A description of this sample by age, family poverty index, gender, and race is depicted in Table 1. Almost 20% of the children in the sample were aged 3 to 5 years, and 40% were 12 to 17 years. Just less than one fourth were categorized as 0 to 1 on the pov-erty index, and 22% were categorized as ⬎4 on the poverty index. A total of 50.8% were boys, 60.8% were white, 15% were black, and 11.9% were Mexican American. The prevalence of household food insecurity in these households with children was 17%. The prev-alence of child food insecurity was 11.2%. The BMI of
⬃15% of the children wasⱖ85% and⬍95%, and an-other 15.3% were ⱖ95%, indicating a distribution skewed to the right. Almost 30% (29.8%) were ARO.
Table 2 shows the prevalence of child OW status by food-security status (child and household) according to child age and gender. Children who live in food-insecure households or who were child food insecure were sig-nificantly more likely to be ARO (P⬍.01) and OW (P⬍ .01). Children who were normal weight were more likely to live in food-secure households (67.4% vs 61.5%;Pⱕ.01) and were more likely to be child food
secure (67.4% vs 58.4%; P ⱕ .01; data not shown in Table 2).
Children aged 3 to 5 years and boys who live in food-insecure households did not demonstrate a higher prevalence of ARO than their counterparts in food-se-cure households. However, the 3- to 5-year-old children and boys who were child food insecure had a signifi-cantly higher prevalence of ARO. Teens aged 12 to 17 years and girls had significantly higher prevalence of ARO, whether child food insecure or household food insecure. The prevalence of ARO for children aged 6 to 8 and 9 to 11 years was not higher for either household food insecurity or child food insecurity, although all demonstrated trends of higher prevalence of ARO when food insecure.
Similar results were found with child OW status. Chil-dren aged 12 to 17 years and girls demonstrated a higher prevalence of OW for both child and household insecu-rity. Boys had a higher prevalence of OW status for child food insecurity only. This association of OW status with food insecurity was not found in any other age group, although the trend in all of the age groups was for higher prevalence of OW in the food insecure.
Table 3 depicts the prevalence of child OW status by food-security status (child and household) according to child race and household poverty index. The association of food insecurity and childhood ARO differs for black, white, and Mexican American children. Among white children, ARO is significantly higher for both the child food insecurity and household food insecurity group. Among black children, there is virtually no difference in prevalence of ARO in either the child food insecurity group or household food insecurity group. Mexican American children have a significantly higher preva-lence of ARO for child food insecurity but not household food insecurity. A higher prevalence of child OW status was found only in white children who were child food insecure but not household food insecure. The preva-lence of OW status was not higher for black or Mexican American children whether child or household food in-secure.
Children who live in households at ⱕ100% of the federal poverty level had significantly higher prevalence of ARO, whether child food insecure or household food insecure. There was no difference in the prevalence of ARO based on child or household food insecurity status in children from households with a poverty index from 1 to 4 (101%– 400% of poverty level). There was a significantly higher prevalence of ARO in children with a poverty index ⬎4 who live in households that were food insecure. A higher prevalence of child OW status was found only for children in households atⱕ100% of the federal poverty level who were child food insecure and children who live in households with poverty indi-ces⬎4 who were household food insecure.
The results of the logistic regression of childhood food
TABLE 1 Demographics, Food-Security, and Weight Status in
NHANES 1999 –2002 Children Aged 3 to 17 Years
Total (N⫽6995) % Total
(Weighted)
Age, y
3–5 19.1
6–8 21.4
9–11 19.5
12–17 40.0
Poverty index
0–1 23.4
⬎1–2 25.3
⬎2–3 16.6
⬎3–4 12.6
⬎4–5 22.1
Gender
Male 50.8
Female 49.2
Race
Non-Hispanic white 60.8
Non-Hispanic black 15.0
Mexican American 11.9
Other 12.3
Household food security
Food secure 83.0
Food insecure 17.0
Child food security
Food secure 88.8
Food insecure 11.2
Child weight status
Underweight (BMI⬍P5) 3.6
Normal (P5ⱖBMI⬍P85) 66.6
At risk for overweight (BMIPⱖP85⬍P95) 14.5
OW (BMIⱖP95) 15.3
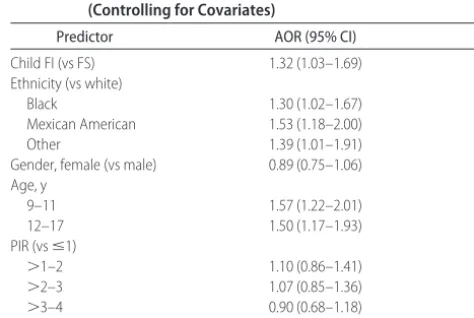
insecurity on child ARO status, controlling for child race, gender, age, and household poverty index, are presented in Table 4. Independent of these demographic variables, child food-security status is significantly associated with child ARO (adjusted odds ratio⫽1.32; 95% confidence interval: 1.03–1.69; P⫽.03). In similar logistic-regres-sion analyses, child food-security status was not inde-pendently associated with child OW status. Also, in sim-ilar analyses, household food-security status was not independently associated with either ARO or child OW status.
DISCUSSION
In this large nationally representative sample of children aged 3 to 17 years old, both household and child food insecurity are significantly associated with children be-ing ARO (BMI ⱖ85%). Child food insecurity is signifi-cantly associated with ARO for children aged 3 to 5 and 12 to 17 years, boys and girls, white and Mexican Amer-ican (but not black), and children in families with in-come ⱕ100% poverty level. Child food insecurity is
significantly associated with OW for children aged 12 to 17 years, girls, white children, and children in families with incomeⱕ100% poverty level. Household food
in-TABLE 2 Overweight Status According to Food-Security Status for Child Age Group and Gender
Variable ARO OW
Child Food-Security Status
Household Food-Security Status
Child Food-Security Status
Household Food-Security Status
FS FI FS FI FS FI FS FI
Age, y
3–5 21.6 36.9a 22.6 24.8 10.4 19.2 10.8 13.1
6–8 29.3 42.2 29.4 37.0 14.6 21.7 14.5 19.4
9–11 32.3 37.6 31.6 39.8 16.0 22.5 15.8 21.8
12–17 30.1 38.3b 29.7 37.6b 15.6 20.8b 15.5 20.1b
Gender
Male 29.7 40.7a 30.4 33.5 15.4 23.0b 15.8 18.5
Female 27.8 36.6b 27.0 38.2a 13.6 18.8a 13.2 19.7a
Total 28.8 38.8a 28.7 35.7a 14.5 21.1a 14.5 19.0a
FS indicates food secure; FI, food insecure.
aPⱕ.01. bPⱕ.05.
TABLE 3 OW Status According to Food-Security Status for Child Race and Household Poverty Index
Variable ARO OW
Child Food-Security Status
Household Food-Security Status
Child Food-Security Status
Household Food-Security Status
FS FI FS FI FS FI FS FI
Race
White 25.8 37.2a 25.8 32.5a 12.2 20.3a 12.3 16.7
Black 33.4 35.0 33.7 33.6 18.7 17.5 18.9 12.7
Mexican
American 36.3 42.2a 37.0 39.4 20.9 23.0 21.2 22.0
Poverty index
0–1 29.8 39.3a 29.9 36.5a 16.5 22.3a 16.7 20.7
1–2 31.5 37.6 32.6 31.2 16.1 17.0 16.4 15.2
2–3 30.4 34.0 29.5 42.3 15.0 15.1 14.9 15.3
3–4 26.7 24.1 26.8 21.9 12.2 23.4 12.3 20.7
4 25.1 54.8 24.9 55.4b 13.1 29.5 12.9 35.7a
FS indicates food secure; FI, food insecure; poverty index 0 to 1, family incomeⱕ100% federal poverty level; 1 to 2, family income 100% to 200% federal poverty level, and so forth.
aPⱕ.05. bPⱕ.01.
TABLE 4 Risk of Child ARO Status and Child Food Insecurity (Controlling for Covariates)
Predictor AOR (95% CI) P
Child FI (vs FS) 1.32 (1.03–1.69) .03
Ethnicity (vs white)
Black 1.30 (1.02–1.67) .01
Mexican American 1.53 (1.18–2.00)
Other 1.39 (1.01–1.91)
Gender, female (vs male) 0.89 (0.75–1.06) .19 Age, y
9–11 1.57 (1.22–2.01)
12–17 1.50 (1.17–1.93)
PIR (vsⱕ1) .57
⬎1–2 1.10 (0.86–1.41)
⬎2–3 1.07 (0.85–1.36)
⬎3–4 0.90 (0.68–1.18)
⬎4–5 0.86 (0.69–1.08)
security is associated with ARO in children 12 to 17 years, girls, white children, and household poverty 0%– 100% and 400%–500% times the federal poverty level. Household food security is associated with child OW status in children aged 12 to 17 years, girls, and children who live in households with incomes ⬎4 times the federal poverty level. Controlling for ethnicity, gender, age, and family poverty index, childhood food insecurity is independently associated with ARO but not OW. Household food insecurity was not independently asso-ciated with ARO or OW after controlling for these de-mographic variables.
Previous studies in this country using small conve-nience samples with limited demographic variation42,43 or older national surveys including NHANES III have not found an association between household food insecurity (insufficiency) and child ARO or OW status.27,39,54,55 These negative results may be because of small sample size with limited statistical power or homogeneous de-mographic make-up of these convenience samples. Ear-lier national surveys used data collected several years ago, from 1988 –1994 for NHANES III. At that time, the prevalence of child OW status was lower, perhaps di-minishing the likelihood of an association between food insecurity and child OW status. The prevalence of ARO (BMI ⱖ85%) in this sample is ⬃30%, and ⬎40% in some food-insecure subcategories, a striking finding.
The availability of the current NHANES data provided the opportunity to advance this literature with the use of the more recent national data and the Child Food Secu-rity Scale. The Child Food SecuSecu-rity Scale is perceived as measuring a more severe degree of food insecurity as compared with the full household food-security mea-sure, because this measure reflects a decrease in quality or quantity of food directly available to children. The prevalence of 11.2% child food insecurity has not been reported previously. This more severe measure of food insecurity was associated with ARO and OW in several demographic categories, most striking in children aged 12 to 17 years, white children, girls, and those from families with incomes below the federal poverty index. The household food insecurity measure was associated with child ARO and OW in several but fewer demo-graphic subgroups. In addition, only the childhood food insecurity measure predicted ARO while controlling for the array of demographic characteristics. One can rea-sonably assume that these differences relate to an asso-ciation of childhood ARO status with the more extreme degree of food insecurity measured by the child scoring method.
The lack of relationship between child food insecurity and household food insecurity and ARO and OW in black children is of interest. For black children, the prev-alence of ARO and OW is the same regardless of food-security status. The prevalence of ARO was 35% among child food insecure versus 33.4% among child food
se-cure. The prevalence of OW was 17.5% among child food insecure versus 18.7% for child food secure. One can only speculate why there is no relationship in the black children with very high prevalence of ARO, OW, and food insecurity. This difference between races might relate to variation in food availability or dietary habits not related to food-security status. There is a suggestion that black children in general receive a higher percent of energy from fat.56,57 Perhaps food insecurity does not affect this higher fat energy intake. In a study that used NHANES III (1998 –1994), no association was found be-tween ARO (BMIⱖ85%) in children who lived in food-insufficient households (using the single question as noted earlier), after controlling for confounding vari-ables.39 Among various demographic categories, only older non-Hispanic white girls from low income families demonstrated a significant association between house-hold food insufficiency and child ARO status. The asso-ciation of ARO in children with food-insecure house-holds with family income⬎4 times the poverty index is also of interest. Perhaps in these relatively economically advantaged families, food insecurity may represent very poor meal planning in which children consume easily accessible energy-dense foods. It is also possible that this association is spurious, perhaps related to small sample size. Only 13 families in this higher income level were household food insecure, and 6 of those were Mexican American. In this sample, Mexican American children have the highest prevalence of ARO and OW. Future research in other large samples is required to verify these findings.
Given the cross-sectional data available in the NHANES, these data do not allow for a conclusion re-garding causality between food insecurity status and child ARO and OW status. It is conceptually plausible that food-insecure status would result in lower intake of healthy foods and nutrients and perhaps greater intake of unhealthy obesigenic foods, which may ultimately contribute to poorer child health and nutrition status.58 Families of limited income have no flexible financial resources to deal with unexpected changes in monthly expenses.59 Families with restricted and diminished in-come may, thus, ration food, regulate frequency of meals, and/or use low-cost energy-dense foods at times of financial constraints, perhaps particularly at the end of the month when monthly financial resources may be depleted.60
CONCLUSIONS
gender. Future longitudinal research with larger samples will be required to determine whether food insecurity is a part of the causal pathway of childhood OW, what precise mechanisms account in the causal relationships, and whether interventions can improve the prevalence of food insecurity and its association with children ARO status. Given the increasing prevalence of both child-hood OW status and household food insecurity, our data suggest that both clinicians and child health policy ex-perts should work toward achieving food security for all families.
ACKNOWLEDGMENTS
This study was funded by the Agricultural Research Ser-vice, US Department of Agriculture (project 6251-53000-002-00D). This support provided for all statistical analyses, interpretation of data, and the preparation, review, and approval of the article.
This research was conducted by the Lower Mississippi Delta Nutrition Intervention Research Consortium. Ex-ecutive Committee and Consortium partners included: Margaret L. Bogle, PhD (Executive Director, Delta NIRI, Agricultural Research Service of the US Department of Agriculture, Little Rock, AR); Ross Santell, PhD (Alcorn State University, Lorman, MS); Patrick H. Casey, MD (Arkansas Children’s Hospital Research Institute, De-partment of Pediatrics, University of Arkansas for Med-ical Sciences, Little Rock, AR); Donna Ryan, MD (Pen-nington Biomedical Research Center, Baton Rouge, LA); Bernestine McGee, PhD (Southern University and A&M College, Baton Rouge, LA); Edith Hyman, PhD (Univer-sity of Arkansas, Pine Bluff, AR); and Kathleen Yadrick, PhD (University of Southern Mississippi, Hattiesburg, MS).
REFERENCES
1. Troiano RP, Flegal KM, Kuczmarski, RJ, Campbell SM, John-son CL. Overweight prevalence and trends for children and adolescents: the National Health and Nutrition Examination Surveys, 1963–1991. Arch Pediatr Adolesc Med. 1995;149: 1085–1091
2. Troiano RP, Flegal KM. Overweight children and adolescents: description, epidemiology, and demographics.Pediatrics.1998; 101:497–504
3. Ogden CL, Flegal KM, Carroll MD, Johnson CL. Prevalence and trends in overweight among US children and adolescents, 1999 –2000.JAMA.2002;288:1728 –1732
4. Hedley AA, Ogden CL, Johnson CL, Carroll MD, Curtin LR, Flegal KM. Prevalence of overweight and obesity among US children, adolescents, and adults, 1999 –2002. JAMA. 2004; 291:2847–2850
5. Sherry B, Mei Z, Scanlon KS, Mokdad AH, Grummer-Strawn LM. Trends in state specific prevalence of overweight and underweight in 2 through 4-year old children from low-income families from 1989 –2000. Arch Pediatr Adolesc Med.
2004;158:1116 –1124
6. Caballero B, Himes JH, Lohman T, et al. Body composition and overweight prevalence in 1704 school children from 7 Amer-ican Indian communities.Am J Clin Nutr.2003;78:308 –312
7. Jollife D. Extent of overweight among US children and adoles-cents from 1971–2000.Int J Obes Relat Metab Disord.2004;28: 4 –9
8. Cook S, Weitzman M, Avinger P, Nguyen M, Dietz WH. Prev-alence of metabolic syndrome phenotype in adolescents: find-ings from the third NHANES, 1988 –1994.Arch Pediatr Adolesc Med.2003;157:821– 827
9. Kimm SYS, Obarzane KE. Childhood obesity: a new pandemic of the new millennium.Pediatrics.2002;110:1003–1007 10. Dietz WH, Robinson TN. Overweight children and adolescents.
N Engl J Med.2005;352:2100 –2109
11. Dietz WH. Health consequences of obesity in youth: childhood predictors of adult disease. Pediatrics. 1998;101(suppl 3): 518 –526
12. Wang G, Dietz WH. Economic Burden of obesity in youths aged 6 to 17 years: 1979 –1999.Pediatrics.2002;109(5). Avail-able at: www.pediatrics.org/cgi/content/full/109/5/e81 13. Bickel G, Nord M.Measuring Food Security in the United States:
Guide to Measuring Household Food Security. Rev 2000. Alexan-dria, VA: US Department of Agriculture/Food and Nutrition Services/Office of Analysis, Nutrition, and Evaluation; 2000 14. Keenan DP, Olson C, Hersey JC, Parmer SM. Measures of food
insecurity/security.J Nutr Educ.2001;33(suppl 1)S49 –S58 15. Nord M, Andrews M, Carlson S.Household Food Security in the
United States, 2004. Washington, DC: US Department of Agri-culture, Economic Research Service; 2005:1–57. Food Assis-tance and Nutrition Research Program Report 11
16. Nord M, Bickel G. Measuring Children’s Food Security in US Households, 1995–1999. Washington, DC; US Department of Agriculture, Food and Rural Economics Division; 2002. Eco-nomic Research Report No. 25
17. Kendall A, Olson DM, Frongillo EA. Relationship of hunger and food insecurity to food availability and consumption.J Am Diet Assoc.1996;96:1019 –1024
18. Pheley AM, Holben DH, Graham AS, Simpson C. Food security and perceptions of health status: a preliminary study in rural Appalachia.J Rural Health.2002;18:447– 454
19. Tarasuk VS, Beaton GH. Women’s dietary intakes in the con-text of household food insecurity.J Nutr.1999;129:673– 679 20. Tarasuk VS. Household food insecurity with hunger is
associ-ated with women’s food intakes, health and household cir-cumstances.J Nutr.2001;131:2670 –2676
21. Stuff JE, Casey PH, Szeto KL, et al. Household food insecurity is associated with adult health status. J Nutr. 2004;134: 2330 –2335
22. Townsend, MS, Peerson J, Love B, Achterberg C, Murphy SP. Food insecurity is positively related to overweight in women.J Nutr.2001;131:1738 –1745
23. Adams EJ, Grummer-Strawn L, Chavez G. Food insecurity is associated with increased risk of obesity in California women.
J Nutr.2003;133:1070 –1074
24. Basiotis PP, Lino M. Food insufficiency and prevalence of over-weight among adult women.Fam Econ Nutr Rev Insight.2003; 26:55–57
25. Vozoris NT, Tarasuk VS. Household food insufficiency is asso-ciated with poorer health.J Nutr.2003;133:120 –126 26. Laraia BA, Siega-Riz AM, Evenson KR. Self-reported
over-weight and obesity are not associated with concern about enough food among adults in New York and Louisiana.Prev Med.2004;38:175–181
27. Bhattacharya J, Currie J, Haider S. Poverty, food insecurity, and nutritional outcomes in children and adults.J Health Econ.
2004;23:839 – 862
29. Weinreb L, Wehler C, Perloff J, et al. Hunger: Its impact on children’s health and mental health. Pediatrics.2002:110(4). Available at: www.pediatrics.org/cgi/content/full/110/4/e41 30. Alaimo K, Olson CM, Frongillo EA, Briefel RB. Food
insuffi-ciency, family income, and health in U.S. preschool and school aged children.Am J Public Health.2001;91:781–786
31. Kleinman RE, Murphy JM, Little M, et al. Hunger in children in the United States: potential behavioral and emotional cor-relates.Pediatrics. 2003;101(1). Available at: www.pediatrics. org/cgi/content/full/101/1/e3
32. Alaimo K, Olson CM, Frongillo EA. Food insufficiency and American school-aged children’s cognitive, academic, and psy-chosocial development.Pediatrics.2001;108:44 –53
33. Alaimo K, Olson CM, Frongillo EA. Family food insufficiency, but not low family income, is positively associated with dyst-hymia and suicide symptoms in adolescents.J Nutr.2002;132: 719 –725
34. Casey PH, Szeto KL, Robbins JM, et al. Child health related qualify of life and household food security.Arch Pediatr Adolesc Med.2005;159:51–56
35. Cook JT, Frank DA, Berkowitz C, et al. Food insecurity is associated with adverse health outcomes among human in-fants and toddlers.J Nutr.2004;134:1432–1447
36. Dietz WH. Does hunger cause obesity? Pediatrics. 1995;95: 766 –767
37. Drewnowski A, Specter SE. Poverty and obesity: the role of energy density and energy costs.Am J Clin Nutr.2004;79:6 –16 38. Scheier LM. What is the hunger-obesity paradox.J Am Diet
Assoc.2005;105:883– 886
39. Alaimo K, Olson CM, Frongillo EA. Low family income and food insufficiency in relation to overweight in US children: is there a paradox?Arch Pediatr Adolesc Med.2001;155:1161–1167 40. Polivy J Psychological consequences of food restriction.J Am
Diet Assoc.1996;96:589 –592.
41. Provencher V, Drapeau V, Tremblay A, Despres JP, Lemieux S. Eating behaviors and indexes of body composition in men and women from the Quebec family study. Obes Res. 2003;11: 783–792
42. Matheson DM, Varaday J, Varaday A, et al. Household food security and nutritional status of Hispanic children.Am J Clin Nutr.2002;76:210 –217
43. Kaiser LL, Melgar-Quinonez HR, Lamp CL, et al. Food security and nutritional outcomes of preschool age Mexican American children.J Am Diet Assoc.2002;102:924 –929
44. Sobal J, Stunkard AJ. Socioeconomic status and obesity: a review of the literature.Psychol Bull.1989;105:260 –275 45. Feinstein JS. The relationship between socioeconomic status
and health: a review of the literature. Milbank Q. 1993;71: 279 –322
46. Kington R, Smith JP. Socioeconomic status and racial and
ethnic differences in functional status associated with chronic disease.Am J Public Health.1997;87:805– 810
47. Winkleby MA, Robinson TN, Sundquist J, Kraemer H. Ethnic variation in cardiovascular disease risk factors among children and young adults: findings from the Third National Health and Nutrition Examination Study. 1988 –1994.JAMA. 1999;281: 1006 –1013
48. Jeffery RW. Socioeconomic status, ethnicity and obesity in women.Ann Epidemiol.1996;6:263–265
49. Centers for Disease Control and Prevention. National Health and Nutrition Examination Survey (NHANES) 1999 –2002. Available at: www.cdc.gov/nchs/nhanes.htm. Accessed June 10, 2004
50. Ogden CL, Kuczmarski RJ, Flegal KM, et al. Centers for Disease Control and Prevention 2000 growth charts for the United States: improvements to the 1977 National Center for Health Statistics version.Pediatrics.2002;109:45– 60
51. Barlow SE, Dietz WH. Obesity evaluation and treatment: ex-pert committee recommendations. Pediatrics. 1998;102(3). Available at: www.pediatrics.org/cgi/content/full/102/3/e29 52. Carlson SJ, Andrews MS, Bickel GW. Measuring food
insecu-rity and hunger in the United States: development of a national benchmark measure and prevalence estimates.J Nutr.1999; 129:510S–516S
53. Centers for Disease Control and Prevention. NHANES analytic guidelines. Available at: www.cdc.gov/nchs/date/nhanes_ general_guidelines_June_04.pdf. Accessed June 28, 2004. 54. Jones SJ, Jahns L, Laraia BA, Haughton B. Lower risk of
overweight in school aged food insecure girls who participate in food assistance.Arch Pediatr Adolesc Med.2003;157:780 –784 55. Casey PH, Szeto K, Lensing S, et al. Children in food-insufficient low-income families: prevalence, health and nutri-tion status.Arch Pediatr Adolesc Med.2001;155:508 –514 56. Troiano RP, Briefel RR, Carroll MD, Bialostosky K. Energy and
fat intakes of children and adolescents in the United States: data from the National Health and Nutrition Examination Sur-veys.Am J Clin Nutr.2000;72(suppl):1343S–1353S
57. Champagne CM, Bogle ML, McGee BB, et al. Dietary intake in the Lower Mississippi Delta region: results from the Foods of Our Delta Study.J Am Diet Assoc.2004;404:199 –207 58. Campbell CC. Food insecurity: A nutritional outcome or a
predictor variable?J Nutr.1991;121:408 – 415
59. Gunderson C, Gruber J. The Dynamic Determinants of Food Insufficiency: Second Food Security Measurement and Re-search Conference. Vol 2. In: Andrews M, Prell M, eds.Food Assistance and Nutrition Research Report. Washington, DC: US Department of Agriculture Economic Research Service; 2001: 92–110
DOI: 10.1542/peds.2006-0097
2006;118;e1406
Pediatrics
James M. Robbins, Janice E. Stuff and Judith Weber
Catherine M. Champagne, Carol Connell, David Harsha, Beverly McCabe-Sellers,
Patrick H. Casey, Pippa M. Simpson, Jeffrey M. Gossett, Margaret L. Bogle,
Overweight Status
The Association of Child and Household Food Insecurity With Childhood
Services
Updated Information &
http://pediatrics.aappublications.org/content/118/5/e1406
including high resolution figures, can be found at:
References
http://pediatrics.aappublications.org/content/118/5/e1406#BIBL
This article cites 50 articles, 15 of which you can access for free at:
Subspecialty Collections
http://www.aappublications.org/cgi/collection/nutrition_sub
Nutrition
following collection(s):
This article, along with others on similar topics, appears in the
Permissions & Licensing
http://www.aappublications.org/site/misc/Permissions.xhtml
in its entirety can be found online at:
Information about reproducing this article in parts (figures, tables) or
Reprints
http://www.aappublications.org/site/misc/reprints.xhtml
DOI: 10.1542/peds.2006-0097
2006;118;e1406
Pediatrics
James M. Robbins, Janice E. Stuff and Judith Weber
Catherine M. Champagne, Carol Connell, David Harsha, Beverly McCabe-Sellers,
Patrick H. Casey, Pippa M. Simpson, Jeffrey M. Gossett, Margaret L. Bogle,
Overweight Status
The Association of Child and Household Food Insecurity With Childhood
http://pediatrics.aappublications.org/content/118/5/e1406
located on the World Wide Web at:
The online version of this article, along with updated information and services, is
by the American Academy of Pediatrics. All rights reserved. Print ISSN: 1073-0397.