A 4-Year Exercise Program in Children Increases Bone
Mass Without Increasing Fracture Risk
WHAT’S KNOWN ON THIS SUBJECT: Observation studies and short-term prospective intervention studies have shown that physical activity positively affects the accrual of bone mass and size during growth; however, fracture risk has not been evaluated.
WHAT THIS STUDY ADDS: This study reports the long-term results of a prospective intervention with increased physical activity at a population-based level and for thefirst time evaluated the clinical relevant end point, fracture risk.
abstract
BACKGROUND:Most prospective pediatric exercise intervention stud-ies cover ,1 year and use bone traits as surrogate end points for fractures. This prospective controlled exercise intervention study there-fore followed not only skeletal development but also fracture incidence for 4 years.
METHODS:Fractures were prospectively registered in a cohort of chil-dren aged 7 to 9 years, 446 boys and 362 girls in the intervention group (2675 person-years) and 807 boys and 780 girls in the control group (5661 person-years). The intervention included 40 minutes per day of school physical education for 4 years whereas the controls had 60 minutes per week. In a subsample, 73 boys and 48 girls in the intervention and 52 boys and 48 girls in the control group, bone mineral content (g) and bone width (cm) were followed by means of dual-energy radiograph absorptiometry.
RESULTS: The rate ratio for fractures was 1.11. In the dual-energy radiograph absorptiometry–measured children, there were no group differences at baseline in age, anthropometrics, or bone traits. The mean annual gain in lumbar spine bone mineral content was 7.0% higher in girls and 3.3% higher in boys and in femoral neck width 1.7% higher in girls and 0.6% higher in boys in the intervention than in the control group.
CONCLUSIONS:A population-based moderately intense 4-year exercise program in 7- to 9-year-old children increased bone mass and size without affecting the fracture risk.Pediatrics2012;129:e1468–e1476
AUTHORS:Bjarne Löfgren, MD,a,bMagnus Dencker, PhD,a,c
Jan-Åke Nilsson, PhD,a,band Magnus K. Karlsson, PhDa,b
aClinical and Molecular Osteoporosis Research Unit, Department
of Clinical Sciences, Lund University, Lund, Sweden;bDepartment
of Orthopedics, Skåne University Hospital, Malmö, Sweden; and
cDepartment of Clinical Physiology, Skåne University Hospital,
Malmö, Sweden
KEY WORDS
BMC, bone mineral content, bone size, boys, children, controlled, exercise, fracture, girls, growth, physical activity, prospective
ABBREVIATIONS
BMC—bone mineral content CI—confidence interval
DXA—dual-energy radiograph absorptiometry FN—femoral neck
HSA—hip structural analysis LS—lumbar spine Z—section modulus
Dr Löfgren was involved in the statistical analysis, the interpretation of data, and the writing of the article; Dr Dencker collected and analyzed the accelerometer data; Dr Nilsson was involved in the statistical analysis; and Dr Karlsson designed the study, worked with the analysis, and was in charge of writing the article. All authors read and approved thefinal manuscript.
This trial has been registered at www.clinicaltrials.gov (identifier NCT00633828).
www.pediatrics.org/cgi/doi/10.1542/peds.2011-2274
doi:10.1542/peds.2011-2274
Accepted for publication Feb 2, 2012
Address correspondence to Bjarne Löfgren, MD, Department of Orthopedics, Skåne University Hospital, SE-205 02 Malmö, Sweden. E-mail: [email protected]
PEDIATRICS (ISSN Numbers: Print, 0031-4005; Online, 1098-4275).
Copyright © 2012 by the American Academy of Pediatrics
FINANCIAL DISCLOSURE:The authors have indicated they have nofinancial relationships relevant to this article to disclose.
High physical activity induces anabolic skeletal effects, as does moderate ac-tivity during growth.1–10The most
os-teogenic activities include fast dynamic loads with high magnitude and high frequency, whereas endurance activi-ties are less effective.11,12 Physical
ac-tivity during growth is also associated with high peak bone mass, and half of the variance in bone mass at age 70 is estimated to be predicted by peak bone mass.13Because low bone mass in old
age is associated with high fracture risk, exercise during growth ought hypotheti-cally to be used as prophylaxis against osteoporosis and fragility fractures.14
The pre- and early peripubertal years are the ideal period for exercise be-cause mechanical load preferentially affects surfaces of bone that is un-dergoing fast apposition.15This is
sup-ported by studies showing that the same type of exercise confers benefit before but not after puberty.2–10,15,16
Cited studies have used bone mineral content (BMC) as the primary end-point variables, have predominantly included volunteers, had specific pro-grams designed to be osteogenic, and all but 3 studies used a follow-up of#1 year.5,6,8,10,16 It is debated, however,
whether skeletal benefits are achieved with general training on a population-based level and retained with longer interventions. In addition, bone mass is only a surrogate end point for the clinically relevant entity of fractures. Low bone mass in both adults and children is associated with high frac-ture risk; however, there is no causal relationship.17–19 For example, the
fracture incidence is higher in athletes with higher than average bone mass and also in children with high physical activity levels.20The aim of this study
was therefore to evaluate whether an extended exercise intervention program in children could produce long-term skeletal benefits without increasing the fracture incidence.
METHODS
The Malmö Pediatric Osteoporosis Pre-vention Study is a population-based, nonrandomized, prospective, controlled exercise intervention study following skeletal development and fracture in-cidence in 7- to 9-year-old children. The study design has previously been re-ported in detail.7–10In summary, 4
neigh-boring elementary schools that were government-funded, with the children allocated to the school according to their residential address and with a standard curriculum of physical educa-tion accepted participaeduca-tion in the study. One school was chosen as intervention school. The intervention included daily school physical education (200 minutes per week), whereas the control group continued with 60 minutes given in 1 or 2 lessons per week. Lessons were led by ordinary teachers and included general activities such as ball games, running, jumping, and climbing.
For the fracture epidemiologic evalu-ation, all school children from the 4 schools were included (100%) because physical education is a compulsory school subject and fractures were objectively registered through the archives of the city hospital, not through the question-naires. Fractures were prospectively registered in 446 boys and 362 girls in the intervention group and 807 boys and 780 girls in the control group. There is 1 hospital in the city, so virtually all fracture patients attend the hospital, with the classification system validated during 4 decades.21Previous evaluations
have reported that,3% of all fractures in the target population are missed by this system.21One person followed for
1 year equaled 1 person-year.
From the target population, a subcohort of children was invited for measure-ments of anthropometrics and skeletal traits before intervention and then annually in the same month for a period of 4 years.7,9Children with diseases or
medication known to influence bone
metabolism were excluded. At base-line, 55 of 61 girls and 84 of 89 boys agreed to participate in the interven-tion school. One girl was excluded be-cause she was 11 months younger than all the rest. During the 4-year follow-up period, 6 girls and 8 boys moved out of the region or declined additional par-ticipation. Two boys were excluded be-cause they were taking medication known to influence bone metabolism, leaving 48 girls with a baseline mean age of 7.760.6 (range 6.5–8.7) and 73 boys with a mean age of 7.8 6 0.6 (range 6.7–8.7) to be included in the intervention group with measure-ments done. Sixty-four of 158 girls and 68 of 169 boys accepted participation in the control schools. At follow-up, 15 girls and 13 boys had moved out of the region or declined additional partici-pation, 1 girl and 2 boys were excluded because they were taking medication known to influence bone metabolism, and 1 boy adopted from Colombia was excluded as being the only non-Caucasian, leaving 48 girls with a base-line mean age of 7.9 6 0.6 (range 6.8–8.9) and 52 boys with a mean age of 8.060.6 (range 6.7–8.9) in the control group on whom measurements were performed. The risk of selection bias seems minimal because there were no differences in anthropometrics or bone traits between children within the schools before the intervention or between the children that partici-pated throughout the study and the dropouts.7,9 Nor were there any
dif-ferences in height, weight, or BMI when data from the grade 1 compulsory school health examination were analyzed to compare the children who participated with those who refused.8,10
about time spent in organized leisure time sports activity. Total duration of physical activity was estimated as du-ration of school physical education and organized leisure time activity per week and mean value during the 4 years calculated.7–10Pubertal maturity was
as-certained by self-assessment of Tanner staging.22 Measurements were
con-ducted annually for 4 years. Body weight and height were measured by standard equipment. BMC (g) was measured by dual-energy radiograph absorptiometry (DXA; DPX-L version 1.3z, Lunar, Madison, WI) in total body, lumbar spine (LS), fem-oral neck (FN), and trochanter.7–10The
width of the third lumbar vertebra and the FN were evaluated at the LS and hip scans.7,9The hip structural analysis (HSA)
software, provided by Lunar Instruments Corporation (Madison, WI), was applied to the hip scan as an evaluation of FN cross-sectional area (cm2), section mod-ulus (Z; cm3), and cross-sectional mo-ment of inertia (cm4).8,10 The method
introduced by Beck et al, excluding bi-ologically unlikely values, 3 SD beyond the mean, was advocated, resulting in the exclusion of 46 of the 1005 HSA analyses.23Total body fat mass and total
body lean mass were measured by total body scans. Our research technicians calibrated the machine daily with the Lunar phantom, and they performed measurements and software analyses. The coefficients of variation, evaluated by duplicate measurements in 13 healthy children was BMC 1.4% to 3.8%, bone width 1.5% to 2.2%, FN cross-sectional area 2.2%, FN Z 6.2%, FN cross-sectional moment of inertia 6.2%, total body fat mass 3.7%, and total body lean mass 1.5%.
Physical activity after 2 years was ob-jectively measured by accelerometers (model 7164 MTI; Manufacturing Tech-nology Inc, Fort Walton Beach, FL) on 4 consecutive days with methodology described previously.10 Mean activity
was defined as the total accelerometer cpm of monitoring, moderate-to-vigorous
physical activity as time spent.3 met-abolic equivalents and vigorous physi-cal activity as time spent.6 metabolic equivalents. Cutoff points used for all children were.1000 cpm for moderate-to-vigorous physical activity and.3500 cpm for vigorous physical activity.8,10
Activity .5000, 6000, and 10 000 cpm was also registered to capture the most intense activities, known to be osteogenic.11,12
Informed written consent was obtained from parents or guardians of the par-ticipants, and the Lund University Ethics Committee (LU 453-98; 1998-09-15) ap-proved the study. Data are presented as mean6SD or mean with 95% confi -dence interval (CI). Gender-specific base-line group differences were tested by Student’sttest and Fisher exact test. The annual changes of all parameters were calculated by using linear regression slopes for each individual and group difference in annual changes by analysis of covariance with adjustment for Tanner stage at follow-up. All children were then divided into tertiles according to physical activity, and tertile differences were tested by analysis of variance. Fracture risk with 95% CI was estimated by Pois-son distribution.P,.05 was regarded as a statistically significant difference.
RESULTS
There were 148 fractures during the study period: 30 hand, 64 distal forearm,
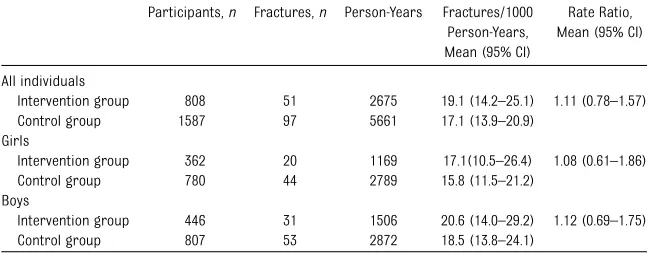
9 mid-forearm, 21 humerus, 6 clavicula, 5 tibia, 5 ankle, 6 foot, 1 spine, and 1 pelvis. In the intervention group, there were 51 fractures (19.1 events/1000 person-years), and in the control group 97 (17.1 events/1000 person-years), leading to a rate ratio of 1.11 (0.78–1.57), with no gender difference (Table 1, Fig 1). In 79 cases (53%), the fractures were the result of a slight trauma, in 51 cases (34%), a moderate trauma; and in 2 cases (1%), a high-energy trauma. In 16 cases (11%), there was no information about trauma mechanism. There were no differences in the trauma energy that caused the fracture between the intervention and the control group in either boys or girls (all P . .3, re-spectively; data not shown). In addition, we found no cases of stress fractures.
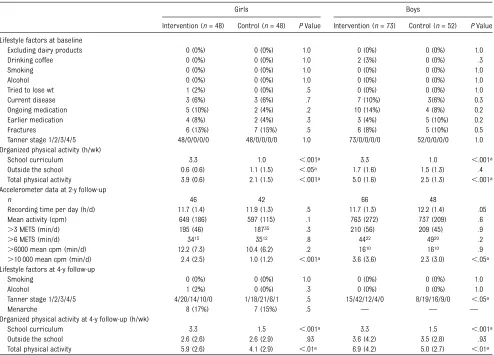
In the measured children, the only dif-ference in anthropometrics, bone pa-rameters, and lifestyle was a higher duration of physical activity in the in-tervention groups (Tables 2 and 3). All children were at Tanner stage 1 at base-line, whereas at follow-up, more boys in the control group had higher Tanner stages (Table 2). The accelerometer data showed that girls and boys in the intervention group had more intense activities than children in the control group (Table 2).
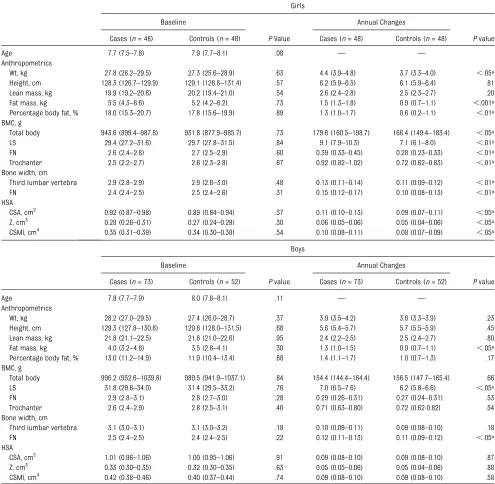
The mean annual gain in BMC during the study period in the girls in the in-tervention group was 7.0% higher in the
TABLE 1 Fracture Epidemiology in Children in the Exercise Intervention Group and the Control Group
Participants,n Fractures,n Person-Years Fractures/1000 Person-Years, Mean (95% CI)
Rate Ratio, Mean (95% CI)
All individuals
Intervention group 808 51 2675 19.1 (14.2–25.1) 1.11 (0.78–1.57)
Control group 1587 97 5661 17.1 (13.9–20.9)
Girls
Intervention group 362 20 1169 17.1(10.5–26.4) 1.08 (0.61–1.86)
Control group 780 44 2789 15.8 (11.5–21.2)
Boys
Intervention group 446 31 1506 20.6 (14.0–29.2) 1.12 (0.69–1.75)
Control group 807 53 2872 18.5 (13.8–24.1)
LS and 4.1% higher in FN bone mineral content (bothP,.01), 8.7% higher in the trochanter and in bone width, 1.7% higher in the FN width, and 0.7% higher in the third lumbar vertebra width (all
P,.05) than in the control group (Table 3). The mean annual gain in BMC in the boys in the intervention group was 3.3% higher in the LS and the mean gain in FN width was 0.6% higher (bothP,.05) than in the control group (Table 3).
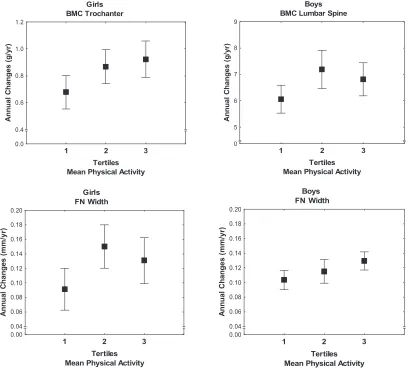
When the children were divided into tertiles of physical activity according to the questionnaires, there was a dose-response effect between duration of physical activity and annual gain in BMC and bone width. In girls, there was a gradually higher gain in FN BMC, trochanter BMC, and FN width (allP,
.05) with each tertile of higher duration of physical activity, and the same pat-tern was found in boys, reaching sig-nificance in the LS BMC (P,.05) and in FN width (P,.05; Fig 2).
DISCUSSION
This study should not be misinterpreted as another study confirming that os-teogenic training in motivated children improves bone mass.2–6 The study
in-stead adds knowledge when reporting that a moderately intense, general ex-ercise intervention program in the peripubertal to pubertal years could improve bone mass and size on a pop-ulation level, without increasing the fracture risk previously suggested to occur with high levels of physical activity in adults and children.18,20,24,25The
re-ported dose-response effects strengthen a causal relationship between duration of exercise and gain in bone mass and size, visualized through the tertile com-parison (Fig 2). The current study is also the longest reported intervention study, supporting the beneficial exercise-induced effects with shorter interven-tion.2–10Thefinding that beneficial effects
remain with long intervention into the
pubertal growth spurt increases the probability that the intervention will improve peak bone mass.26
It is also interesting that not only bone mass but also bone size increased be-cause bone structure contributes to bone resistance to fracture, indepen-dently of bone mass.27–29 This is of
clinical significance, because women with spine fractures have smaller lumbar vertebrae but normal FN size, whereas women with hip fractures have normal vertebral body size but smaller FN size than nonfractured controls.28
Further-more, our findings are supported by several previous reports that use the unilateral loading model in racquet players, a model of loading that is not affected by genetic, nutritional, or en-docrine factors because both arms pertain to the same person but only the dominant arm is loaded during the ex-ercise sessions, a model that convinc-ingly shows increased BMC and bone size in the dominant and the mechan-ically loaded arm.15,30–32
An unexpectedfinding in our study was the greater annual gain in fat mass in the intervention group compared with the controls (Table 3). This is contra-dictory to several previously published pediatric exercise reports,2,5,33but there
are also previous studies that have reported similarfindings to those in the current study.7,9,34,35The reason for the
higher gain in fat in the intervention group is unclear but could possibly be due to increased appetite and food intake accompanying the increased training. Although we did not assess dietary habits, previous studies have speculated that the increased gain in fat is most likely the result of other influences besides physical activity be-cause there has been no dose-response association between level of physical activity and gain in fat mass.34Thefi
nd-ing may also be the result of chance.
The gender differences in the exercise response could be due to boys in
FIGURE 1
general being more physically active than girls outside school, and as a con-sequence, the extra physical education in school contributed less to the total physical activity in boys than in girls. Another possible explanation for the gender differences is that the girls were more advanced in pubertal maturation than the boys because it is generally believed that the late pre- and early peripubertal period is the one during which skeletal response to exercise is the most beneficial.15,30–32,36
Some previous studies have suggested that low-impact endurance sports such as bicycling and swimming in adults have a negative effect on BMC and a
decrease in bone strength especially when these types of exercises are prac-ticed at high volume.37–39However, the
level of exercise in the intervention group was of a moderate intensity so that all students could participate, and there was a variety of activities so that the pupils were exposed to both high- and low-impact exercise and both intensive and endurance activities.
There is also an ongoing discussion about which regions should be included in pediatric exercise studies. The In-ternational Society for Clinical Densi-tometry position statement is that spine and total body less head are the most accurate and reproducible
skeletal sites for DXA measurements in children.40Total body BMC in our study
showed a higher annual increase in girls in the intervention than in the control group but not in boys. There could, how-ever, be a problem if only total body is used as the end-point variable because total body includes both mechanically unloaded and loaded skeletal sites. There-fore, we also included specific mea-surements of weight-loaded regions such as the hip and LS, the 2 most frequently used methods in clinical practice.
Finally, there are reports inferring that vigorous physical activity increases frac-ture risk in both children and adults caused by more exposure to trauma.18,20,24 TABLE 2 Lifestyle Factors at Baseline and Follow-up and Accelerometer Data Collected After 2 Years in the Subsample of Children Who Were Selected
For Measurements
Girls Boys
Intervention (n= 48) Control (n= 48) PValue Intervention (n= 73) Control (n= 52) PValue
Lifestyle factors at baseline
Excluding dairy products 0 (0%) 0 (0%) 1.0 0 (0%) 0 (0%) 1.0
Drinking coffee 0 (0%) 0 (0%) 1.0 2 (3%) 0 (0%) .3
Smoking 0 (0%) 0 (0%) 1.0 0 (0%) 0 (0%) 1.0
Alcohol 0 (0%) 0 (0%) 1.0 0 (0%) 0 (0%) 1.0
Tried to lose wt 1 (2%) 0 (0%) .5 0 (0%) 0 (0%) 1.0
Current disease 3 (6%) 3 (6%) .7 7 (10%) 3(6%) 0.3
Ongoing medication 5 (10%) 2 (4%) .2 10 (14%) 4 (8%) 0.2
Earlier medication 4 (8%) 2 (4%) .3 3 (4%) 5 (10%) 0.2
Fractures 6 (13%) 7 (15%) .5 6 (8%) 5 (10%) 0.5
Tanner stage 1/2/3/4/5 48/0/0/0/0 48/0/0/0/0 1.0 73/0/0/0/0 52/0/0/0/0 1.0
Organized physical activity (h/wk)
School curriculum 3.3 1.0 ,.001a 3.3 1.0 ,.001a
Outside the school 0.6 (0.6) 1.1 (1.5) ,.05a 1.7 (1.6) 1.5 (1.3) .4
Total physical activity 3.9 (0.6) 2.1 (1.5) ,.001a 5.0 (1.6) 2.5 (1.3) ,.001a
Accelerometer data at 2-y follow-up
n 46 42 66 48
Recording time per day (h/d) 11.7 (1.4) 11.9 (1.3) .5 11.7 (1.3) 12.2 (1.4) .05
Mean activity (cpm) 649 (186) 597 (115) .1 763 (272) 737 (209) .6
.3 METS (min/d) 195 (46) 18735 .3 210 (56) 209 (45) .9
.6 METS (min/d) 3415 3512 .8 4422 4920 .2
.6000 mean cpm (min/d) 12.2 (7.3) 10.4 (6.2) .2 1610 1610 .9
.10 000 mean cpm (min/d) 2.4 (2.5) 1.0 (1.2) ,.001a 3.6 (3.6) 2.3 (3.0) ,.05a
Lifestyle factors at 4-y follow-up
Smoking 0 (0%) 0 (0%) 1.0 0 (0%) 0 (0%) 1.0
Alcohol 1 (2%) 0 (0%) .3 0 (0%) 0 (0%) 1.0
Tanner stage 1/2/3/4/5 4/20/14/10/0 1/18/21/6/1 .5 15/42/12/4/0 8/19/16/9/0 ,.05a
Menarche 8 (17%) 7 (15%) .5 — — —
Organized physical activity at 4-y follow-up (h/wk)
School curriculum 3.3 1.5 ,.001a 3.3 1.5 ,.001a
Outside the school 2.6 (2.6) 2.6 (2.9) .93 3.6 (4.2) 3.5 (2.8) .93
Total physical activity 5.9 (2.6) 4.1 (2.9) ,.01a 6.9 (4.2) 5.0 (2.7) ,.01a
The baseline measurements were performed just before the intervention was initiated and then annually for 4 years. Questionnaire-evaluated duration of organized physical activity was estimated as hours per week. Accelerometer-measured level of physical activity is presented as minutes per day.3 or.6 metabolic equivalents (METS) or.6000 or.10 000 cpm. Data are presented as number of children with proportion (%) or as mean (SD).
Before exercise intervention programs can be recommended, it must there-fore be shown that the intervention does not result in more fractures. This study refutes this hypothesis, at least with the power to conclude that there was no fracture reduction of.22% or an increase of more than 57%. However,
the contradictory hypothesis sup-ported by others, that higher BMC in physically active children would result in fewer fractures, was also refuted.41
The third possibility is that the exercise would lead to more traumas but the higher BMC protects against fracture, leading to no different fracture incidence
in the intervention and the control groups. Thefindings of no increased fracture rate is important because most epidemiologic reports infer that 25% to 50% of all children will sustain a fracture during growth.42,43
Weaknesses include the power prob-lem, so that despite including 2395
TABLE 3 Baseline Data and Annual Changes in the Subsample of Girls and Boys Who Were Chosen for Measurements, Presented as Absolute Values, Evaluating the Effect of 4 Years of Exercise Intervention in Anthropometry, Bone Mineral Parameters, Bone Size, and HSA in the Exercise Intervention Group and the Control Group
Girls
Baseline Annual Changes
Cases (n= 48) Controls (n= 48) PValue Cases (n= 48) Controls (n= 48) Pvalue
Age 7.7 (7.5–7.8) 7.9 (7.7–8.1) .08 — —
Anthropometrics
Wt, kg 27.8 (26.2–29.5) 27.3 (25.6–28.9) .63 4.4 (3.9–4.8) 3.7 (3.3–4.0) ,.05a
Height, cm 128.3 (126.7–129.9) 129.1 (126.8–131.4) .57 6.2 (5.9–6.5) 6.1 (5.9–6.4) .81 Lean mass, kg 19.9 (19.2–20.6) 20.2 (19.4–21.0) .54 2.6 (2.4–2.8) 2.5 (2.3–2.7) .20 Fat mass, kg 5.5 (4.3–6.6) 5.2 (4.2–6.2) .73 1.5 (1.3–1.8) 0.9 (0.7–1.1) ,.001a
Percentage body fat, % 18.0 (15.3–20.7) 17.8 (15.6–19.9) .89 1.3 (1.0–1.7) 0.6 (0.2–1.1) ,.01a
BMC, g
Total body 943.6 (899.4–987.8) 931.8 (877.9–985.7) .73 179.6 (160.5–198.7) 166.4 (149.4–183.4) ,.05a
LS 29.4 (27.2–31.6) 29.7 (27.8–31.5) .84 9.1 (7.9–10.3) 7.1 (6.1–8.0) ,.01a
FN 2.6 (2.4–2.8) 2.7 (2.5–2.9) .60 0.39 (0.33–0.45) 0.28 (0.23–0.33) ,.01a
Trochanter 2.5 (2.2–2.7) 2.6 (2.3–2.8) .67 0.92 (0.82–1.02) 0.72 (0.62–0.83) ,.01a
Bone width, cm
Third lumbar vertebra 2.9 (2.8–2.9) 2.9 (2.8–3.0) .48 0.13 (0.11–0.14) 0.11 (0.09–0.12) ,.01a
FN 2.4 (2.4–2.5) 2.5 (2.4–2.6) .31 0.15 (0.12–0.17) 0.10 (0.08–0.13) ,.01a
HSA
CSA, cm2 0.92 (0.87–0.98) 0.89 (0.84–0.94) .37 0.11 (0.10–0.13) 0.09 (0.07–0.11) ,.05a
Z, cm3 0.28 (0.26–0.31) 0.27 (0.24–0.29) .30 0.06 (0.05–0.06) 0.05 (0.04–0.06) ,.05a
CSMI, cm4 0.35 (0.31–0.39) 0.34 (0.30–0.38) .54 0.10 (0.08–0.11) 0.08 (0.07–0.09) ,.05a
Boys
Baseline Annual Changes
Cases (n= 73) Controls (n= 52) Pvalue Cases (n= 73) Controls (n= 52) Pvalue
Age 7.8 (7.7–7.9) 8.0 (7.8–8.1) .11 — —
Anthropometrics
Wt, kg 28.2 (27.0–29.5) 27.4 (26.0–28.7) .37 3.9 (3.5–4.2) 3.6 (3.3–3.9) .23
Height, cm 129.3 (127.8–130.8) 129.8 (128.0–131.5) .68 5.6 (5.4–5.7) 5.7 (5.5–5.9) .45 Lean mass, kg 21.8 (21.1–22.5) 21.8 (21.0–22.6) .95 2.4 (2.2–2.5) 2.5 (2.4–2.7) .80 Fat mass, kg 4.0 (3.2–4.8) 3.5 (2.8–4.1) .30 1.3 (1.0–1.5) 0.9 (0.7–1.1) ,.05a
Percentage body fat, % 13.0 (11.2–14.9) 11.9 (10.4–13.4) .88 1.4 (1.1–1.7) 1.0 (0.7–1.3) .17 BMC, g
Total body 996.2 (952.6–1039.8) 989.5 (941.9–1037.1) .84 154.4 (144.4–164.4) 156.5 (147.7–165.4) .66
LS 31.8 (29.6–34.0) 31.4 (29.5–33.2) .76 7.0 (6.5–7.6) 6.2 (5.8–6.6) ,.05a
FN 2.9 (2.8–3.1) 2.8 (2.7–3.0) .28 0.29 (0.26–0.31) 0.27 (0.24–0.31) .53
Trochanter 2.6 (2.4–2.9) 2.8 (2.5–3.1) .40 0.71 (0.63–0.80) 0.72 (0.62-0.82) .54 Bone width, cm
Third lumbar vertebra 3.1 (3.0–3.1) 3.1 (3.0–3.2) .18 0.10 (0.09–0.11) 0.09 (0.08–0.10) .18
FN 2.5 (2.4–2.5) 2.4 (2.4–2.5) .22 0.12 (0.11–0.13) 0.11 (0.09–0.12) ,.05a
HSA
CSA, cm2 1.01 (0.96–1.06) 1.00 (0.95–1.06) .91 0.09 (0.08–0.10) 0.09 (0.08–0.10) .87 Z, cm3 0.33 (0.30–0.35) 0.32 (0.30–0.35) .63 0.05 (0.05–0.06) 0.05 (0.04–0.06) .88 CSMI, cm4 0.42 (0.38–0.46) 0.40 (0.37–0.44) .74 0.09 (0.08–0.10) 0.09 (0.08–0.10) .58
Data are presented as unadjusted means (95% CI). Group comparisons are adjusted for Tanner stage at follow-up. CSA, cross-sectional area; CSMI, cross-sectional moment of inertia.
children and a 4-year follow-up period, we could not capture small group dif-ferences in fracture incidence and the data only let us state that there was at least no fracture reduction of .22% and no fracture increase of.57% in the intervention group. An individual randomization would also have been preferable but impossible to conduct because of resistance from parents, pupils, and teachers.7–10Furthermore,
the participation rate in the control schools regarding children invited for measurements was lower than in the intervention school. This may have in-creased the risk of self-selection bias at baseline. However, this risk must be regarded as minor because no
differences between groups were seen at baseline in anthropometrics, bone parameters, ethnicity, registered life-style factors, or participation in orga-nized sport activities. Also, as previously reported, no differences were seen in height, weight, or BMI between partic-ipants and nonparticpartic-ipants in the invited cohort, according to an examination of data from the first health examination in school.7–10Also, it would have been
preferable to have the bone structure estimated by 3-dimensional techniques such as computed tomography and not a 2-dimensional method such as DXA and HSA. Regarding the fracture data, it would have been advantageous if the fracture incidents could have been
divided into fractures occurring during physical education classes in school and fractures occurring during other activities. However, from the refer-rals and the reports, we could in most cases onlyfind out the type of trauma but not whether the accident had hap-pened during school classes or spare time.
CONCLUSIONS
The study shows that a general, mod-erately intense school-based exercise intervention program for 4 years in children who were prepubertal at study start improves bone mass and bone size without increasing the fracture
FIGURE 2
risk. Daily moderate physical activity ought to be initiated in prepubertal children and then continue into puberty
as a strategy for population-based improvement of bone resistance to fracture.
ACKNOWLEDGMENTS
We thank the teachers and the students for help with the study.
REFERENCES
1. Hind K, Burrows M. Weight-bearing exer-cise and bone mineral accrual in children and adolescents: a review of controlled trials.Bone. 2007;40(1):14–27
2. Bradney M, Pearce G, Naughton G, et al. Moderate exercise during growth in pre-pubertal boys: changes in bone mass, size, volumetric density, and bone strength: a con-trolled prospective study.J Bone Miner Res. 1998;13(12):1814–1821
3. McKay HA, Petit MA, Schutz RW, Prior JC, Barr SI, Khan KM. Augmented trochanteric bone mineral density after modified physical education classes: a randomized school-based exercise intervention study in pre-pubescent and early pre-pubescent children.
J Pediatr. 2000;136(2):156–162
4. Petit MA, McKay HA, MacKelvie KJ, Heinonen A, Khan KM, Beck TJ. A randomized school-based jumping intervention confers site and maturity-specific benefits on bone structural properties in girls: a hip struc-tural analysis study. J Bone Miner Res. 2002;17(3):363–372
5. MacKelvie KJ, Khan KM, Petit MA, Janssen PA, McKay HA. A school-based exercise in-tervention elicits substantial bone health benefits: a 2-year randomized controlled trial in girls.Pediatrics. 2003;112(6). Avail-able at: www.pediatrics.org/cgi/content/full/ 112/6/e447
6. MacKelvie KJ, Petit MA, Khan KM, Beck TJ, McKay HA. Bone mass and structure are enhanced following a 2-year randomized controlled trial of exercise in prepubertal boys.Bone. 2004;34(4):755–764
7. Lindén C, Alwis G, Ahlborg H, et al. Exercise, bone mass and bone size in prepubertal boys: one-year data from the pediatric os-teoporosis prevention study.Scand J Med Sci Sports. 2007;17(4):340–347
8. Linden C, Ahlborg HG, Besjakov J, Gardsell P, Karlsson MK. A school curriculum-based exercise program increases bone mineral accrual and bone size in prepubertal girls: two-year data from the pediatric osteopo-rosis prevention (POP) study.J Bone Miner Res. 2006;21(6):829–835
9. Valdimarsson O, Linden C, Johnell O, Gardsell P, Karlsson MK. Daily physical ed-ucation in the school curriculum in pre-pubertal girls during 1 year is followed by
an increase in bone mineral accrual and bone width—data from the prospective controlled Malmö pediatric osteoporosis prevention study.Calcif Tissue Int. 2006;78 (2):65–71
10. Alwis G, Linden C, Ahlborg HG, Dencker M, Gardsell P, Karlsson MK. A 2-year school-based exercise programme in pre-pubertal boys induces skeletal benefits in lumbar spine.
Acta Paediatr. 2008;97(11):1564–1571 11. Lanyon LE. Control of bone architecture by
functional load bearing.J Bone Miner Res. 1992;7(suppl 2):S369–S375
12. Rubin CT, Lanyon LE. Regulation of bone formation by applied dynamic loads.J Bone Joint Surg Am. 1984;66(3):397–402 13. Hui SL, Slemenda CW, Johnston CC Jr. The
contribution of bone loss to postmenopausal osteoporosis.Osteoporos Int. 1990;1(1):30–34 14. Melton LJ III, Atkinson EJ, O’Fallon WM, Wahner HW, Riggs BL. Long-term fracture prediction by bone mineral assessed at different skeletal sites.J Bone Miner Res. 1993;8(10):1227–1233
15. Kannus P, Haapasalo H, Sankelo M, et al. Effect of starting age of physical activity on bone mass in the dominant arm of tennis and squash players.Ann Intern Med. 1995; 123(1):27–31
16. Hasselstrøm HA, Karlsson MK, Hansen SE, Grønfeldt V, Froberg K, Andersen LB. A 3-year physical activity intervention program increases the gain in bone mineral and bone width in prepubertal girls but not boys: the prospective Copenhagen School Child Interventions Study (CoSCIS). Calcif Tissue Int. 2008;83(4):243–250
17. Johnell O, Gullberg B, Kanis JA, et al. Risk factors for hip fracture in European women: the MEDOS Study. Mediterranean Osteopo-rosis Study.J Bone Miner Res. 1995;10(11): 1802–1815
18. Clark EM, Ness AR, Tobias JH. Bone fragility contributes to the risk of fracture in chil-dren, even after moderate and severe trauma.
J Bone Miner Res. 2008;23(2):173–179 19. Clark EM, Tobias JH, Ness AR. Association
between bone density and fractures in children: a systematic review and meta-analysis. Pediatrics. 2006;117(2). Available at: www.pediatrics.org/cgi/content/full/117/ 2/e291
20. Clark EM, Ness AR, Tobias JH. Vigorous physical activity increases fracture risk in children irrespective of bone mass: a prospective study of the independent risk factors for fractures in healthy chil-dren.J Bone Miner Res. 2008;23(7):1012– 1022
21. Jónsson B, Gärdsell P, Johnell O, Redlund-Johnell I, Sernbo I. Remembering fractures: fracture registration and proband recall in southern Sweden.J Epidemiol Community Health. 1994;48(5):489–490
22. Duke PM, Litt IF, Gross RT. Adolescents’ self-assessment of sexual maturation. Pediat-rics. 1980;66(6):918–920
23. Beck TJ, Oreskovic TL, Stone KL, et al. Structural adaptation to changing skeletal load in the progression toward hip fragility: the study of osteoporotic fractures.J Bone Miner Res. 2001;16(6):1108–1119
24. Karlsson MK, Linden C, Karlsson C, Johnell O, Obrant K, Seeman E. Exercise during growth and bone mineral density and fractures in old age.Lancet. 2000;355(9202):469–470 25. Nordström A, Karlsson C, Nyquist F, Olsson
T, Nordström P, Karlsson M. Bone loss and fracture risk after reduced physical activ-ity.J Bone Miner Res. 2005;20(2):202–207 26. Mora S, Gilsanz V. Establishment of peak
bone mass. Endocrinol Metab Clin North Am. 2003;32(1):39–63
27. Ahlborg HG, Johnell O, Turner CH, Rannevik G, Karlsson MK. Bone loss and bone size after menopause.N Engl J Med. 2003;349(4): 327–334
28. Duan Y, Parfitt A, Seeman E. Vertebral bone mass, size, and volumetric density in women with spinal fractures.J Bone Miner Res. 1999;14(10):1796–1802
29. Duan Y, Seeman E, Turner CH. The bio-mechanical basis of vertebral body fragility in men and women. J Bone Miner Res. 2001;16(12):2276–2283
30. Bass SL, Saxon L, Daly RM, et al. The effect of mechanical loading on the size and shape of bone in pre-, peri-, and post-pubertal girls: a study in tennis players.
J Bone Miner Res. 2002;17(12):2274–2280 31. Sanchis-Moysi J, Dorado C, Olmedillas H,
32. Sanchis-Moysi J, Dorado C, Olmedillas H, Serrano-Sanchez JA, Calbet JA. Bone and lean mass inter-arm asymmetries in young male tennis players depend on training frequency.
Eur J Appl Physiol. 2010;110(1):83–90 33. Dencker M, Thorsson O, Karlsson MK, et al.
Daily physical activity related to body fat in children aged 8–11 years.J Pediatr. 2006; 149(1):38–42
34. Stenevi-Lundgren S, Daly RM, Lindén C, Gärdsell P, Karlsson MK. Effects of a daily school based physical activity intervention program on muscle development in pre-pubertal girls.Eur J Appl Physiol. 2009;105(4): 533–541
35. Treuth MS, Hunter GR, Figueroa-Colon R, Goran MI. Effects of strength training on intra-abdominal adipose tissue in obese prepubertal girls. Med Sci Sports Exerc. 1998;30(12):1738–1743
36. Vicente-Rodriguez G, Ara I, Perez-Gomez J, Serrano-Sanchez JA, Dorado C, Calbet JA. High femoral bone mineral density accre-tion in prepubertal soccer players.Med Sci Sports Exerc. 2004;36(10):1789–1795 37. Guadalupe-Grau A, Fuentes T, Guerra B, Calbet
JA. Exercise and bone mass in adults.
Sports Med. 2009;39(6):439–468 38. Heinonen A, Oja P, Kannus P, et al. Bone
mineral density in female athletes repre-senting sports with different loading char-acteristics of the skeleton.Bone. 1995;17(3): 197–203
39. Nikander R, Sievänen H, Heinonen A, Kannus P. Femoral neck structure in adult female athletes subjected to different loading modalities.J Bone Miner Res. 2005;20(3): 520–528
40. Bianchi ML, Baim S, Bishop NJ, et al. Official positions of the International Society for
Clinical Densitometry (ISCD) on DXA evalu-ation in children and adolescents. Pediatr Nephrol. 2010;25(1):37–47
41. Manias K, McCabe D, Bishop N. Fractures and recurrent fractures in children; varying effects of environmental factors as well as bone size and mass.Bone. 2006;39(3): 652–657
42. Cooper C, Dennison EM, Leufkens HG, Bishop N, van Staa TP. Epidemiology of childhood fractures in Britain: a study using the general practice research da-tabase.J Bone Miner Res. 2004;19(12):1976– 1981
DOI: 10.1542/peds.2011-2274 originally published online May 28, 2012;
2012;129;e1468
Pediatrics
Bjarne Löfgren, Magnus Dencker, Jan-Åke Nilsson and Magnus K. Karlsson
Services
Updated Information &
http://pediatrics.aappublications.org/content/129/6/e1468 including high resolution figures, can be found at:
References
http://pediatrics.aappublications.org/content/129/6/e1468#BIBL This article cites 43 articles, 4 of which you can access for free at:
Subspecialty Collections
oskeletal_disorders_sub
http://www.aappublications.org/cgi/collection/rheumatology:muscul
Rheumatology/Musculoskeletal Disorders
following collection(s):
This article, along with others on similar topics, appears in the
Permissions & Licensing
http://www.aappublications.org/site/misc/Permissions.xhtml in its entirety can be found online at:
Information about reproducing this article in parts (figures, tables) or
Reprints
DOI: 10.1542/peds.2011-2274 originally published online May 28, 2012;
2012;129;e1468
Pediatrics
Bjarne Löfgren, Magnus Dencker, Jan-Åke Nilsson and Magnus K. Karlsson
Increasing Fracture Risk
A 4-Year Exercise Program in Children Increases Bone Mass Without
http://pediatrics.aappublications.org/content/129/6/e1468
located on the World Wide Web at:
The online version of this article, along with updated information and services, is
by the American Academy of Pediatrics. All rights reserved. Print ISSN: 1073-0397.