Comparison of Mercury and Aneroid Blood Pressure
Measurements in Youth
WHAT’S KNOWN ON THIS SUBJECT: As a result of safety and environmental concerns about mercury, aneroid sphygmomanometers have replaced mercury-filled devices for blood pressure measurements. Despite this change, few studies have compared the 2 devices.
WHAT THIS STUDY ADDS: Little clinical variation exists between blood pressure measurements obtained from an aneroid or mercury device, suggesting that either device could be used in a research or clinical setting.
abstract
OBJECTIVE:Because of concerns about the safety and environmental impact of mercury, aneroid sphygmomanometers have replaced
mercury-filled devices for blood pressure (BP) measurements. Despite
this change, few studies have compared BP measurements between the 2 devices.
METHODS:The SEARCH for Diabetes in Youth Study conducted a com-parison of aneroid and mercury devices among 193 youth with
diabe-tes (48% boys, aged 12.963.7 years; 89% type 1). Statistical analyses
included estimating Pearson correlation coefficients, Bland-Altman
plots, pairedt tests, and fitting regression models, both overall and
stratified by age (,10 vs$10–18 years).
RESULTS:Mean mercury and aneroid systolic and diastolic BPs were
highly correlated. For the entire group, there was no significant
differ-ence in mean systolic BP using the aneroid device, but there was a2
1.5365.06 mm Hg difference in mean diastolic BP. When stratified by
age, a lower diastolic BP (21.786 5.2 mm Hg) was seen in those
$10 to 18 years using the aneroid device. No differences in systolic
BP were observed, and there were no differences in BP by device in
individuals ,10 years. Regression analyses did not identify any
ex-planatory variables.
CONCLUSIONS:Although a small discrepancy between diastolic BP meas-urements from aneroid versus mercury devices exists, this variation is
unlikely to be clinically significant, suggesting that either device could
be used in research or clinical settings.Pediatrics2012;129:e1205–e1210
AUTHORS:Amy S. Shah, MD, MS,aLawrence M. Dolan, MD,a
Ralph B. D’Agostino Jr, PhD,bDebra Standiford, CNP,a
Cralen Davis, BS, MS,bLisa Testaverde, MS,cCatherine
Pihoker, MD,dStephen R. Daniels, MD, PhD,eand Elaine M.
Urbina, MD, MS,afor the SEARCH for Diabetes in Youth
Study Group
aDepartment of Pediatrics, Cincinnati Children’s Hospital,
University of Cincinnati College of Medicine, Cincinnati, Ohio;
bDepartment of Biostatistical Sciences, Wake Forest University
School of Medicine, Winston-Salem, North Carolina;cDepartment
of Epidemiology, Colorado School of Public Health, University of
Colorado Denver, Aurora, Colorado;dDepartment of Pediatrics,
University of Washington, Seattle, Washington; andeDepartment
of Pediatrics, Children’s Hospital Colorado, Aurora, Colorado
KEY WORDS
pediatrics, blood pressure
ABBREVIATIONS
BP—blood pressure
DPPOS—Diabetes Prevention Program Outcomes Study SEARCH—SEARCH for Diabetes in Youth Study
Dr Shah aided in the concept and study design, interpreted the data analysis, and wrote the manuscript; Dr Dolan aided in the concept and study design, interpreted the data analysis, and revised the manuscript for intellectual content; Dr D’Agostino aided in the concept and study design, conducted the analysis, and helped in the interpretation of the data; Ms Standiford aided in the concept and study design and revised the manuscript for intellectual content; Mr Davis aided in the concept and study design and conducted the analysis; Ms Testaverde revised the manuscript for intellectual content; Dr Pihoker revised the manuscript for intellectual content; Dr Daniels revised the manuscript for intellectual content; and Dr Urbina aided in the concept and study design, interpreted the data analysis, and revised the manuscript for intellectual content.
The contents of this article are solely the responsibility of the authors and do not necessarily represent the official position of the Centers for Disease Control and Prevention and the National Institute of Diabetes and Digestive and Kidney Diseases.
www.pediatrics.org/cgi/doi/10.1542/peds.2011-3087
doi:10.1542/peds.2011-3087
Accepted for publication Jan 12, 2012
Address correspondence to Amy S. Shah MD, MS, Division of Endocrinology, ML 7012, Cincinnati Children’s Hospital, 3333 Burnet Ave, Cincinnati, OH 45229. E-mail: amy.shah@cchmc.org
(Continued on last page)
gold standard for documenting blood
pressure (BP).1,2However, because of
concerns about the environment and personal health, regulatory agencies have recommended removal of these
devices.3Thus, despite a lack of studies
documenting the comparability of other devices, clinical programs and research studies have been required to use elec-tronic and aneroid devices.
Only 1 study has previously compared BP measurements obtained by mercury and aneroid devices in pediatrics. NHANES reported a small mean differ-ence in systolic BP (+1.1 mm Hg) in youth aged 8 to 17 years with the
an-eroid sphygmomanometer.4Therefore,
the SEARCH for Diabetes in Youth Study (SEARCH) sought to validate these re-sults and to determine whether dif-ferences between the 2 devices were present by age.
METHODS
SEARCH
SEARCH is a multicenter, population-based, observational study of diabe-tes mellitus in youth. Detailed study methods have been described
pre-viously.5In brief, SEARCH began
conduc-ting population-based ascertainment of
cases of diabetes in youth,20 years at
diagnosis in 2001 and continues through
the present. Cases are identified in
geo-graphically defined populations in
Colorado, Ohio, South Carolina, and Washington; among health plan enroll-ees in California and Hawaii; and Indian
Health Service beneficiaries from 4
American Indian populations. Cases are considered valid if they were diagnosed with diabetes by a health care provider.
Youth with diabetes were identified and
asked to complete a survey that col-lected information on date of birth, race/ethnicity, type of diabetes, date of diagnosis, and current diabetes treat-ment. All participants who completed
participate in an in-person study visit while metabolically stable (no episode of diabetic ketoacidosis during the previous month). At the beginning of the visit, consent was obtained from
par-ticipants or their parents (if,18 years
of age), and assent was obtained from younger subjects as directed by local institutional review boards. Informa-tion collected at the visit included ques-tionnaires for demographics, blood and urine samples, and a brief physical ex-amination that included height, weight, and BP data.
Study Population
The study population for this analysis consisted of all individuals who partici-pated in an in-person research visit be-tween September 1, 2007, and June 30, 2008, at 3 of the 6 SEARCH clinical sites: Hawaii, Ohio, and Washington. Approval for this study was obtained from local institutional review boards. Research personnel were trained in BP measure-ments by using a standard procedure derived from the National High Blood Pressure Education Program Working Group on High Blood Pressure in Children
and Adolescents (Fourth Report).1
BP Equipment and Measurements Mercury measurements were performed by using either a portable or wall-mounted Baumometer sphygmomanom-eter Kompak Model-260 mm Hg (WA Baum, Copiague, NY). Aneroid mea-surements were performed by using the Welch Allyn Tycos 767-Series Mobile Aneroid with a weighted base (model 7670-04; Welch Allyn, Skaneateles Falls, NY). Before initial use, calibration checks of the aneroid sphygmomanometers were performed by using the Netech DigiMano 1000 digital pressure-vacuum meter (part number 200-2000 IN). Cali-bration checks were repeated every 6 months and whenever the device was
Before the first BP measurement, all
participants were seated with both feet
on thefloor after resting quietly for a
minimum of 5 minutes. The right arm was used for all BP measurements un-less there was a contraindication. The
subject’s arm was supported on a table
at heart level. The examiner selected an appropriate-sized cuff based on the
circumference of the upper arm.1The
pulse pressure was determined by
lo-cating the radial pulse and inflating the
cuff until the radial pulse disappeared.
The maximum inflation level was then
recorded as the pulse pressure plus 30 mm Hg. All participants then had 4 BP measurements performed with the
same sized cuff. Thefirst andfifth
Kor-otkoff sounds were recorded for each of the 4 measurements. Subjects rested quietly for a minimum of 30 seconds between measurements.
Thefirst 2 measurements were always
taken with an aneroid sphygmoma-nometer. The third and fourth meas-urements were measured by using either aneroid then mercury, or mer-cury then aneroid. The order of these third and fourth measurements was randomly assigned by the SEARCH Co-ordinating Center. Each of the 3 clinical sites were sent a list specifying the order (mercury then aneroid or aneroid then mercury) for performing the third and fourth BP measurements for each participant. This list was generated by using Proc Plan, a statistical procedure in SAS (version 9.2; SAS Institute, Cary, NC) for generating randomization plans. Only the third and fourth BP measure-ments were used in these analyses.
Statistical Analysis
Statistical analyses were performed by using SAS software (version 9.2; SAS Institute, Cary NC). All data were ana-lyzed for the entire cohort and then by
years. Pearson correlation coefficients for systolic and diastolic BP measure-ments from the 2 BP devices (aneroid and mercury) were calculated. In
ad-dition, we fit Bland-Altman plots to
provide a visual comparison between the 2 methods. Next, mean differences in systolic and diastolic BP obtained from each device were compared by
using pairedttests to determine if they
were different from zero. This was used to estimate the difference in millime-ters of mercury observed between de-vices and to generate a correction factor between devices. Thus, if we as-sume that the observed average differ-ence between devices represents the
“shift” in blood pressure
measure-ments due to the different devices, then
adding this difference as a“correction
factor”to the aneroid measures would
allow for the new (aneroid) measures to have the same observed BP values as the mercury measures. Finally, general
linear models werefit to determine if
the reason for the observed differences in BP measures between devices could
be identified. Models were adjusted for
age, gender, race/ethnicity, BMI, clinic
site, or type of diabetes.Pvalues of
,.05 were deemed significant in these
analyses.
RESULTS
One hundred ninety-three youth (48%
male youth) with a mean age of 12.96
3.7 years (age range 3.9–18.9 years)
who had a mean duration of diabetes of
9.2 6 5.6 months participated in the
comparison of the 2 BP devices (Table 1). Of these participants, 171 had a clinical diagnosis of type 1 diabetes, and 22 had type 2 diabetes. A majority of the par-ticipants were non-Hispanic white. When
stratified by age (aged,10 and$10–
18 years), there were no significant
dif-ferences between the groups except for diabetes type and BMI because the youth with type 2 diabetes were exclusively in
the$10- to 18-year age category.
The randomization of the sequence of BP measurements (aneroid then mer-cury or mermer-cury then aneroid) resulted in 92 subjects randomized to receive aneroid then mercury and 101 individ-uals to mercury then aneroid for the third and fourth BP measurements.
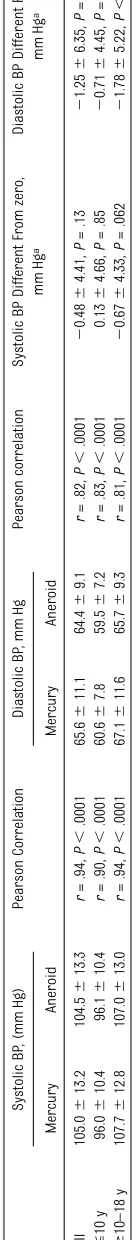
Mercury and aneroid systolic and
di-astolic BP measures were significantly
correlated for the total sample and by age group (Table 2). For systolic BP, the
overall correlation was r = .94, P ,
.0001. By age,r= .90,P,.0001 for,10
years andr= .94,P,.0001 for$10 to
18 years. Likewise, for diastolic BP, the
overall correlation was very high:r =
.82,P,.0001 andr= .83,P,.0001 and
r= .81,P,.0001 for,10 years and
$10 to 18 years, respectively.
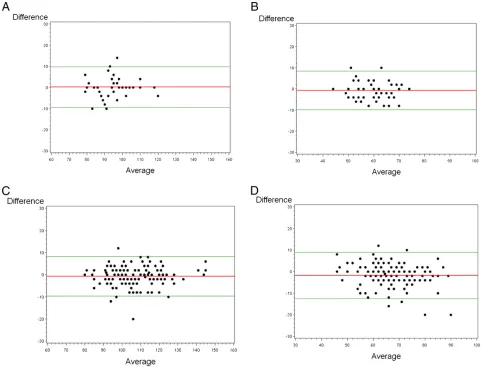
We examined Bland-Altman plots to further assess agreement between the 2 methods. These plots are presented in Fig 1 with 4 panels, 2 for each measure (systolic and diastolic BP) and 2 for
each age group (,10 years and$10–
18 years). For the older group (Fig 1d) larger differences in diastolic BP seemed to occur for diastolic blood
pressures.65 mm Hg; however, there
is no clear trend in these data to
sug-gest a specific cutpoint where the 2
methods become discordant.
We then tested whether the mean dif-ference in systolic and diastolic BPs
obtained by the mercury and aneroid
devices was significantly different from
zero. This was used to estimate a cor-rection factor between devices. Among
individuals ,10 years, the mean
dif-ference in systolic and diastolic BPs
was not different from zero (P= .85 and
P = .29, respectively). In individuals
$10 to 18 years of age, the mean
dif-ference in systolic BP was not signifi
-cant (2.67 6 4.33, P= .06), but the
mean difference for diastolic BP was
significantly different from zero (21.78
65.22,P,.0001). Thus, to equate BPs
between devices a correction factor of +1.8 could be added to an aneroid BP
measurement in individuals$10 years.
Regression models were used to seek for the reason for the differences in diastolic BP by device. Models were only created for diastolic BP as systolic BP was not statistically different by device. Univari-ate analysis revealed race/ethnicity and
BMIzscore to be significantly associated
with the mean difference in diastolic BP. Nonwhites were found to have a larger difference in diastolic BP (1.71 mm Hg,
P = .03), and a 1-unit change in BMI
zscore corresponded to a 0.85 mm Hg
(P= .014) difference in diastolic BP. In the
fully adjusted models, race/ethnicity and
BMIzscore were no longer significant,
and no other predictors to explain the difference in the diastolic BP measures
were identified.
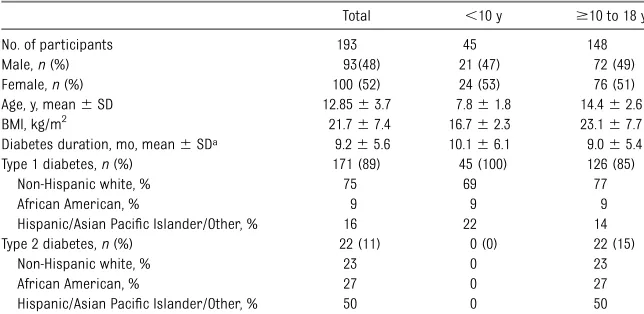
TABLE 1 Characteristics of the Study Population
Total ,10 y $10 to 18 y
No. of participants 193 45 148
Male,n(%) 93(48) 21 (47) 72 (49)
Female,n(%) 100 (52) 24 (53) 76 (51) Age, y, mean6SD 12.8563.7 7.861.8 14.462.6 BMI, kg/m2 21.767.4 16.762.3 23.167.7 Diabetes duration, mo, mean6SDa 9.265.6 10.166.1 9.065.4 Type 1 diabetes,n(%) 171 (89) 45 (100) 126 (85)
Non-Hispanic white, % 75 69 77
African American, % 9 9 9
Hispanic/Asian Pacific Islander/Other, % 16 22 14 Type 2 diabetes,n(%) 22 (11) 0 (0) 22 (15)
Non-Hispanic white, % 23 0 23
African American, % 27 0 27
Hispanic/Asian Pacific Islander/Other, % 50 0 50
aDuration of diabetes indicates duration of diabetes at time of study visit.
This study demonstrates that systolic and diastolic BPs measured by mercury and aneroid devices are highly corre-lated for the entire sample and by age
group. In individuals$10 to 18 years,
a significantly lower mean diastolic BP
was found when using the aneroid sphygmomanometer. On the basis of our analyses, this corresponds to a mean correction of +1.8 mm Hg that could be added to an aneroid BP measurement to equate the 2 devices if both are used in a single study. However, given the good agreement between devices, this cor-rection is unlikely to result in clinically
significant differences in BP, suggesting
that either device could be used in a clinical or research setting.
Two previous studies have compared aneroid to mercury devices with only 1 performed in a pediatric population. In middle-aged adults, the Diabetes Pre-vention Program Outcomes Study (DPPOS) found no difference in mean systolic BP
and a small but statistically significant
lower diastolic BP when comparing
an-eroid and mercury devices.6This pattern
is identical to thefindings in our study.
These results are in contrast to those reported by NHANES in which a statisti-cally higher systolic BP among 8- to 17-year-olds was found using an aneroid
sphygmomanometer.4
Discrepant results between NHANES and our study may be due to several factors, including participant differences, dif-ferent analysis techniques, and the presence of diabetes. First, it is possible the study subjects in the 2 cohorts were of different age, gender, race/ethnicity, and BMI distribution. Although the study population was not described in the NHANES article, the DPPOS found
“participant” differences explained 8%
to 10% of the variation in BPs between
the 2 devices.6 Second, we stratified
our subjects by age to separate those
prepubertal (,10 years) from those
who were pubertal or postpubertal
(8–17 years).4 Thus, it is possible
changes occur in BP measurements during or after puberty that were not accounted for in NHANES report. Finally, there may be differences in BP related to the presence of diabetes, although to our knowledge, this has not been pre-viously described. Thus, it is not clear why there are differences between our study and NHANES. Multivariate analy-ses did not identify any factors that contributed to the differences in di-astolic BP by device. Thus, the reasons for the differences in blood pressure by device can only be speculated.
As mentioned earlier, a correction factor of 1.8 could be applied to diastolic BP measurement obtained by using an
an-eroid device in adolescents aged$10 to
18 years. This correction factor is only applicable to equate BPs in clinical or research settings where both devices have been used or there has been a change of devices due to more recent regulations preventing mercury BP mea-surements. In settings where aneroid only technology has been used, we cannot conclude from this study that this cor-rection factor should apply.
A potential limitation of our report is that this study was performed in youth who have diabetes. As previously men-tioned, the presence of diabetes should not affect the measurements of BP obtained by using the mercury or an-eroid devices. Given that our results coincide with those published by the DPPOS, it appears reasonable to con-clude that the data presented here are applicable to all youth. It should also be noted that youth with hypertension were not studied, and thus it is unclear whether larger discrepancies between devices exist at higher BPs.
CONCLUSIONS
This study found no significant
differ-ence in mean systolic BP but a slightly
significantly lower mean diastolic BP in youth using the aneroid device. Al-though the differences described are
statistically significant, as suggested by
others,4,6 the differences in BP
meas-urements between aneroid and mer-cury sphygmomanometers are small and are unlikely to be clinically signif-icant. In conclusion, either device could be used.
ACKNOWLEDGMENTS
The SEARCH for Diabetes in Youth Study is indebted to the many youth and their families, and their health care providers, whose participation made this study possible.
SiteContract Numbers:KaiserPermanente Southern California (U48/CCU919219, U01 DP000246, and U18DP002714), University of Colorado Denver (U48/CCU819241-3, U01 DP000247, and U18DP000247-06A1), Kuakini Medical Center (U58CCU919256
and U01 DP000245), Children’s Hospital
Med-ical Center (Cincinnati) (U48/CCU519239, U01 DP000248, and 1U18DP002709), University of North Carolina at Chapel Hill (U48/CCU419249, U01 DP000254, and U18DP002708-01), University of Washington School of Medicine (U58/ CCU019235-4, U01 DP000244, and U18DP002710-01), Wake Forest University School of Medicine (U48/CCU919219, U01 DP000250, and 200-2010-35171). We ac-knowledge the involvement of General
Clinical Research Centers at the South Carolina Clinical & Translational Re-search (SCTR) Institute, at the Medical University of South Carolina (National Institute of Health/National Center for Research Resources [NIH/NCRR]
grant UL1RR029882); Children’s
Hospi-tal and Regional Medical Center (grant M01RR00037); Colorado Pediatric General Clinical Research Center (grant M01 RR00069), and the Barbara Davis Center at the University of Colorado at Denver (Diabetes and Endocrinology Research Center/National Institutes of Health grant P30 DK57516); and the Institutional Clin-ical and Translational Science Award, NIH/NCRR at the University of Cincinnati (grant 1UL1RR026314-01).
FIGURE 1
Agreement between aneroid and mercury devices. The red line indicates the mean difference between readings, and the green line is the
95% confidence intervals of agreement. Bland-Altman Plots: A, systolic BP, age 0–9. B, diastolic BP, age 0–9. C, systolic BP, age 10–18. D, diastolic BP,
age 10–18.
Program Working Group on High Blood Pressure in Children and Adolescents. The fourth report on the diagnosis, evaluation, and treatment of high blood pressure in children and adolescents. Pediatrics. 2004(suppl 2, 4th report);114:
555–576.
2. Chobanian AV, Bakris GL, Black HR. The sev-enth report of the Joint National Committee on the Prevention, Detection, Evaluation, and
tension. 2003;42(6)1206–1252.
3. Messelbeck J, Sutherland L. Applying envi-ronmental product design to biomedical
products research.Environ Health Perspect.
2000;108(suppl 6):997–1002
4. Ostchega Y, Prineas RJ, Nwankwo T, Zipf G. Assessing blood pressure accuracy of an aneroid sphygmomanometer in a national
survey environment.Am J Hypertens. 2011;
24(3):322–327
Youth: a multicenter study of the prevalence,
incidence and classification of diabetes
mellitus in youth.Control Clin Trials. 2004;25
(5):458–471
6. Ma Y, Temprosa M, Fowler S, et al;
Dia-betes Prevention Program Research
Group. Evaluating the accuracy of an an-eroid sphygmomanometer in a clinical
trial setting.Am J Hypertens. 2009;22(3):
263–266
(Continued fromfirst page)
PEDIATRICS (ISSN Numbers: Print, 0031-4005; Online, 1098-4275).
Copyright © 2012 by the American Academy of Pediatrics
FINANCIAL DISCLOSURE:The authors have indicated they have nofinancial relationships relevant to this article to disclose.
DOI: 10.1542/peds.2011-3087 originally published online April 16, 2012;
2012;129;e1205
Pediatrics
for the SEARCH for Diabetes in Youth Study Group
Davis, Lisa Testaverde, Catherine Pihoker, Stephen R. Daniels, Elaine M. Urbina and
Amy S. Shah, Lawrence M. Dolan, Ralph B. D'Agostino Jr, Debra Standiford, Cralen
Comparison of Mercury and Aneroid Blood Pressure Measurements in Youth
Services
Updated Information &
http://pediatrics.aappublications.org/content/129/5/e1205 including high resolution figures, can be found at:
References
http://pediatrics.aappublications.org/content/129/5/e1205#BIBL This article cites 4 articles, 0 of which you can access for free at:
Subspecialty Collections
sub
http://www.aappublications.org/cgi/collection/emergency_medicine_
Emergency Medicine
following collection(s):
This article, along with others on similar topics, appears in the
Permissions & Licensing
http://www.aappublications.org/site/misc/Permissions.xhtml in its entirety can be found online at:
Information about reproducing this article in parts (figures, tables) or
Reprints
DOI: 10.1542/peds.2011-3087 originally published online April 16, 2012;
2012;129;e1205
Pediatrics
for the SEARCH for Diabetes in Youth Study Group
Davis, Lisa Testaverde, Catherine Pihoker, Stephen R. Daniels, Elaine M. Urbina and
http://pediatrics.aappublications.org/content/129/5/e1205
located on the World Wide Web at:
The online version of this article, along with updated information and services, is
by the American Academy of Pediatrics. All rights reserved. Print ISSN: 1073-0397.