Research article Available online www.ijsrr.org
ISSN: 2279–0543
International Journal of Scientific Research and Reviews
A MIMO system –Design to Test using Lab VIEW
Swain B.
1*, Reddy R.
1, Patnaik R.
2, Naik R. A.
11Department of Electronics & Instrumentation, LBRCE, Andhra Pradesh, India 2
Department of Instrument Technologies, Andhra University, Andhra Pradesh, India
ABSTRACT
Chemical reaction, Ventilation system, central heating systems, dryers, hot balloon and other applications are required for precise control of hot air. The design and test of a real time MIMO system for automatic air temperature & airflow control using Lab VIEW is presented. The airflow and air temperature is controlled using fan speed &input voltage to heater. Manipulated variables are variable voltage to heater and variable voltage to DC fans. Controlled variables are airflow and temperature at the outlet. Disturbances are room temperature, inlet air temperature and DC fan speed. The designed MIMO system can be easily interfaced with Lab VIEW by using NI my DAQ. Here the authors mostly focus on the design of the system, which can later be controlled by various control technique like PID, MPC, IMC etc. The performance of the system is studied by subjecting it to various tests conditions.
KEYWORDS
: Multi-input Multi-output, MIMO system, Linear Flow, MPC, PID*Corresponding Author
Bikash Swain
Department of Electronics & Instrumentation engineering,
INTRODUCTION
System with more than one controlled variable and manipulated variable is called
multivariable or multi-input and multi-output (MIMO) system1.The modern industrial application
such space heating, ventilation system2, incubation chamber and chemical mixer where temperature
and ventilation in a precise manner is essential. These have motivated the authors to design a real
time temperature and flow system with the help of LABVIEW and myDAQ, which in the later part
can be controlled by various control methodslikeProportional-Integral-Derivative (PID),Model
Predictive Control (MPC),Internal Model Control (IMC) etc. The aim is to design a MIMO system
for temperature and flow control.
EXPERIMENTAL SETUP
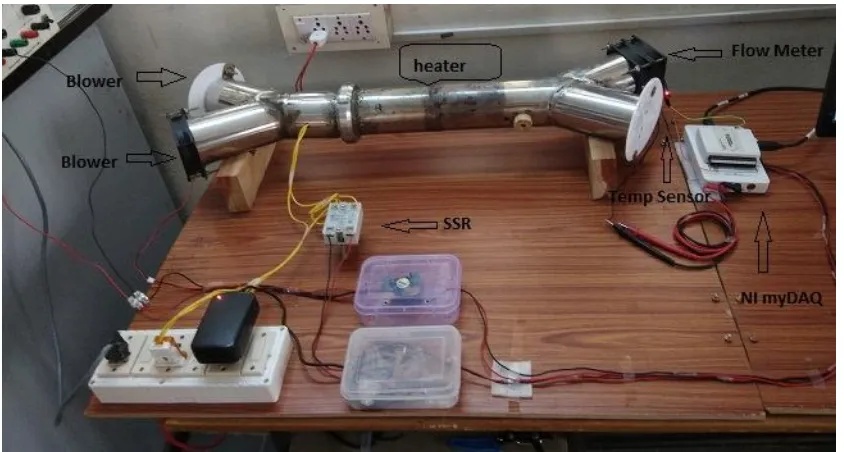
This experimental setup shown in figure 1, is developed with 2-Y junction stainless steel
pipe. One end of the structure is fixed withtwo12V DC blowers. One blower is for flow control
inside the system. Second blower is to produce process error for air flow. Other end of the structure
is embedded with temperature sensor and flow sensor. The analogue output port of my DAQ- AO0 is
connected to a 500-watt heater. As the heater is to run with 230-volt AC, and the my DAQ maximum
output voltage is 10 V DC, so for isolation, a silicon control rectifier (SSR) is used in between my
DAQ and the air heater. For temperature sensing, a thermistor of 10 kΩ has been placed and
connected to the DAQ multi meter input port.
Similarly, analogue output port of myDAQAO1 is connected to one of the blower which is
responsible for flow control inside the pipe. For flow measurement, indirect principle has been
introduced. A CPU modified fan has been placed at the end of the pipe with a small white mark on
one of its blade to be detected by an IR sensor. RPM of the CPU fan varies as per the flow rate and
can be counted by the IR sensor. The linear flow and volumetric flow can be formulated. The IR
Fig 1: Hardware setup
1.
Temperature measurement
In this MIMO system, the temperature sensor used is thermistor NTC k +/-10% 10k ohm,having
temperature range from -40°C to 200°C. Thermistor is connected to myDAQ Digital Multi meter
port as shown in figure 2. This Thermistor is placed after the air heater.With the increase or decrease
in temperature there is a change in resistance. This resistance is converted to temperature using
Steinhart –hart equation.
1
= + ( ) + [ ( )]
The DAQ assistant has been chosen with the optimum setting under resistance mode to
receive the data from thermistor. The graphical programing for temperature measurement is shown in
figure 3. The constant values for A,B,C has been calculated.
Fig 3: Temperature measuring block diagramin LabVIEW
2.
Temperature loop
Electric heating is a process in which electrical energy is converted to heat. Air heater is
used to heat the air with the following specification.
Type: Double ended type
Maximum Operating Temperature: Room temp to 150°C
AC Voltage Required: 230V
Wattage: 500W
Dimensions:20 cm length
Fig 5: Temperature loop
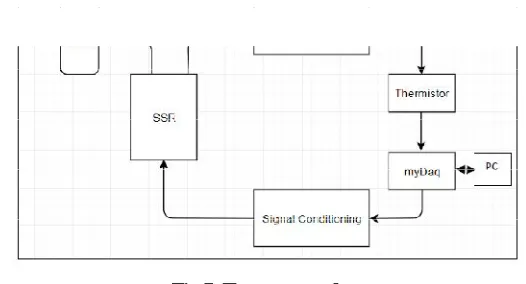
Temperature loop shown in figure 5, consist of heater, thermistor, my DAQ, signal
conditioning circuit, solid state relay (SSR), AC power. SSR is an electronic switching device that is
used to control the AC loads as per the DC control signal. NI my DAQ Analog Output channel
current specification is only 2 mA, which is not sufficient to drive the solid state relay (SSR) as the
signal. 230V power supply established across the air heater, when SSR is ON. LabVIEW
continuously controls the air heater through SSR according to the temperature set point and measure
the outlet air temperature and inlet air temperature with thermistors.
Disturbances like external heat provided by hot blower, environmental temperature, cool air
from different sources etc. can be considered.
3.
Flow measurement
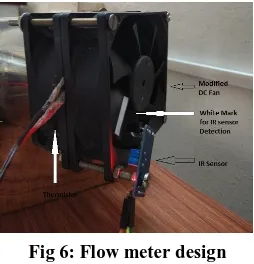
In this system flow measurement is done by a flow meter designed with the help of a DCfan by
removing its stator and rotor magnet to make it more frictionless. A white line mark has been
provided to detect by IR sensor for RPM. 3.3 voltage is the output of IR sensor under ideal condition
and 0 voltage under active condition.
Linear Flow rate and volumetric flow rate can be formulated from RPM value.According to
the general fan law governing axial fans, linear flow rate, Foot per Minute (F/M) rate can be
calculated by fan blade pitch (blade tilt or attack angle) with RPM3.Volumetric flow rate, Cubic Feet
per Minute (CFM) to be calculated by knowing the fan blade diameter, pitch along with the rpm.
In this system, the fan to be used as flow meter shown in figure 6 has a Diameter of 7.3 cm
/0.239501 foot and Blade tilt is 0.9 cm/0.0295276 foot.
Linear Flow Rate can be adjusted as: -RPM * 0.0295276 foot
Volumetric flow rate can be adjusted as: -Linear Flow Rate *π*(D/2)2.
Fig 6: Flow meter design
The graphical programming for flow measure is designed by taking the voltage out from the
IR sensor. Edge triggered concept have been introduced to find the number of times the white
mark has detected by IR sensor. RPM is deducingby comparing the input voltage from IR sensor
Fig 7: Flow measuring block diagram in LabVIEW
4.
Flow loop
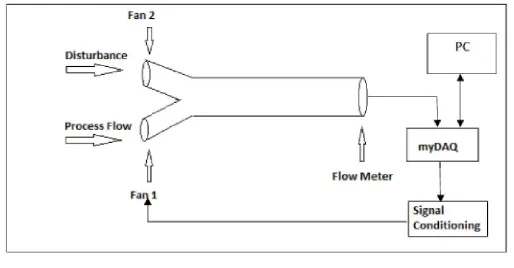
Flow loop shown in figure 8 consists of two blowers, flow meter, my DAQ, motor driver.
One blower (fan 1) is used to control the flow of air inside the system during the process. Second
blower (fan 2) is used as a flow disturbance inside the system. The second blower can be manually
controlled by varying the input voltage through a potentiometer connected to it. As per the set point
of linear flow or volumetric flow, LabVIEW transmits the pulse width modulated (PWM) signal to
the motor driver to control the speed of blower.
Fig 8: Flow loop
TEST, RESULTS AND DISCUSSION
1.
Temperature test
We developed and tested our system with various way under minimum and maximum
load. It should be noted that the test values are random numbers to analyse the response of each and
Open loop test for temperature measurement as well as heater response is done by
providing some random voltage signal to the my DAQ, in result it controls the input DC voltage of
the SSR. As per the SSR voltage level, the heater voltage and corresponding temperature can be
controlled. During the entire test the linear flow rate and volumetric flow rate were constant at 23.47
F/M and 4.22 CFM respectively.
Fig 9- Open loop temperature test
Table 1: Input voltage vs temperature (°c)
SL NO Voltage from myDAQ (V) Drop Across SSR (V) Temperature (°C)
1 0 0 28.7(room temperature)
2 1 1.16 28.7(room temperature)
3 3 1.68 28.7(room temperature)
4 3.6 1.82 28.7(room temperature)
5 3.7 1.84 34.9
6 3.8 1.86 41.32
7 3.9 1.88 54.4
8 4 1.90 59.9
9 4.1 1.92 63.21
10 4.2 1.94 63.21
11 4.3 1.96 64.39
12 4.4 1.98 74.42
13 4,5 2.00 82.20
14 4.6 2.02 84.6
15 4.7 2.04 100.01
16 4.8 2.06 104.20
17 4.9 2.08 104.20
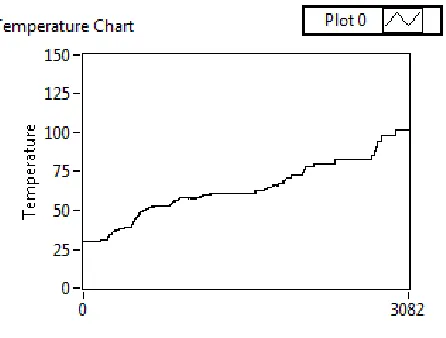
Fig 10: Temperature variation chart (°c)
It is observed that the system is having large dead time, as the heater gets turn ON only, when
the voltage is equal or above 3.7 V. The minimum temperature is obtained through this system is the
room temperature and the maximum is 106.4 °C. When the voltage is 3.7 V, 34.9 °C is measured
when the room temperature is 28.7 °C, but under the same voltage, 38.7 °C is measured when the
room temperature is 32.3 °C. The system is affected with the environmental temperature and is
considered as a prime disturbance as stated earlier.
The system is nonlinear in nature as the measured temperature is not in proportional with the
input voltage. Utmost care should be taken while designing the controller for the system due to its
huge dead time, nonlinear nature, various disturbances and interaction.
2.
Flow test
Open loop test for flow measurement and blower response is achieved by providing the pulse
width modulated (PWM) signal from the LabVIEW toa motor driver. The first blower (fan 1) is
connected to the motor driver. During the entire test the disturbance (fan 2) was kept zero. Pulse
Width Modulation, or PWM, is a technique for controlling analog systems with digital control. It
generates a square wave signal fast switching between on and off. This pattern can average the
voltages level in between maximum and zero. For variable analog values, pulse width needs to be
changed. The maximum and minimum linear flow rate and volumetric flow rate are expressed in
Fig 11: Open loop flow test
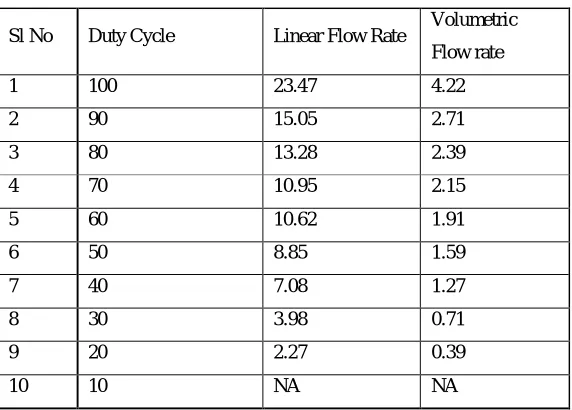
Table 2: Duty cycle vs linear & volumetric flow
Here the system is nonlinear in nature as the change of flow rates are not linear with the
change in input PWM duty cycle. The designed flow measuring system is unable to measure any
flow rate below 0.39 CFM.
CONCLUSION
The objective todesign a MIMO system has been satisfied. Various test signals are used in
temperature and flow control loop and got the expected response from the system. It has been found
that the MIMO system is nonlinear in nature, which provides a good platform to design and test
various control technique.
Sl No Duty Cycle Linear Flow Rate Volumetric
Flow rate
1 100 23.47 4.22
2 90 15.05 2.71
3 80 13.28 2.39
4 70 10.95 2.15
5 60 10.62 1.91
6 50 8.85 1.59
7 40 7.08 1.27
8 30 3.98 0.71
9 20 2.27 0.39
REFERENCES
1. Patil S.S, Bhaskar P, Shri manthsudheer L. Design and implementation of integrated fuzzy
logic controller for MIMO system. Defence Science Journal, 2011; 61:219-227.
2. Vaccarini M,Carbonari A, Giretti A. Preliminary implementation of predictive control for
ventilation system in metro stations. International association for automation and robotics in
construction, 2013;30:922-929.
3. Gill P. “How to calculate CFM from RPMs”.[online]. Available from: URL: