DOI : https://doi.org/10.32628/IJSRST18401142
Comparative Study of Different Project Size Estimation
Technique for the Development of Software
Ajay Kumar Shrivastava
M. Tech Research Scholar, Jharkhand Rai University, Ranchi, Jharkhand, India
ABSTRACT
In SDLC (Software development life cycle model) there are various phase we use to develop the software in that the one is planning phase in this phase we use some estimation technique for estimate the Size, Cost, Effort etc for the software. The main objective of software engineering discipline is to develop the software in systematic and discipline manner as per user requirement. And also, the software should deliver in time and in budget. To acquiring this feature is called planning of the software i.e. how much it takes time and cost to complete and effort required form development is depend on nature of the software. The objective of this paper is to find out advantages and shortcoming of different Size estimation technique. In this paper we compared all traditional approach for size estimation technique.
Keywords : Software Engineering, Size Estimation Techniques, LOC, FP and Feature Point.
I.
INTRODUCTIONSoftware project managers begin project planning after passing feasibility study. Project planning is undertaken and completed even before any development activity starts. Project planning consists of the following essential activities[1]:
These are some Attributes for the project Estimation [2]:
Project size: Total size of the project.
Cost: How much cost required to develop the project.
Duration: Total time taken to complete the software.
Effort: Total effort required to complete the software.
The software planning activities is based on the accurateness of these estimations.
✓ Scheduling.
✓ Staff organization and staffing planning.
✓ Risk identification and Risk analysis.
✓ Non functional requirement like quality
assurance plan, configuration management plan, etc.
Figure 1
II.
METRICS IDENTIFIED FOR EARLY SOFTWAREPROJECT SIZE ESTIMATION
The subjective technique commonly implemented is PERT for near accurate early estimation of the problem. Size estimation can be categorized into Optimistic, Most Likely and pessimistic approaches of effort, time duration and cost of a software project. The overall project size can be expressed as the weighted mean of each functional size. The size of software developed is not simply the number of bytes that the source code occupies and nor it is the byte size of the final code which is executed. The project size is determined as a measure of the problem complexity in terms of the effort and time required to develop the final software product [4].
Previous research elucidates that two most popular metrics to estimate size are: Lines of code (LOC) and Function point (FP). The usage of each of these metrics in project size estimation has its own advantages and disadvantages[5].
A. Lines of Code (LOC)
Determining the LOC count at the end of a project is an elementary job. However, accurate estimation of the Lines of Count at the beginning of a project is very difficult. In order to estimate the LOC count at the beginning of a project, project managers usually divide the problem into modules and each module into sub modules and so on, until the sizes of the different leaf-level modules can be approximately
predicted. To be able to do this, past experience in developing similar products is helpful. By using the estimation of the lowest level modules, project managers arrive at the total size estimation [6,7].
TABLEI
Advantages of LoC Disadvantages of LoC as
size estimator Most Simple metric to
employ
LoC is determined on
language and the
programmer Adequate automation
tools for determining LoC count
It penalizes the well designed short programs
The level of detail
required may not be available at the early stages of development.
Not easily
comprehendible by users.
The commonly adopted Line Counting Rules :-
▪ Do not count blank lines.
▪ Do not count Comments.
▪ Job control lines should be count
▪ SQL statements should be count.
▪ Do not count Standard operating system
include files.
▪ Code lines should be count.
▪ User defined include files should be count
(once).
B. Function Points ( FP )
Function point metric was proposed by Albrecht [1983] and the major advantages of using the function point metric is its capability to easily estimate the size of a software product directly from the problem specification. This has an edge over the LOC metric, where the size can be accurately determined only after full development of the product [8,9].
Effort Estimat ion
Cost Estimati
on Size
Estimat
ion Schedu
ling Project
Staffing Duratio
n Estimat
FP = Features * Co-efficients
= 4.3 * (Number of inquiries) + 5.25 * (Number of outputs) + 3.8 * (Number of inputs) + 10 *(Number of files) + 8.5 *(Number of interfaces)
The feature description is as follows[10] :-
# Number of inputs: Count of each data item input is done by the user. These data inputs are different from the user inquiries as the inquiries encountered are user commands. These inquiries are counted separately. The individual data items input by the user are not considered in the calculation of the number of inputs, but a group of related inputs are considered as a single input.
# Number of interfaces: Here the interfaces considered are the interfaces used to exchange information with other systems. Examples of such
interfaces are data files on tapes, disks,
communication links with other systems etc.
# Number of outputs: The outputs considered refer generically to the output screens, Printed reports, error messages produced. While outputting the number of outputs the individual data items within a report are not considered, but a set of related data items is counted as one input [6,7,8].
# Number of inquiries: Number of inquiries is the number of distinct interactive queries which can be made by the users. These inquiries are the user commands which require specific action by the system.
# Number of files: The count of each logical file is computed. A logical file means groups of logically related data. Thus, logical files can be data structures or physical files.
The first step is computation of the unadjusted function point (UFP). Next, each of these 14 factors is
assigned from 0 (least significant) to 6 (high significance). The resulting numbers are summed, yielding the Summed influence degree as (SID). Now, TCF is computed as (0.65+0.01*SID).
As SID can vary from 0 to 70, TCF can vary from 0.65 to 1.35. Finally, FP=UFP*TCF [9].
TABLE2
Function Type Low Average High
External Input x3 x4 x6
External Output x4 x5 x7
Logical Internal
File x7 x10 x15
External Interface
File x5 x7 x10
External Inquiry x3 x4 x6
Low, average and high decision can be determined with this table :
TABLE3
1-5 Data element types
6-19 Data elemet types
20+ Data elemet types
0-1 File types
referenced Low Low Average
2-3 File types
referenced Low Average High
4+ File types
In order to find adjusted FP, UFP is multiplied by technical complexity factor (TCF ) which can be calculated by the formula[11] :
TCF = 0.65 + ( sum of factors ) / 100
There are 15 technical complexity factor. Each complexity factor is rated on the basis of its degree of influence, from less significant to high significant.
TABLE4
S.No. Feature variable Priority ( on
Scale 1-5)
1. Data communications *****
2. Performance *****
3. Configuration usage ****
4. Transaction rate ****
5. Online data entry ****
6. Efficiency of end user ****
7. Online update ***
8. End user efficiency ***
9. Complex processing ***
10. Reusability ***
11. Installation ease **
12. Operations ease **
13. Facilitate change *
14. Distributed functions *
15. Multiple sites *
Then FP = UFP x TCF [10]
Figure 2 : The Conceptual Model (Author compilation)
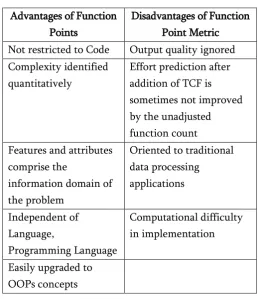
TABLE5
Advantages of Function Points
Disadvantages of Function Point Metric
Not restricted to Code Output quality ignored
Complexity identified quantitatively
Effort prediction after addition of TCF is sometimes not improved by the unadjusted function count Features and attributes
comprise the
information domain of the problem
Oriented to traditional data processing applications Independent of Language, Programming Language Computational difficulty in implementation
Easily upgraded to OOPs concepts
Figure 3
TABLE6
SUMMARY OF THE COMPARISON OF LOC AND
FUNCTION POINTS
Feature Lines Of
Code
Function Points Language &
technology
Dependent Independent
Communication with clients Not familiar with LOC Somewhat easy to communicate with the client 0 50 100 150 200 250 300 350 As se m b ly … c Fort ra n CO BOL Pa scal C+ + SQL Sc is so rs
Tools There are various software tools for counting LOC
Not any automated tool for FP
Usage time Better result
in the design stage
FP is applicable in early stage of requirements gathering
III.
FEATURE POINT METRICA major drawback of the function point metric is that it does not focus on software algorithmic complexity. That is, the function point metric completely assumes that the develop any two functionalities of the system and effort necessary to design is the same. But, we know that this is usually not correct, the effort necessary to develop any two functionalities may vary extensively. To solve the measurement problems
of classical Management Information Systems
Function Points were originally invented. Software like real time software, embedded software, communication software and process control software FP is not suitable. Whereas Feature point metric includes an extra parameter algorithm complexity. most of cases the estimation of the Feature Points is like to the estimation of the Function Points[13,14].
IV.
CONCLUSIONIn my future work can improve function point metric or can propose a methodology to estimate the size of the software from design phase of the project mainly Use case model and class diagram. In SDLC model a project manager can gather all refine requirement from customer after several process that means there is minor chance to mistake to gather requirement form customer. After gathering requirement design Use case model and class diagram it will be helpful to
estimate the actual size of the project by some experience or expert team member.
V.
REFERENCES[1] Kathleen Peters, Berkun, Scott, “Art of Project
Management. Cambridge”, MA:O'Reilly Media.
ISBN 0-596-00786-8. Software Project
Estimation (White paper), Software
Productivity Centre Inc. (SPC) in Vancouver, British Columbia, Canada, 2005.
[2] Nilesh Chandra Shukla, “ A Tool for Software
Project Management for Estimation, Planning
& Tracking and Calibration”.IIIT-Allahabad.
[3] Rajib mall, “Fundamentals of Software
Engineering” ,PHI learning pvt.Ltd.2009
edition.
[4] Nasib Singh Gill, “ Software Engineering,
Software Reliability, Testing and Quality
Assurance”, Khanna Book Pubishing Edition.
[5] D. R. Jeffery, G. C. Low, and M. Barnes, “A
comparison of function point counting
techniques”, IEEE Trans on Soft. Eng., vol. 19,
no. 5, 1993, pp. 529-532.
[6] D. St-Pierre, M Maya, A. Abran, J. Desharnais
and P. Bourque, “Full Function Points:
Counting Practice Manual”, Technical Report
1997-04, University of Quebec at
Montreal,1997.
[7] S.K.Mohanty & A.K.Bishnoi, “Software Effort
Estimation Approaches- A Review”,
International Journal of Internet Computing
ISSN No: 2231 – 6965, VOL-1, ISS- 3 2012.
[8] Hareton Leung, Zhang Fan, “Software Cost
Estimation”, Article 2001.
[9] Jyoti G Borade & Vikas R Khalkar, “Software
Project effort and cost Estimation Techniques”,
International Journal of Advanced Research in
Computer Science and Software Engineering
ISSN-2277-128X, Vol. 3, Issue 8, aug 2013.
[10] Matthias Kerstner, “Software Test Effort
[11] Ali BouNassif, Luiz Fernando Capretz and
Danny Ho, “ Enhancing Use Case Point
Estimation Method Using Soft Computing
Techniques”, ISSN-2229-371X.
[12] Mike Cohn, “Estimating With Use Case Points”,
Founder-Mountain Goat Software.
[13] Erik Stensrud, “Estimating with Enhanced
Object Points vs. Function Points”. Andersen
Consulting Drammensveien 165, 0212 Oslo, Norway& University of Oslo, Dept. of Informatics
[14] Kurmanadham V.V.G.B. Gollapudi, “Function
Points or Lines of Code? – An Insight”, Wipro