Implementation Of Code And Carrier Tracking
Loops For Software GPS Receivers
Win Kay Khaing, Zaw Min Naing, Su Su Yi Mon, Aung Soe Khaing, Hla Myo Tun, Sao Hone Pha
Abstract: GPS is playing in very important role in our modern mobile societies. Software approach is very flexible rather than the traditional hardware receivers. The soft-GPS receiver includes two portions: hardware and software. In hardware portion, an antenna, filter, down-converter from RF (Radio Frequency) to IF (Intermediate Frequency), and an ADC (Analog to Digital Converter) are included. In software portion, signal processing such as acquisition, tracking and navigation that runs on general purpose processor is included. The GPS signal is taken from N-FUELS (Full Educational Library of Signals for Navigation) signal simulator. The heart of soft-GPS receiver is the synchronization processes such as acquisition and tracking. In tracking, there are two main loops for code and carrier tracking. The objective of this paper is to analyse and find the optimum discriminator function for the code tracking loop in soft-GPS receivers. The delay lock loop (DLL) is a well-known technique to track the codes for GNSS spread spectrum systems. This paper also presents non-coherent square law DLLs and the impacts of some parameters on DLL discriminators such as number of samples per chip, early-late spacing, different C/ No values where C denotes the signal power and No is the noise spectral density, and the impact of with or without
front-end device. The results of discriminator outputs are illustrated by using S-curves. Testing results with the real GPS signal are also described. This optimized discriminator functions can be implemented in any soft-GPS receivers.
Keywords: code tracking, carrier tracking, discriminator function, software GPS receiver, N-FUELS simulator
————————————————————
I.
I
NTRODUCTIONThe Global Navigation Satellite System (GNSS) is a satellite-based, world-wide, all-weather navigation and timing system. Current GNSS system includes American Global Positioning System (GPS), Russian GLObal NAvigation Satellites System (GLONASS), European GNSS Galileo and Chinese (Compass) systems. Satellites in the system are arranged in six orbital planes with four satellites each. Therefore, there are all 24 active satellites. Each satellite is transmitting its own information such as position and time. For the receiver, in order to determine its own position, it will need data from at least four different satellites. For GPS system, there are two L bands carrier frequencies, L1 (1575.42MHz) and L2 (1227.6MHz), to broadcast of navigation data and ranging code from the satellites to the receiver by the use of Code Division Multiple Access (CDMA). Only L1 carrier frequency is used by the Standard Positioning Service (SPS) which is available to all users [1]. For any GPS receiver, two main synchronization processes, acquisition and tracking, are needed. Frequency and phase are the two main parameters that are needed to decode the GPS signal and get access the navigation data. In actual cases, the satellites and the receivers are not stable.
This is the main reason of causing Doppler effects on both carrier frequency and code phase. This may cause the receivers to loose the satellite signal. The maximum Doppler frequency of dynamic receiver is about ±10kHz. The purpose of acquisition is to identify all satellites visible to the user. If a satellite is visible, the acquisition must determine the two properties of the signal such as frequency and code phase. They are the rough estimated values with uncertainty due to the Doppler shifts. These uncertainties have to be corrected by using the two tracking loops: code tracking and carrier tracking. Therefore, tracking process is the most essential process of the whole GPS receiver [1].
II.
S
OFTWAREGPS
R
ECEIVERA
RCHITECTUREThe complete architecture of software GPS receiver includes hardware portion such as an antenna, low noise amplifier, filter, down-converter from RF (Radio Frequency) to IF (Intermediate Frequency), analog to digital converter (ADC) and software portion for signal processing such as acquisition, tracking and navigation. In this paper, N-FUELS signal simulator is used instead of the real front-end device. Acquisition and tracking are synchronization processes of the receiver and their accuracy is very important for pseudorange calculation and positioning. This paper focus on the tracking modules to measure the tracking error [2]. The complete architecture of a software GPS receiver is shown in Fig. 1.
N-FUELS Signal Simulator
RF Front End Analog- to- Digital
Conversion ( ADC)
-Acquisition of GPS signal Antenna
Tracking of GPS Signal Navigation
Module User
Position
based Portion of Receiver Software
Fig. 1 Architecture of Software GPS Receiver _____________________________
Win Kay Khaing, Zaw Min Naing, Su Su Yi Mon, Aung
Soe Khaing, Hla Myo Tun, Sao Hone Pha
Electronic Engineering Department, Mandalay
Technological University Myanmar,
[email protected], [email protected]
Deputy Director General, Myanma Scientific and
Technological Research Department, Myanmar,
[email protected], [email protected],
[email protected], [email protected]
Department of Remote Sensing and GNS Lab,
354
III.
GPS
S
IGNALA
NDT
RACKINGL
OOPM
ODELA. GPS Signal Model
GPS signal is composed of three main components: carrier, ranging (PRN) code and navigation message. Ranging code is combined with the binary navigation message by using modulo-2 addition. The composite binary signal is then modulated on the carrier by BPSK (Binary Phase Shift Keying) modulation. The RF signal is down-converted and digitized to the digital IF signal. This signal contains the Doppler frequency and relative code shift due to the effect of relative motion of satellite and receiver. The satellite signal model before the state of down-conversion is
) ) ( 2 cos( ) ( ) ( 2 ) (
, t Pc t d t f f t
yRFi R i i RF d (1)
and after the state of down-conversion is
) ) ( 2 cos( ) ( ) ( 2 ) (
, t Pc td t f f t
yIFi R i i IF d (2)
After digitizing, the model is as follow [2]:
) ) ( 2 cos( ) ( ) ( 2 ] [
, n Pc nT d nT s f f nT
yIFi R i s i RF d s (3)
Where τ is delay, PR is signal power, fd is Doppler frequency and Ts is sampling time. Acquisition module searches for approximate values of (
, fd) [2]. The raw GPS signal from N-FUELS simulator has intermediate frequency of 4.152MHz which is suitable for software receivers. The sampling frequency is at least twice of the IF values. In soft-GPS receivers, the best choice for sampling frequency should be at least four times of the IF values. Thus, the value of sampling frequency is 16.368MHz and quantization value is eight bits per sample. Since the sampling frequency is 16.3676MHz, 16367 samples are correlated at a time corresponding to 1ms. Fig. 2 shows a raw GPS signal output from the signal simulator.0 50 100 150 200 250 300 350 400 450 500
-8 -6 -4 -2 0 2 4 6
8 Received signal samples
Sample index
S
ig
n
a
l
am
p
lit
u
d
e
Fig. 2 Raw GPS Signal, N-FUELS Signal Simulator Output
B. Tracking Loop Model
After the acquisition process is accomplished, the receiver enters the tracking mode. Signal tracking is used to generate precise replicas of the incoming code and carrier. The local code and carrier can be correctly generated only if the signal parameters are correctly tracked. Delay Lock Loop (DLL) is used to track the code phase and Phase Lock Loop (PLL) or Frequency Lock Loop (FLL) is used to track carrier phase or frequency, respectively. Tracking is made of an iterative procedure during which the carrier loop and the code loop cooperate to provide the best estimate of the Doppler frequency and of the code delay. The output of the carrier
loop is used to remove the modulation (carrier wipe-off) for the code estimator. The output of the code loop is used to cancel the code signal (code wipe-off) for the carrier estimator. Fig. 3 shows code wipe-off and carrier wipe-off of tracking loop.
Acquisition System
Code Wipe-off
Fine Frequency Estimator (PLL/
FLL)
Carrier Wipe-off
Fine Delay Estimator (DLL) Clean Sinewave
(cw)
Clean Code
Syncr.cw
Syncr.code ]
[n yIF
Fig. 3 Code Wipe-off and Carrier Wipe-off of Tracking Loop
Fig.4 shows a high-level block diagram of a typical global navigation satellite system receiver tracking loop.
NCO
90degree
PRN Code Generation Filter Integrate and Dump
Code Loop Discriminator
Integrate and Dump
Integrate and Dump Integrate and Dump Integrate and Dump
Integrate and Dump E
P
L
E P
L Incoming
Signal
IE
IP
IL
QE
QP
QL
Carrier Loop Discriminator Carrier Loop Filter
Fig. 4 Block Diagram of a Typical GNSS Receiver Tracking Loop
C. Code Tracking Loop
TABLEI
NON-COHERENT DLLDISCRIMINATOR ALGORITHMS
No Discriminator
Algorithms Discriminator or S-curve 1 Dot product power ∑(IE - IL)IP + ∑(QE - QL)QP
2 Early minus late
power ∑[(IE)
2
+(QE) 2]- ∑[(I
L) 2
+ (QL) 2
] 3 Early minus late
envelope
2 L Q 2 L I 2 E Q 2 E I
4 Early minus late envelope normalized
2 L Q 2 L I 2 E Q 2 E I 2 L Q 2 L I 2 E Q 2 E IWhere IE, IL, IP, QE,QL,andQP represent the early, late and prompt correlation values for the in phase and quadrature components of the received signal.
D. Carrier Tracking Loop
An exact carrier wave replica needs to be generated in order to demodulate the navigation data successfully. Phase Lock Loop (PLL) or Frequency Lock Loop (FLL) is used to track the carrier wave of the GPS signal. Modified PLL, Costas Loop, is used in this research. The reason is that it is insensitive to 180º phase shifts due to navigation bit transitions. The block diagram of the Costas Loop used for carrier tracking loop is shown in Fig. 5. Carrier loop discriminator is used to find the phase error on the local carrier wave replica.
k k I Q 1 tan
(4)
Where φ is the phase difference between the phase of the input signal and the phase of the local replica of the carrier phase. Qk is the quadrature arm value of the kth satellite. Ik is the inphase arm value of the kth satellite. The arctan discriminator in Equation (4) is the most precise one in other possible Costas discriminators.
NCO Carrier Generator 90degree Carrier Loop Filter Carrier Loop Discriminator Incoming Signal PRN Code Q
I Low Pass
Filter
Low Pass Filter
Fig. 5 Block Diagram of Costas Loop used for Carrier Tracking Loop
E. S-Function
In order to analysis the tracking loop performance, the S -function (S-curve) is introduced. It is the result of the subtraction of the „early‟ and „late‟ versus the estimated delay error ddˆ. The S function for equally displaced correlator
(the classical one -chip spacing as well as the narrow correlator) for „early‟ and „late‟ is defined as:
) 2 / _ ( ) 2 / ( )
( RC dsTC RC dsTC
S (5)
Where ds is the early-late spacing and Tc is the chip duration. This S function is only for LOS (Line of Sight) signal. S-function can dynamically describe the tracking loop performance. The tracking process works on the linear region of the S-curve towards the zero crossing and a negative derivative to guarantee the convergent of the process:
0 ) ( ) (
S (6)
Fig. 6(a) describes correlations with the three local replicas and Fig. 6(b) shows S-curve which represents this three correlations values.
Rc(Early)
Rc(Prompt)
Rc(Late)
Chip Samples C o rr el at io n V al u es Chip Samples D is cr im in at o r O u tp u t 1 -1 Linear Region 0 (a) (b)
Fig. 6 (a) Correlations with the Three Local Replicas and (b) S-curve which represents the Three Correlations Values
IV.
S
IMULATIONR
ESULT OFS
OMEI
MPACTS OND
ISCRIMINATORF
UNCTIONSThe impacts of some parameters on DLL discriminators such as number of samples per chip, early-late spacing, different C/ No values where C denotes the signal power and No is the noise spectral density, and front-end device are very important for the software-GPS receivers.
A. The Impact of Numbers of Samples per Chip on Discriminator Function
0 5 10 15 20 25 30 35
-1 -0.8 -0.6 -0.4 -0.2 0 0.2 0.4 0.6 0.8 1
Four S curves
Product Power Envelope EnvelopeNor
356
0 5 10 15 20 25 30
-1 -0.8 -0.6 -0.4 -0.2 0 0.2 0.4 0.6 0.8 1
Four S curves
Product Power Envelope EnvelopeNor
(b)
Fig. 7 S curves of GPS signal with difference N (a) N=16 (b) N=32
The results of ideal case with different N (number of samples per chip) are shown in Fig. 7(a) and 7(b). According to the S-curves above, it can conclude that the smaller the values of N, the higher the slope of the linear region of S-curves. This means that the performance of the loop degrades.
B. The Impact of Early-Late Spacing on Discriminator Function
0 5 10 15 20 25 30 35
-1 -0.8 -0.6 -0.4 -0.2 0 0.2 0.4 0.6 0.8 1
Four S curves for Early-Late Spacing 0.5
No of Samples
D
is
c
ri
m
in
a
to
r
O
u
tp
u
t
V
a
lu
e
Product Power Envelope EnvelopeNor
Fig. 8 Comparison of Different DLL Discriminators Output for Early-Late Spacing 0.5
0 5 10 15 20 25 30 35
-1 -0.8 -0.6 -0.4 -0.2 0 0.2 0.4 0.6 0.8 1
Four S curves for Early-Late Spacing 0.25
No of Samples
D
is
c
ri
m
in
a
to
r
O
u
tp
u
t
V
a
lu
e
Product Power Envelope EnvelopeNor
Fig. 9 Comparison of Different DLL Discriminators Output for Early-Late Spacing 0.25
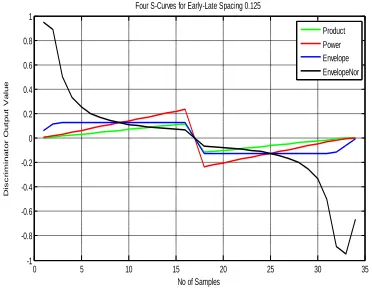
0 5 10 15 20 25 30 35
-1 -0.8 -0.6 -0.4 -0.2 0 0.2 0.4 0.6 0.8 1
Four S-Curves for Early-Late Spacing 0.125
No of Samples
D
is
c
ri
m
in
a
to
r
O
u
tp
u
t
V
a
lu
e
Product Power Envelope EnvelopeNor
Fig. 10 Comparison of Different DLL Discriminators Output for Early-Late Spacing 0.125
Fig. 8, 9 and 10 are produced from ideal ACFs, and the spacing between the early, prompt and late are 0.5, 0.25 and 0.125 respectively. The noise bandwidth in the delay lock loop is determined by the space between the early, prompt, and late codes. If the spacing is larger than 0.5, the DLL can handle wider dynamics and more noise robust. On the other hand, DLL with a smaller spacing would be more precise. The discriminator spacing parameter can be adjusted in modern GPS receivers while the receiver is tracking the signal.
C. The Impact of C/No values on Discriminator Function
0 5 10 15 20 25 30 35
-1 -0.8 -0.6 -0.4 -0.2 0 0.2 0.4 0.6 0.8 1
Four S curves
No of Samples
D
is
c
ri
m
in
a
to
r
O
u
tp
u
t
V
a
lu
e
Product Power Envelope EnvelopeNor
Fig. 11 Comparison of Different DLL Discriminators Output for
C/No = 36 dBHz
0 5 10 15 20 25 30 35 -1
-0.8 -0.6 -0.4 -0.2 0 0.2 0.4 0.6 0.8 1
Four S curves
No of Samples
D
is
c
ri
m
in
a
to
r
O
u
tp
u
t
V
a
lu
e
Product Power Envelope EnvelopeNor
Fig. 12 Comparison of Different DLL Discriminators Output for
C/No = 50 dBHz
D. The Impact of Front-end Filter on Discriminator Function
0 5 10 15 20 25 30 35 -0.8
-0.6 -0.4 -0.2 0 0.2 0.4 0.6
Four S curves
Product Power Envelope EnvelopeNor
Fig. 13 Comparison of Different DLL Discriminators Output for C/No=36 dBHZ without front-end
0 5 10 15 20 25 30 35
-0.6 -0.4 -0.2 0 0.2 0.4 0.6 0.8
Four S curves
Product Power Envelope EnvelopeNor
Fig. 14 Comparison of Different DLL Discriminators Output for C/No=36 dBHZ with front-end
By looking at the Fig. 13 and Fig. 14 above, it is known that using the front-end makes the S-curves smoother and the effect of noise is reduced.
V.
T
RACKINGR
ESULTSThe code and carrier tracking loops are working coherently and being mutually dependent on each other. Instead of
dividing these two functionalities into two different blocks, they are merged into a combined code and carrier tracking loop. In the combined code and carrier tracking loop, the carrier tracking, Costas loop (PLL), is followed by code tracking, early-late tracking loop (DLL). For the code loop discriminator, the early and late outputs of the in-phase and quadrature arm are used. The prompt outputs of both In-phase and quadrature arm are used in the carrier loop discriminator. The prompt output of the In-phase arm also provides the navigation data. Tracking module processes its function by using acquisition results which is stored in a certain structure and GPS sample data at the start condition. Each tracking channel needs acquisition results such as satellite PRN number, code delay
value and Doppler frequency. Moreover, output of
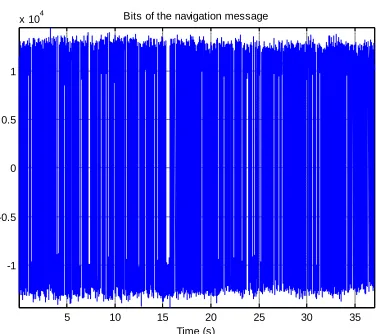
discriminator is used for tracking loop feedback as input, and stored in memory for navigation module. The results from the complete tracking loop by using the real GPS signal are shown in the following figures. Fig.15 shows the plotting result of I-Phase and Q-I-Phase arms of the real GPS signal. Fig. 16 and 17 describe the PLL and DLL discriminator outputs which are already filtered. Fig. 18 mentions the correlation results of the early, prompt and late signal replicas. An important output from the tracking module is the navigation data bits. Fig.19 shows the plot of navigation data bits in the In-Phase arm of the real GPS signal.
-1 -0.5 0 0.5 1
x 104 -14000
-12000 -10000 -8000 -6000 -4000 -2000 0 2000 4000 6000
Discrete-Time Scatter Plot
I prompt
Q
p
ro
m
p
t
Fig. 15 Plot of I-Phase and Q-Phase of the GPS Signal
5 10 15 20 25 30 35
-10 0 10 20 30 40 50 60
Time (s)
A
m
p
lit
u
d
e
Filtered PLL discriminator
358
5 10 15 20 25 30 35
-6 -5 -4 -3 -2 -1 0 1 2 3
Time (s)
A
m
p
lit
u
d
e
Filtered DLL discriminator
Fig. 17 Filtered DLL Discriminator Output
Fig. 18 Correlation Results of the Early, Prompt and Late Signals
5 10 15 20 25 30 35
-1 -0.5 0 0.5 1
x 104 Bits of the navigation message
Time (s)
Fig. 19 Plot of Navigation Bits in In-Phase Arm
VI.
C
ONCLUSIONThis paper has been presented the implementation of code and carrier tracking loops for software GPS receivers. All of the experiments have been done with the help of MATLAB software Environment and N-FUELS signal simulator. Code and carrier tracking process is the most important synchronizing process. The performance of the tracking loop depends on the output of the code loop discriminator and carrier loop discriminator. The effects of sampling frequency, the Early-Late spacing parameters, different C/N0 ratios and front-end filter on the discriminator output are discussed and analysed. According to the analysis, the smaller Early-Late spacing is more precise and more suitable for software GPS receivers. Moreover, the larger C/No value is more precise for
delay lock loop of software GPS receivers. Results which have satisfactory precision can be achieved if the value of C/No is above 36dBHz. According to the above results, the best chosen parameters are 32 samples per chip, 0.125 chip spacing, and 50 dBHz for C/No values. The test results using the real GPS signal are also mentioned. The sampling frequency of the real signal is 38.192e6 MHz. The chosen tracking loop parameters are 0.125 spacing and 0.7 of damping ratio for loop filters. This concepts of signal processing can be applied in any software GPS receiver design. They provide the best results for further processing such as bit synchronization, frame synchronization, navigation message decoding and positioning analysis.
A
CKNOWLEDGMENTThe author wishes to express deep thanks to her supervisor Prof. Dr. Zaw Min Naing, Deputy Director General, Myanma Scientific and Technological Research Department, for his great supervision and encouragement. The author would like to express her sincere gratitude to her co-supervisors Dr. Su Su Yi Mon and Dr. Aung Soe Khaing and next to Dr. Hla Myo Tun, Head of Electronics Engineering Department, Mandalay Technological University, for their suggestions and true-line guidances. Moreover, the author wishes to show her heartfelt appreciation to Dr. Sao Hone Pha, Department of Remote Sensing and GNS Lab, Yangon Technological University, for what his truely great guidance.
R
EFERENCES[1] “Digital Satellite Navigation and Geophysics”, A Practical Guide with GNSS Signal Simulator and Receiver Laboratory by IVAN G. PETROVSKI, IP-Solutions, Japan TOSHIAKI TSUJII Japan, Aerospace Exploration Agency (JAXA).
[2] “Introduction to Global Navigation Satellite Systems” edited by: Fabio Dovis, Paolo Mulassano.
[3] “Theoretical Analysis of S-Curve for GNSS System,” by Maristella Musso, Gianluca Gera, Carlo S. Regazzoni, Department of Biophysical and Electronic Engineering (DIBE), University of Genoa Italy and CNIT-DIBE Unit University of Genova.
[4] “A Software-Defined GPS and Galileo Receiver: Single-Frequency Approach,” by Kai Borre, Aalborg University and Dennis Akos, University of Colorado.
[5] “The GPS Code Software Receiver at Aalborg
University,” by Nicolaj Bertelsen, Kai Borre, Peter Rinder, at Danish GPS Center, Aalborg University, Niels Jernes
Vej 14, DK-9220 Aalborg Ø, Denmark,
{nb,borre,rinder}@gps.aau.dk.
[6] “Implementation of a Software GPS Receiver,” by C. Ma,
G. Lachapelle, and M.E. Cannon, Position, Location And Navigation (PLAN) Group, Department of Geomatics Engineering, University of Calgary, Calgary, Alberta, Canada, T2N 1N4.
[7] Dinesh MANANDHAR, Yongcheol SUH and Ryosuke
Receiver,” Center for Spatial Information Science, The University of Tokyo, 4-6-1 Komaba, Meguro-ku, Tokyo, 153-8505 Japan.
[8] R. Arsinte, “A Software Model for GPS Receiver Signal Processing Blocks Used in Educational Environment,” Technical University of Cluj-Napoca, Communications Department, 26-28 Baritiu Str, Cluj-Napoca, Romania, [email protected].
[9] “Simulation of Code Tracking Error Variance with Early Late DLL for GALILEO/GPS Bandlimited Receivers,” by Ondrej Daniel, Martin Ernesto Orejas, Juraj Gazda, Honeywell Advanced Space Technology, Tuřanka 100, Brno, Czech Republic, Dept. of Multimedia Comm., Technical University of Košice, Letná 9, Košice, Slovakia,
[10] Hui Hu, and Lian Fang, “Signal Search and Acquisition Algorithms for Software GPS Receiver,” Proceedings of the 2009 International Symposium on Information Processing (ISIP‟09), Huangshan, P.R. China, August 21-23, 2009, pp. 013-016.
[11] “GPS Satellite Signal Acquisition and Tracking,” by Fredrik Johansson, Rahman Mollaei, Jonas Thor, Jorgen Uusitalo, August 21, 1998.
[12] “Fundamentals of Global Positioning System Receivers: A Software Approach,” by James Bao-Yen Tsui, Copyright @ 2000, John Wiley & Sons, Inc. Print ISBN0-471-38154-3, Electronic ISBN0-471-20054-9.
[13] “IF GPS Signal Simulator Development and Verification,”
(URL:
http://www.geomatics.ucalgary.ca/links/GradTheses.html) by Lei Dong, December 2003.
[14] “Signal Acquisition and Tracking for a Software GPS Receiver,” by Sophia Y. Zheng, February, 2005, Blacksburg, Virginiaa.