Licensed under Creative Common Page 732
http://ijecm.co.uk/
ISSN 2348 0386
IS THERE ANY CONNECTION BETWEEN POVERTY
AND INFORMALITY?
Enida Kume
Ministry of Education and Sports, Tirana, Albania [email protected]
Brunela Trebicka
University “Aleksandër Moisiu”, Durrës, Albania
Abstract
The purpose of this paper is to examine the significance of the link between "informality" and
poverty in Albania. The paper argues that what is relevant for the poor is not so much the
informal sector but the fact that informality is a way to cope and survive. Poverty and informal
employment are seen as correlated phenomena. Many empirical studies have shown that
informal employment has a causal impact on household poverty, mainly through low wages.
Lately the researchers have study the relationship between poverty and informality. However,
existing studies have relied upon cross sectional data and static econometric models. In this
paper this connection between poverty and informality is based on a bivariate dynamic random
effect probit model and recent panel data from Albania. The results show that poverty and
informal employment are highly persistent processes at the individual level.
Keywords: Poverty, Informal Economy, Informal Employment, Albania, Probit Model
INTRODUCTION
Licensed under Creative Common Page 733 The fact that a large part of the informal workers are poor, and vice versa, supports the view that poverty and informality are connected. Poverty leave that part of individuals or those households below a certain income line. Informality, on the other side, includes a large fraction of workers with low earnings. Hence, low incomes appear as the link relating informality and poverty. Although there is some consensus around this asseveration there is still scarce evidence about the interactions between the two phenomena.
The objective of this study is to show if there is a connection between poverty and informal employment at the individual level.
LITERATURE REVIEW
Several studies are done on informal economy. (Schneider, 2002) has estimated the informal economy in 110 countries. In Albania there have been some studies on the measurement of the size of informal economy. (Ruli, 2003) measured it by direct method (questionnaire). Some other studies have used macroeconomic model to estimate the informal economy. Albania on 1992 changed the form of the economy, from a centralized one to an open market economy. The regulation and Law were not prepared for this change. All these made it easy for informal sector to develop and along with this and the employment in the informal sector. Also frequent changes on the regulation for employs regarding the social security payment and taxes favor the employment in informal sector. The issue of labor Law and labor policies have not being adequately enforced. But employment in informal sector does not only mean unregistered workers, but also workers that are registered only as workers with the minimum salary, the payroll taxes paid by employers are not correlated with the payroll list of the employees, making it difficult to identify tax fraud by employers through the nonpayment contributions and producing negative effects on the future pensions of employees. Albania introduced major Labor inspection administration in 2009. The national labor opens an internal audit department to increase effectiveness. Albania has yet to establish a Labor Court in which labor disputes could be handled and through which labor rights and working conditions could be challenged and upheld. Changes in the labor regulations also seem to have exerted some influence on the high informality rate.
Licensed under Creative Common Page 734 and represents the borderline between the poor and the non poor (WB, n.d.). According to UNDP (United Nations Global Development Network), poverty is the inability to spend 5722 lek per month per capita in 2008 and this is assumed as the absolute poverty line (Haughton & Khandker, 2009). The relative poverty lines reflect the scale of absents of which a household or an individual suffers in relation with the incomes of the other part of the population.
In general results show that poverty has connection with the change status of employment. (Amuedo, 2004) came to conclusion that the poverty in household leads to employment on informal sector. Also he showed that having a job in the informal sector increases the possibility of becoming poor. (Chen Martha, Vanek Joann, 2006) showed in their study that informality is the main cause of poverty.
METHODOLOGY
In this study we analyze the relationship between poverty and informal economy. we use the probit model for the joint probability. The Latent Variable ŷ1it gives us the poverty model for an
individ “i” in time "t". The model of poverty is as follow:
ŷ1it= xitβ1 + y1i (t−1)δ1,1+ y2i (t−1)δ1,2 + c1i+ u1it
The other Latent Variable y2it that shows the risk of working in informal sector. The model of
informal employment is given:
ŷ2it= xitβ2 + y1i (t−1)δ2,1+ y2i (t−1)δ2,2 + c2i+ u2it
where: yjit = 1 when ŷjit > 0 and j =1,2 and t = 2,3 ... T
y1it is a dummy variable that takes the value of one if the individual is at risk of poverty, and zero
in otherwise
y2it is an dependent variable-- dummy indicators (that take the value one or zero, one when the
individual is working in the informal sector)
xit is a vector of independent variables that in our model we assume that these variables are
exogenous.
β1 and β2 are the coefficients that correspond to vector of parameters that we will calculate
c1 and c2 individual probabilistic effect
u1 and u2 are the error terms that we assume to be independent over the time and follow the
bivariante normal distribution, where the mean is zero and the variance is v; and
y1i(t-1) is the “answer” that the same person gave on the period t-1 in the case of poverty and
y2i(t-1) is the “answer” that the same person gave on the period t-1 in the case of working in
informal economy.
Licensed under Creative Common Page 735 Therefore, we can establish the causal impact of past poverty on current poverty of past experiences in the informal sector on current probability of working in the informal sector, once the confounding impact due to unobserved heterogeneity is accounted.
To separate the two unobserved heterogeneity and true state dependence, the lagged dependent variable, y1i(t-1) , is included in the poverty equation and the lagged dependent
variable , y2i(t-1) is included in the informal employment equation. The lagged variables are
included in the poverty equation and in the informal employment equation. including this variables in both equations to understand whether the correlation among the data of dummy variables is due to unobserved heterogeneity or it states the dependence between poverty and informality.
To estimate the model we extend to the bivariate case the simple approach proposed by (Wooldridge, 2005) for univariate dynamic random effects probit models. Wooldridge proposes a Conditional Maximum Likelihood estimator that considers the distribution conditional on the initial values and the observed history of strictly exogenous explanatory variables. To generalize this approach in the context of our bivariate probit model, we specify the individual specific effects c1 and c2 given the initial conditions.
Consistent estimates of the model’s parameters can be obtained by Conditional
Maximum Simulated Likelihood methods.
Finally, we have to calculate the model on the balance panel. According to Wooldridge one may be worried that the estimator could potentially exacerbate attrition and sample selection present in the data. In fact, this is not the case, since Wooldridge’s method has some
advantages in facing selection and attrition problems. In particular, as explained in (Wooldridge, 2005) (page 44), it allows selection and attrition to depend on the initial conditions and, therefore, it allows attrition to differ across initial levels of poverty and informality status. In particular, individuals with different initial statuses are allowed to have different missing data probabilities. Thus, we consider selection and attrition without explicitly modeling them as a function of the initial conditions.
As a result, the analysis is more complicated and it compensates the potential loss of information from using balanced panel. Also, we do not take into account the initial level functions of explanatory variables. In this way, using sampling weights can lead us to not be very efficient.
Licensed under Creative Common Page 736 Table 1: Demographic Profile
Individuals Number Percentage
Age 2231 100.00%
18-29 years old 882 39.53%
30-49 years old 598 26.80%
> 50 years old 751 33.66%
Married status
Married 1265 56.70%
Unmarried 966 43.30%
household size
less or equal than 4 members 1754 78.62%
more than 4 member 477 21.38%
Education level
Low Education 326 14.61%
Medium Education 868 38.91%
High Education 1037 46.48%
Firm size
Small firm 1574 70.55%
Big Firm 657 29.45%
ANALYSIS AND RESULTS
We calculate the dynamic model of poverty and informality. The vector xit presents the
individuals with different characteristics:
- Age. We put divide the individuals in three groups: (1) 18-29 years old (that is our reference group)
- Marital status (zero if not married),
- Household size. We classify them in two groups, less than 4 members in a family and more than 4 members in the family
- Education. Dummies for medium education and high education where the reference category is low education,
- Firm size. Dummies for large size firms where reference is Small size). These variables are shown as time constant variables.
The joint estimation of the model equations is necessary: ρ is positive (0.3725) and statistically
significant.
This tells us that individuals that drive into poverty and into informal sector employment have common elements.
Licensed under Creative Common Page 737 then expect that this estimator overestimate the importance of state dependence, as the coefficient of the lagged dependent variable absorbs part of the effect that is instead due to (uncontrolled) unobserved heterogeneity.
In both equations, the equation of poverty and equation of informal employment, the same explanatory variables are used. The variables included on xit do not replace the main
focus of the analyses. This lies instead in the interrelated dynamics of poverty and informal sector employment, which is reflected in the estimates of the lagged indicators for both dependent variables.
We estimate the household heads for poverty. The estimation are shown in table 2. The joint estimation of the model (both equations) is p that has a positive sign and is statistically significant in all the xi he joint estimation of the model equations is necessary: ρ is
positive and statistically significant in all the specifications (both for male and female household heads).
Therefore, the shocks at a moment of time, lead individuals into poverty and into informal job sector.
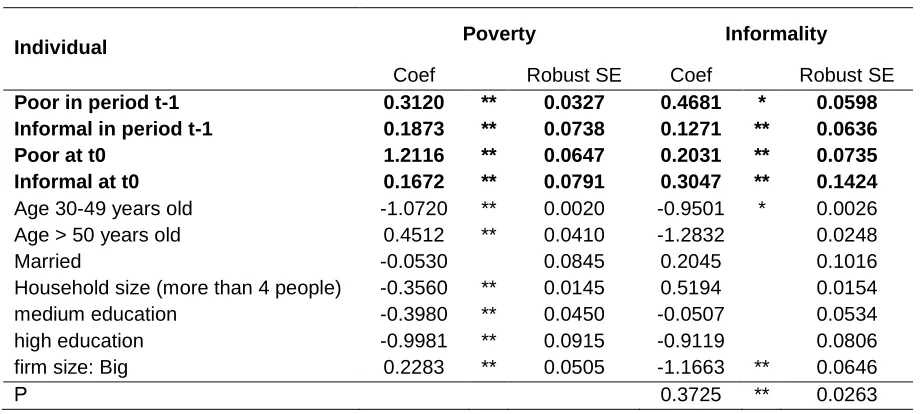
Table 2: Model Estimation
Individual Poverty Informality
Coef Robust SE Coef Robust SE
Poor in period t-1 0.3120 ** 0.0327 0.4681 * 0.0598
Informal in period t-1 0.1873 ** 0.0738 0.1271 ** 0.0636
Poor at t0 1.2116 ** 0.0647 0.2031 ** 0.0735
Informal at t0 0.1672 ** 0.0791 0.3047 ** 0.1424
Age 30-49 years old -1.0720 ** 0.0020 -0.9501 * 0.0026 Age > 50 years old 0.4512 ** 0.0410 -1.2832 0.0248
Married -0.0530 0.0845 0.2045 0.1016
Household size (more than 4 people) -0.3560 ** 0.0145 0.5194 0.0154
medium education -0.3980 ** 0.0450 -0.0507 0.0534
high education -0.9981 ** 0.0915 -0.9119 0.0806
firm size: Big 0.2283 ** 0.0505 -1.1663 ** 0.0646
Ρ 0.3725 ** 0.0263
We found that the lag coefficient is statistically significant and is estimated 0.312 and the lag effect is 0.1873 in the equation of poverty.
On the equation of employment of informal sector we estimate the lag of 0.1271 and the cross effect is 0.468.
Licensed under Creative Common Page 738 other equation, the coefficient of employment in informal sector initially is 0.304 that is bigger than coefficient of the lag 0.1271.
The values of coefficients on time zero (initial period) condition and on the lag time in the equation of informality reveal the segmented nature of labor market. These estimates show that the probabilities of leaving informality are very low. On the other side, the values of the similar coefficient in the equation of poverty may be interpreted as indicative of a more flexible model. This is expected since the poverty is related to macroeconomic fluctuations.
People with education level of medium to high have a lower risk of being poor than people with low education. Age, that in our model we used it in a linearly form for simplicity, has a significant effect on income poverty. Age have a negative and statistically significant effect on income poverty, indicating the increased command on economic recourses as the individual ages. However, age has an opposite effects on informal sector employment indicating that older workers have more possibilities of working in the informal sector than younger workers.
In our model we divided individuals in three groups according to age. The coefficient of the second group (people 30-49 years old) is negative (-1.0728).
Age have an opposite effects on informal sector employment indicating that older workers have more possibilities of working in the informal sector than younger workers.
The number of working members in the household decreases the probability of being in poverty, while the average number of working members increases the probabilities of working in the informal sector. A possible explanation for this correlation is the presence of barriers that limit access to formal jobs for spouses and other members. It may reflect also strong social networks in the informal sphere. Conversely, the risk of poverty increases with the number of the household members. Individuals working in small firms have both high probabilities of being poor and being employed in the informal sector. This is a common feature of Albania labor markets where small firms tend to have low productivity and concentrate a great proportion of nonregistered workers. Finally, differences in the probabilities of being poor and/or employed in the informal sector are observed across individuals working in different sectors and different regions.
For both equations, the lagged dependent variables concerning poverty and informal sector employment are significantly positive. To evaluate the relevance of the dynamics in the model, we estimate the predicted probabilities of being in poverty, and for working in the informal sector, for various lagged statuses of poverty-informal sector employment.
Licensed under Creative Common Page 739 Married individuals have 1.227 times less than single individuals to be in informal jobs.
Individuals that have medium education have 1.052 times less possibility to be in informal sector than individuals that have low education and individuals with high education have 2.489 times less possibility to be in informal sector.
Household size more than 4 members have 1.681 more possibility to be in informal sector than household size of less than 4 members.
Individuals that work on small size firms have 3.2 times more possibilities to be in informal sector than individuals that work on big firms.
The age group II (30-49 years old) has 2.92 times less possibility to be in poverty than age group I (18-29 years old) and age group III (older than 50 years old) has 0.451 times more possibility to be in poverty that group one.
Married individuals have 1.054 times less possibility than the single individuals to be in poverty.
Individuals that have medium education have 2.01 times less possibility to be in poverty than individuals that have low education and individuals with high education have 2.715 times less possibility to be in poverty.
Individuals that live in Houses of more than 4 members have 1.427 less possibility to be in poverty than household size of less than 4 members.
Individuals that work on small size firms have 1.256 times more possibilities to be in poverty than individuals that work on big firms.
CONCLUSION
In this paper we studied the determinants of poverty and informal employment using recent panel data from Albania. We showed a casual relationship between household poverty and household heads’ employment in the informal sector, a relationship that has attracted the
interest of both academic researchers and policy makers. The analysis uses a bivariate dynamic random effect probit model to account for the endogeneity of household poverty and household heads’ employment in the informal sector. Our model provides a means of assessing the
persistence over time of poverty and informal employment at the individual level, while controlling for both observed and unobserved determinants of the two processes.
Furthermore, the model explains the potential existence of the previous of poverty and informality. These dynamic effects can be an important determinant for the continuity between poverty and informality.
Licensed under Creative Common Page 740 that firms would prefer to register younger workers instead of older ones and that older people would exhibit a larger entrepreneurial spirit that younger workers.
The results show that there is a connection between poverty and informality in Albania. Two processes are happening in dynamics of labor market. The jobs in the informal sector are leaded from the demand of employment from the household individuals that find it difficult to make enought money in the formal economy to cover their house expense.
On the other side, the informal sector hides its activity from governemnt and in order to do that hires individuals that are in poverty. This conections is statisticaly significant in our model.
REFERENCES
Amuedo, C. (2004). Determinants and Poverty Implications of Informal Sector Work in Chile. Economic Development and Cultural Change, 52(2), 347–368. doi:10.1086/380926
Cammack, P. (2004). What the World Bank means by poverty reduction, and why it matters. New Political Economy, 9(2), 189–211. doi:10.1080/1356346042000218069
Chen Martha, Vanek Joann, H. J. (2006). Informality, Gender and Poverty. Economic and Political Weekly, May 27, 2131–2139.
Haughton, J. H., & Khandker, S. R. (2009). Handbook on Poverty and Inequality. ReVision. doi:http://dx.doi.org/10.1596/978-0-8213-7613-3
INSTAT. (2004). “Niveli i jetesës dhe pabarazia në Shqipëri.” Tirana.
Ruli, G. (2003). Characteristics of Informal Sector Development in Albania. The Informal Economy in the EU Accession Countries: Size, Shape, Scope, Trends and Challenges., 239–247.
Schneider, F. (2002). Size and measurement of the informal economy in 110 countries around the world. Journal of Economics, 1, 1–50.
WB. (n.d.). No Title. Retrieved from www.worldbank.org