http://www.sciencepublishinggroup.com/j/ijtam doi: 10.11648/j.ijtam.20180406.11
ISSN: 2575-5072 (Print); ISSN: 2575-5080 (Online)
Preemptive Goal Programming for Nutrition Management
Optimization
Fitra Anugrah
1, Syamsudhuha
1, Yosza Dasril
2, Moh Danil Hendry Gamal
11
Department of Mathematics, Faculty of Mathematics and Natural Sciences, University of Riau, Pekanbaru, Indonesia 2
Center for Telecommunication Research and Innovation, Faculty of Electronic and Computer Engineering, Technical University of Malaysia Malacca, Malacca, Malaysia
Email address:
To cite this article:
Fitra Anugrah, Syamsudhuha, Yosza Dasril, Moh Danil Hendry Gamal. Preemptive Goal Programming for Nutrition Management Optimization. International Journal of Theoretical and Applied Mathematics. Vol. 4, No. 6, 2018, pp. 45-54.
doi: 10.11648/j.ijtam.20180406.11
Received: January 14, 2019; Accepted: February 7, 2019; Published: February 26, 2019
Abstract:
This paper presents the development of nutrition optimization model using preemptive goal programming to satisfy daily nutrient needs of adolescent. Objective function is designed to minimize the sum of percentage of nutrient’s deviations according to its priorities. Nutrient needs are determined according to Indonesian Recommended Dietary Allowances (AKG) incorporated as goal constraints. This paper consists of twenty sample of most frequently consumed food as decision variables with available budget for kinds of foods available in Riau Province as system constraints. The results obtained are foodstuff combinations with minimal percentage of deviations as optimal solution.Keywords:
Preemptive Goal Programming, Optimization, Nutrition Management1. Introduction
Adolescence is a critical period where rapid physical, biochemical and emotional changes occur. During this period there is a growth spurt, namely the peak height growth (peak high velocity) and weight (peak weight velocity). In addition, in adolescence there is also a peak growth of bone mass (peak bone mass) which causes nutrition needs to be very high even higher than other life phases [1].
Physical growth is directly related to nutrition. Optimal nutrition is a condition for achieving full growth potential. Dietary mistake in this period can result in delayed sexual maturity and can hold back or slow down growth. Nutrition in this period is also very important to help prevent chronic diseases related to adult eating patterns such as heart disease, cancer and osteoporosis [2].
However, the choice of food consumed is usually done intuitively. The limited budget available is also a problem in meeting the needed nutrition. Mathematical programming techniques can be applied to optimize the nutrients needed with the available budget, such as using goal programming.
Goal programming is a technique to solve the problem of multi-objective decision making in finding a set of satisfying solutions. The goal programming was first introduced by Charnes and Cooper [3], and further developed by Lee [4], Ignizio [5], Romero [6], Tamiz et al. [7] and others Li [8], Chang [9, 10] and Pal [11]. The aim of goal programming is to minimize deviations in achieving the goals.
Anderson and Earle [12] investigate the differences between linear programming models and goal programming models. The models are used to determine the nutrition of Thai people who satisfy their nutrition needs. The results of the linear programming provide minimal food cost as the objective function. The goal programming technique minimizes deviations from the recommended nutrition value as a goal function.
key nutrition value issues in the local diet.
Santika et al. [14] presents the application of a goal programming to determine the dietary pattern of children aged 9 to 11 months in Bogor Regency, Indonesia, which will meet the recommended nutrition value by considering acceptable eating habits and food costs. Indonesia was chosen because of the high evenness of malnutrition in children, mostly preschoolers and malnourished children.
Omotesho and Muhammad-Lawal [15] develop a goal programming model that would reduce food costs and meet the number of nutrients needed. The study was conducted in Nigeria, where data analysis found that 65.45% of rural households have inadequate nutrition. The results show that much less food can meet the amount of nutrients needed.
Pasic et al. [16-18] develop the application of linear programming, goal programming and weighted goal programming to optimize daily nutrition in accordance with the RNI (Recommended Nutrient Intake) recommended by the WHO (World Health Organization). This study produces a combination of foods that optimally refers to the eating needs of men and women. Some goals are defined to meet daily nutrition needs and minimal food costs every day.
Okubo et al. [19] show the application of linear programming in designing optimal food intake patterns to meet adult nutrition in Japan. Mathematically, the selected food combination satisfy all the nutrition constraints obtained for each sex and age group. The results show that dietary optimization using linear programming models can effectively convert nutrition value recommendations into realistic food intake patterns for populations in Japan.
Iwuji et al. [20, 21] apply the use of linear programming and weighted goal programming in determining optimal food combinations for hypertensive patients. Selected foods that meet Sodium level tolerance are limited to 1500 mg per day and different daily calorie levels are obtained using food samples from the DASH (Dietary Approaches to Stop Hypertension) diet plan table. The results show that the formulations for the DASH diet plan using weighted goal programming have smaller nutrition value deviations compared to the DASH diet formulation using linear programming.
In this paper the authors remove the assumption that all objectives are of the same weight. The author divides goals in several priority classes. Nutrients are satisfied based on a higher priority sequence, namely P1 then P2 and so on. The optimal selected food combination is based on the smallest percentage deviation from the nutrition value recommended by the Ministry of Health of the Republic of Indonesia through the Nutrition Adequacy (AKG) table and in accordance with the available budget. The goal of this working paper is to develop optimal food combinations to meet the daily nutrition needs of adolescents with preemptive goal programming.
2. Mathematical Model
In this paper the authors make six kinds of foodstuff
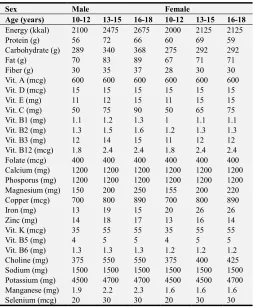
combinations to meet the nutrition needs of adolescents based on gender and age group. Decision variables are determined based on the type of food that is often consumed in Riau Province. The objective function is the smallest percentage deviation of selected nutrients by adding priority to the goal constraints. The objective constraints are based on daily nutrition recommendations (AKG) for boys and girls with the age group 10-12 years, 13-15 years and 16-18 years which are summarized in Table 1. Finally the authors add system constraints in the form of budgets and limits of maximum saturated fat, cholesterol and other nutrients so it is safe for consumption.
Table 1. Adolescent’s Daily Nutrition Need.
Sex Male Female
Age (years) 10-12 13-15 16-18 10-12 13-15 16-18
Energy (kkal) 2100 2475 2675 2000 2125 2125 Protein (g) 56 72 66 60 69 59 Carbohydrate (g) 289 340 368 275 292 292 Fat (g) 70 83 89 67 71 71 Fiber (g) 30 35 37 28 30 30 Vit. A (mcg) 600 600 600 600 600 600 Vit. D (mcg) 15 15 15 15 15 15 Vit. E (mg) 11 12 15 11 15 15 Vit. C (mg) 50 75 90 50 65 75 Vit. B1 (mg) 1.1 1.2 1.3 1 1.1 1.1 Vit. B2 (mg) 1.3 1.5 1.6 1.2 1.3 1.3 Vit. B3 (mg) 12 14 15 11 12 12 Vit. B12 (mcg) 1.8 2.4 2.4 1.8 2.4 2.4 Folate (mcg) 400 400 400 400 400 400 Calcium (mg) 1200 1200 1200 1200 1200 1200 Phosporus (mg) 1200 1200 1200 1200 1200 1200 Magnesium (mg) 150 200 250 155 200 220 Copper (mcg) 700 800 890 700 800 890 Iron (mg) 13 19 15 20 26 26 Zinc (mg) 14 18 17 13 16 14 Vit. K (mcg) 35 55 55 35 55 55 Vit. B5 (mg) 4 5 5 4 5 5 Vit. B6 (mg) 1.3 1.3 1.3 1.2 1.2 1.2 Choline (mg) 375 550 550 375 400 425 Sodium (mg) 1500 1500 1500 1500 1500 1500 Potassium (mg) 4500 4700 4700 4500 4500 4700 Manganese (mg) 1.9 2.2 2.3 1.6 1.6 1.6 Selenium (mcg) 20 30 30 20 30 30 Source: Minister of Health Regulation of the Republic of Indonesia, Number 75, 2013 concerning the Recommended Nutritional Adequacy Rate for Indonesian People.
2.1. Decision Variable Formulation
Decision variables represent daily food servings in grams in dietary designs. In this case the authors take a sample of 20 types of food ingredients which are often consumed in Riau Province as a decision variable. The decision variables xj is defined as the number of item j’s in unit of gram, where j
= 1, 2,..., 20 represent rice, potato, tofu, tempe, egg, peanut, chicken, beef, tuna (fish), tilapia (fish), palm oil, red chili, carrot, pak-choi, kale, spinach, papaya, banana, apple and avocado respectively.
2.2. Goal Constraint Formulation
priorities. The objectives to be achieved are as follows: a. Priority 1 (P1)
i. Goal 1 (energy):= Minimize under-achievement and overachievement of energy (kcal), g1.
b. Priority 2 (P2)
ii. Goal 2 (protein):= Minimize under-achievement of protein (g), g2.
iii.Goal 3 (carbohydrate):= Minimize under-achievement and overunder-achievement of carbohydrate (g), g3.
iv. Goal 4 (fat):= Minimize underachievement and overachievement of fat (g), g4.
c. Priority 3 (P3)
v. Goal 5 (fiber):= Minimize underachievement of fiber (g), g5.
vi. Goal 6 (vitamin A):= Minimize under-achievement of vitamin A (mcg), g6.
vii. Goal 7 (vitamin D):= Minimize under-achievement of vitamin D (mcg), g7.
viii. Goal 8 (vitamin E):= Minimize under-achievement of vitamin E (mg), g8.
ix. Goal 9 (vitamin C):= Minimize under-achievement of vitamin C (mg), g9.
x. Goal 10 (vitamin B1):= Minimize under-achievement of vitamin B1 (mg), g10.
xi. Goal 11 (vitamin B2):= Minimize under-achievement of vitamin B2 (mg), g11.
xii. Goal 12 (vitamin B3):= Minimize under-achievement of vitamin B3 (mg), g12.
xiii. Goal 13 (vitamin B12):= Minimize under-achievement of vitamin B12 (mcg), g13.
xiv. Goal 14 (folate):= Minimize under-achievement of folate (mcg), g14.
d. Priority 4 (P4)
i. Goal 15 (calcium):= Minimize under-achievement of calcium (mg), g15.
ii. Goal 16 (phosporus):= Minimize under-achievement of phosporus (mg), g16.
iii.Goal 17 (magnesium):= Minimize under-achievement of magnesium (mg), g17.
iv. Goal 18 (copper):= Minimize under-achievement of copper (mcg), g18.
v. Goal 19 (iron):= Minimize underachievement of iron (mg), g19.
vi. Goal 20 (zinc):= Minimize underachievement of zinc (mg), g20.
e. Priority 5 (P5)
i. Goal 21 (vitamin K):= Minimize under-achievement of vitamin K (mcg), g21.
ii. Goal 22 (vitamin B5):= Minimize under-achievement of vitamin B5 (mg), g22.
iii. Goal 23 (vitamin B6):= Minimize under-achievement of vitamin B6 (mg), g23.
iv. Goal 24 (choline):= Minimize under-achievement of choline (mg), g24.
v. Goal 25 (sodium):= Minimize under-achievement of sodium (mg), g25.
vi. Goal 26 (potassium):= Minimize under-achievement of potassium (mg), g26.
vii. Goal 27 (manganese):= Minimize under-achievement of manganese (mg), g27.
viii. Goal 28 (selenium):= Minimize under-achievement of selenium (mcg), g28.
Goal constraints generally can be written as follows:
1
,
− +
=
+ + =
∑
n ij j i i ij
a x d d g i = 1, 2, …, m, (1)
with
n:= the number of types of food,
m:= the number of nutrients, where m= 28, aij:= i
th
nutrient in jth food type,
xj:= decision variables that represent the type of food
chosen in grams, gi:= recommendation i
th
nutrient intake, di
+
:= positive deviation of nutrients, di
-:= negative deviation of nutrients. 2.3. System Constraints Formulation
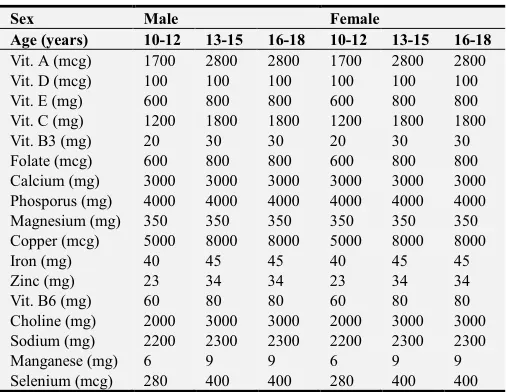
Factors limited to this case relate to the availability of budgets and the safe limits of certain nutrition values to be consumed. These factors are budget, saturated fat, cholesterol, vitamin A, vitamin D, vitamin E, vitamin C, vitamin B3, vitamin B6, folate, calcium, phosphorus, magnesium, copper, iron, zinc, choline, sodium, manganese and selenium.
Based on a survey by the Riau Province’s Central Bureau of Statistics (BPS), monthly expenditure per capita according to food groups in Riau Province in 2017 was IDR603,401 or IDR20,113 per day, where IDR is Indonesian Currency called Indonesian rupiah. This value is a reference for authors to limit the food expenditure budgets.
Table 2. The Upper Limit of Daily Adolescent’s Nutrition.
Sex Male Female
Age (years) 10-12 13-15 16-18 10-12 13-15 16-18
The American Heart Association limits consumption of saturated fats by 6% of total energy and cholesterol by 300 mg per day. Other nutrients are also limited as listed in Table 2, so that system constraints can be formulated as follows:
∑
=≤
n j f jfj
x
UL
a
1
,
f = m+1for saturated fat,f = m+2 for cholesterol,
, 1
∑
= ≤ n j jjx C
c for cost,
,
u u
u UL g
d+ ≤ − for others, where
cj:= cost of jth type of food,
C:= daily budget for meals,
ULf:= upper limit of f th fat content that is safe for
consumption,
ULu:= upper limit of uth nutrient content that is safe for
consumption.
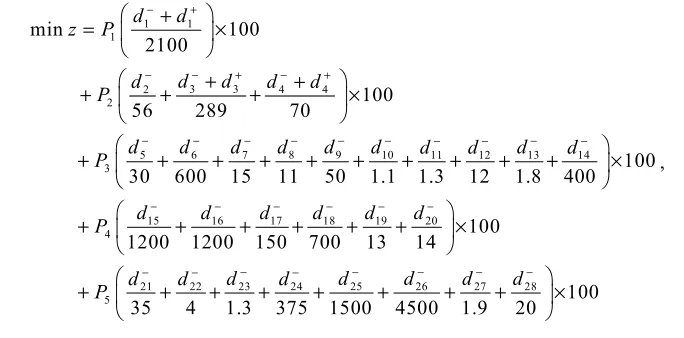
2.4. Objective Function Formulation
In this case the desired deviation is minimized according to the priority level determined by the decision maker, so that the problem can be defined as follows:
(
)
(
)
(
)
1 1 1
2 2 3 3 4 4
3 5 6 7 8 9 10 11 12 13 14
: min ,
: min ,
: min ,
P d d
P d d d d d
P d d d d d d d d d d
− + − − + − + − − − − − − − − − − = + = + + + + = + + + + + + + + +
(
)
(
)
4 15 16 17 18 19 20
5 21 22 23 24 25 26 27 28
: min ,
: min .
P d d d d d d
P d d d d d d d d
− − − − − −
− − − − − − − −
= + + + + +
= + + + + + + +
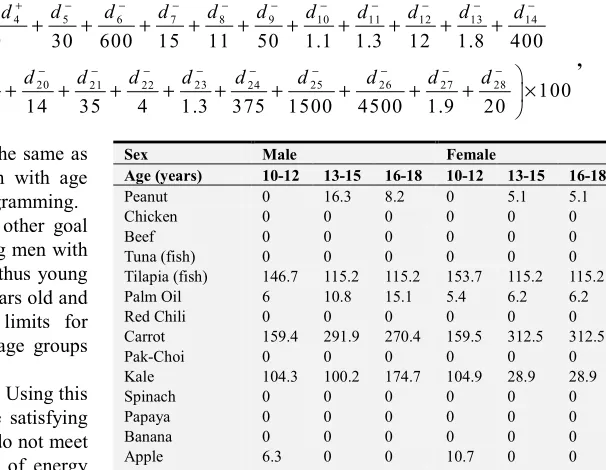
Because the unit of measurement for each goal is different, then the deviation is measured by percentage. So the objective function minimizing the number of percentage deviations is defined as follows:
4 4 14 20 28
1 1
1 2 2 3 4 5
2 3 5 15 21
1
min 100 i 100 i 100 i 100 i 100 i 100
i i i i i i i i i i
d d d d d
d d
z P P P P P P
g g g g g g
− + − + − − + = = = = = + = × + × + × + × + × + ×
∑
∑
∑
∑
∑
3. Computational Result
Based on (1), for the case of nutrition optimization for young men with age groups 10-12 years old can be defined as follows:
1 1 1
3 3
2 4 4
2
5 6 7 8 9 10 11 12 13 14
3
15 16 17 18 19 20
4
min 100
2100
100
56 289 70
100
30 600 15 11 50 1.1 1.3 12 1.8 400
1200 1200 150 700 13
d d
z P
d d
d d d
P
d d d d d d d d d d
P
d d d d d d
P − + − + − − + − − − − − − − − − − − − − − − − + = × + + + + + × + + + + + + + + + + × + + + + + +
23 25 26 27 28
21 22 24
5
100 14
100
35 4 1.3 375 1500 4500 1.9 20
d d d d d
d d d
P − − − − − − − − × + + + + + + + + × , subject to
∑
= + −− = + 20 1 j i i i jijx d d g
a , i = 1, 2, …, 28
where aij are ith nutrient in jth food type in unit of gram as
contained in Table 3, and system constraints
∑
= ≤ 20 1 , j f jfjx UL
a f = 29 for saturated fat,
∑
=
≤
20
1
, 20113
j j jx
c
,
u u
u UL g
d+ ≤ −
for u = 6, 7, 8, 9, 12, 14, 15, 16, 17, 18, 19, 20, 23, 24, 25, 27 and 28,
a29j:= {0.0018, 0.00025, 0.00691, 0.02539, 0.03126,
0.06279, 0.02301, 0.05335, 0.00328, 0.00585, 0.493, 0.00042, 0.00032, 0.00027, 0.00178, 0.00063, 0.00081, 0.00112, 0.00028, 0.02126}
a30j:= {0, 0, 0, 0, 3.72, 0, 0.86, 0.62, 0.47, 0.5, 0, 0, 0, 0, 0,
0, 0, 0, 0, 0}
cj:= {12, 8, 6.7, 10, 20, 21, 30, 120, 28, 28, 13.89, 30, 14,
9.35, 6, 10, 8, 12.5, 33, 20} ULf:= {14, 300}
ULu − gu:= {1100, 85, 589, 1150, 8, 200, 1800, 2800, 200,
4300, 27, 9, 8.3, 58.7, 1625, 700, 4.1, 260}, and all variables are nonnegative.
This model is also used in other cases such as young men with groups aged 13-15 years old and 16-18 years old, as well as young women with age groups 10-12 years old, 13-15 years old and 16-18 years old. Nutrition requirements and limits of nutrients that are safe for consumption can be adjusted to age groups based on Table 1 and Table 2.
LINGO computing results show optimal results even though there are several micronutrients that do not meet daily needs. The solution obtained by the preemptive goal programming is the optimal solution for this model because in this model the goal is defined to satisfy the highest priority nutrients.
Table 3. Nutrition Facts of Chosen Food in Unit of Gram.
Index 1 2 3 4 5 6 7 8 9 10
i j Rice Potato Tofu Tempe Egg Peanut Chicken Beef Tuna (fish) Tilapia (fish)
1 Energy (kkal) 3.65 0.77 0.76 1.92 1.43 5.67 1.43 1.98 1.03 0.96 2 Protein (g) 0.0713 0.0205 0.0808 0.2029 0.1256 0.258 0.1744 0.1942 0.22 0.2008 3 Carbohydrate (g) 0.7995 0.1749 0.0187 0.0764 0.0072 0.1613 0.0004 0 0 0 4 Fat (g) 0.0066 0.0009 0.0478 0.108 0.0951 0.4924 0.081 0.1273 0.0101 0.017 5 Fiber (g) 0.013 0.021 0.003 0 0 0.085 0 0 0 0 6 Vit. A (mcg) 0 0 0 0 1.6 0 0 0 0.16 0 7 Vit. D (mcg) 0 0 0 0 0.02 0 0 0 0 0.031 8 Vit. E (mg) 0.0011 0.0001 0.0001 0 0.0105 0.0833 0.0027 0.0035 0 0.004 9 Vit. C (mg) 0 0.197 0.001 0 0 0 0 0 0.01 0 10 Vit. B1 (mg) 0.0007 0.00081 0.00081 0.00078 0.0004 0.0064 0.00109 0.00049 0.00033 0.00041 11 Vit. B2 (mg) 0.00049 0.00032 0.00052 0.00358 0.0046 0.00135 0.00241 0.00154 0.001 0.00063 12 Vit. B3 (mg) 0.016 0.01061 0.00195 0.0264 0.0008 0.12066 0.05575 0.04818 0.154 0.03903 13 Vit. B12 (mcg) 0 0 0 0.0008 0.0089 0 0.0056 0.0197 0.019 0.0158 14 Folate (mcg) 0.08 0.15 0.15 0.24 0.47 2.4 0.01 0.06 0.09 0.24 15 Calcium (mg) 0.28 0.12 3.5 1.11 0.56 0.92 0.06 0.12 0.29 0.1 16 Phosporus (mg) 1.15 0.57 0.97 2.66 1.98 3.76 1.78 1.75 2.22 1.7 17 Magnesium (mg) 0.25 0.23 0.3 0.81 0.12 1.68 0.21 0.19 0.34 0.27 18 Copper (mcg) 2.2 1.1 1.93 5.6 0.72 11.44 0.65 0.63 0.86 0.75 19 Iron (mg) 0.008 0.0081 0.0536 0.027 0.0175 0.0458 0.0082 0.0199 0.0125 0.0056 20 Zinc (mg) 0.0109 0.003 0.008 0.0114 0.0129 0.0327 0.0147 0.0455 0.0082 0.0033 21 Vit. K (mcg) 0.001 0.02 0.024 0 0.003 0 0.008 0.011 0 0.014 22 Vit. B5 (mg) 0.01014 0.00295 0.00068 0.00278 0.0153 0.01767 0.01092 0.00576 0.0042 0.00487 23 Vit. B6 (mg) 0.00164 0.00298 0.00047 0.00215 0.0017 0.00348 0.00512 0.00355 0.0085 0.00162 24 Choline (mg) 0.058 0.121 0.288 0 2.938 0.525 0.588 0.674 0 0.425 25 Sodium (mg) 0.05 0.06 0.07 0.09 1.42 0.18 0.6 0.68 0.37 0.52 26 Potassium (mg) 1.15 4.25 1.21 4.12 1.38 7.05 5.22 2.89 4.07 3.02 27 Manganese (mg) 0.01088 0.00153 0.00605 0.013 0.0003 0.01934 0.00016 0.0001 0.00015 0.00037 28 Selenium (mcg) 0.151 0.004 0.089 0 0.307 0.072 0.102 0.142 0.365 0.418
Table 3. Continued.
Index 11 12 13 14 15 16 17 18 19 20
i j Palm Oil Red Chili Carrot Pak-Choi Kale Spinach Papaya Banana Apple Avocado
Index 11 12 13 14 15 16 17 18 19 20
i j Palm Oil Red Chili Carrot Pak-Choi Kale Spinach Papaya Banana Apple Avocado
12 Vit. B3 (mg) 0 0.01244 0.00983 0.005 0.0118 0.00724 0.00357 0.00665 0.00091 0.01738 13 Vit. B12 (mcg) 0 0 0 0 0 0 0 0 0 0 14 Folate (mcg) 0 0.23 0.19 0.66 0.62 1.94 0.37 0.2 0.03 0.81 15 Calcium (mg) 0 0.14 0.33 1.05 2.54 0.99 0.2 0.05 0.06 0.12 16 Phosporus (mg) 0 0.43 0.35 0.37 0.55 0.49 0.1 0.22 0.11 0.52 17 Magnesium (mg) 0 0.23 0.12 0.19 0.33 0.79 0.21 0.27 0.05 0.29 18 Copper (mcg) 0 1.29 0.45 0.21 0.53 1.3 0.45 0.78 0.27 1.9 19 Iron (mg) 0.0001 0.0103 0.003 0.008 0.016 0.0271 0.0025 0.0026 0.0012 0.0055 20 Zinc (mg) 0 0.0026 0.0024 0.0019 0.0039 0.0053 0.0008 0.0015 0.0004 0.0064 21 Vit. K (mcg) 0 0.14 0.132 0.455 3.896 4.829 0.026 0.005 0.022 0.21 22 Vit. B5 (mg) 0 0.00201 0.00273 0.0009 0.0037 0.00065 0.00191 0.00334 0.00061 0.01389 23 Vit. B6 (mg) 0 0.00506 0.00138 0.0019 0.00147 0.00195 0.00038 0.00367 0.00041 0.00257 24 Choline (mg) 0.003 0.109 0.088 0.064 0.005 0.193 0 0.098 0 0.142 25 Sodium (mg) 0 0.09 0.69 0.65 0.53 0.79 0.08 0.01 0.01 0.07 26 Potassium (mg) 0 3.22 3.2 2.52 3.48 5.58 1.82 3.58 1.07 4.85 27 Manganese (mg) 0 0.00187 0.00143 0.0016 0.0092 0.00897 0.0004 0.0027 0.00035 0.00142 28 Selenium (mcg) 0 0.005 0.001 0.005 0.009 0.01 0.006 0.01 0 0.004 Source: USDA National Nutrient Database for Standard Reference 1 April 2018
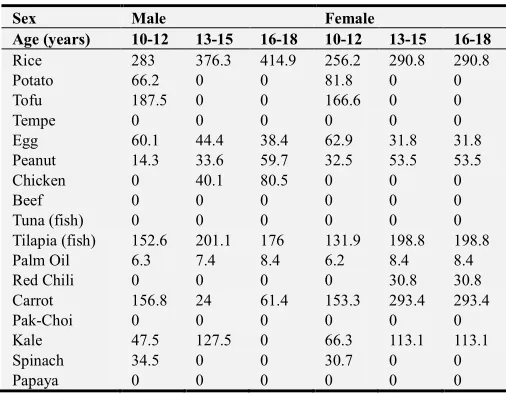
In Table 4 there is an optimal food combination to meet the daily nutrition needs of adolescents based on gender and age group. The types of food consumed for the 10-12 years old age group both young men and young women more vary, which amounts to 12 types of food.
Carbohydrate sources come from rice and potatoes. Sources of protein and fat come from tofu, eggs, peanuts, tilapia and oil. Food sources that are rich in vitamins and minerals come from fruits and vegetables. Fruit and vegetables selected to satisfy the nutrition of adolescents with 10-12 years old age group include carrots, kale, spinach, apples and avocados.
The combination of food obtained for adolescents with the age group 13-15 years old and 16-18 years old is less than adolescents with the age group 10-12 years old because with the same budget the nutrition needs that must be met in this group are greater than the age group 10- 12 years old. As a result, the lack of micronutrients for the age group 13-15 years old and 16-18 years old is greater than the age group 10-12 years old.
Table 4. Food Combination (grams) for Adolescents with Preemptive Goal Programming.
Sex Male Female
Age (years) 10-12 13-15 16-18 10-12 13-15 16-18
Rice 283 376.3 414.9 256.2 290.8 290.8 Potato 66.2 0 0 81.8 0 0 Tofu 187.5 0 0 166.6 0 0 Tempe 0 0 0 0 0 0 Egg 60.1 44.4 38.4 62.9 31.8 31.8 Peanut 14.3 33.6 59.7 32.5 53.5 53.5 Chicken 0 40.1 80.5 0 0 0 Beef 0 0 0 0 0 0 Tuna (fish) 0 0 0 0 0 0 Tilapia (fish) 152.6 201.1 176 131.9 198.8 198.8 Palm Oil 6.3 7.4 8.4 6.2 8.4 8.4 Red Chili 0 0 0 0 30.8 30.8 Carrot 156.8 24 61.4 153.3 293.4 293.4 Pak-Choi 0 0 0 0 0 0 Kale 47.5 127.5 0 66.3 113.1 113.1 Spinach 34.5 0 0 30.7 0 0 Papaya 0 0 0 0 0 0
Sex Male Female
Age (years) 10-12 13-15 16-18 10-12 13-15 16-18
Banana 0 0 0 0 0 0 Apple 39.5 0 0 98.7 0 0 Avocado 247 298.4 239.7 171.9 173.5 173.5
From Table 5 and Table 6, there is a comparison of prices and energy in a food group. The carbohydrate source group is the cheapest component to produce large energy. To provide energy of 1084 kcal, or around 51.62% for boys with the age group of 10-12 years old only requires a fee of IDR3,926, or around 19.52% of the budget.
Table 5. Cost (IDR) of Food Group.
Sex Male Female
Age (years) 10-12 13-15 16-18 10-12 13-15 16-18
Carbohydrate Source 3,926 4,516 4,979 3,729 3,490 3,490 Protein and Fat Source 7,119 8,528 9,480 6,836 7,441 7,441 Fruits and Vegetables 9,069 7,069 5,654 9,548 9,182 9,182
Table 6. Energy (kcal) of Food Group.
Sex Male Female
Age (years) 10-12 13-15 16-18 10-12 13-15 16-18
Carbohydrate Source 1084 1374 1514 998 1062 1062 Protein and Fat Source 511 570 752 582 614 614 Fruits and Vegetables 505 532 409 420 450 450
4. Models Comparison
In this section a comparison of the results obtained with the preemptive goal programming and goal programming is presented. The factor compared is the deviation that results from the two methods. The linear programming models is also presented as a minimum cost reference to meet the daily nutrition needs of boys and girls in each age group.
4.1. Goal Programming Nutrition Optimization Models
programming models. The difference is only in objective function. The objective function of the nutrition optimization
models with a goal programming for boys with a 10-12 years old age group is defined as follows:
3 3 5 6 7 8 9 10 13
1 1 2 4 4 11 12 14
15 16 17 18 19 20 21 22 23 24 25
m in
2100 56 289 70 30 600 15 11 50 1.1 1.3 12 1.8 400
1200 1200 150 700 13 14 35 4 1.3 375 15
d d d d d d d d d
d d d d d d d d
z
d d d d d d d d d d d
− + − − − − − − −
− + − − + − − −
− − − − − − − − − − −
+ + +
= + + + + + + + + + + + + +
+ + + + + + + + + + + 26 27 28
100
00 4500 1.9 20
d− d− d−
+ + + ×
,
with goal constraints and system constraints are the same as the nutrition optimization model for young men with age groups 10-12 years old using preemptive goal programming.
The same models is also used in the case of other goal programming nutrition optimization such as young men with age groups 13-15 years old and 16-18 years old, thus young women with age groups 10-12 years old, 13-15 years old and 16-18 years old. Nutrition requirements and limits for nutrients that safe to consume are adjusted for age groups based on Table 1 and Table 2.
LINGO computing results show optimal results. Using this model the combination of food obtained is quite satisfying even though there are several micronutrients that do not meet daily needs and a little deviation in the amount of energy intake. The solution obtained is the optimal solution for nutrition models with a goal programming.
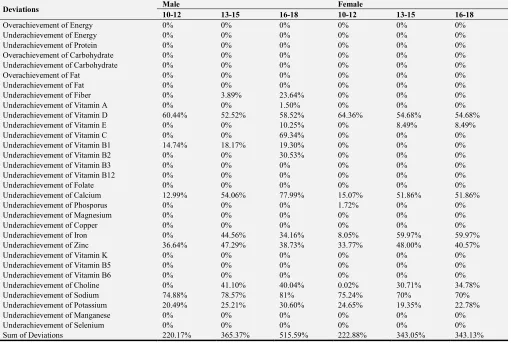
In Table 7, there is the optimal food combination to meet the daily nutrition needs of adolescents based on sex and age group. The types of food consumed for each age group are 9 to 10 types of food. Carbohydrate sources come from rice and potatoes. Sources of protein and fat come from tofu, eggs, peanuts, tilapia and oil. The fruits and vegetables chosen to satisfy the nutrients are carrots, kale, apples and avocados. In terms of food combinations, the solution using the goal programming nutrition models is not much different from the preemptive goal programming nutrition models solution.
Table 7. Food Combination (grams) for Adolescents with Goal Programming.
Sex Male Female
Age (years) 10-12 13-15 16-18 10-12 13-15 16-18
Rice 261.6 350.1 387.1 237.1 278.3 278.3 Potato 173.2 0 0 209.4 59.9 59.9 Tofu 201.3 188.2 135.5 202.0 346.6 346.6 Tempe 0 0 0 0 0 0 Egg 60.9 65.2 65.2 60 65.2 65.2
Sex Male Female
Age (years) 10-12 13-15 16-18 10-12 13-15 16-18
Peanut 0 16.3 8.2 0 5.1 5.1 Chicken 0 0 0 0 0 0 Beef 0 0 0 0 0 0 Tuna (fish) 0 0 0 0 0 0 Tilapia (fish) 146.7 115.2 115.2 153.7 115.2 115.2 Palm Oil 6 10.8 15.1 5.4 6.2 6.2 Red Chili 0 0 0 0 0 0 Carrot 159.4 291.9 270.4 159.5 312.5 312.5 Pak-Choi 0 0 0 0 0 0 Kale 104.3 100.2 174.7 104.9 28.9 28.9 Spinach 0 0 0 0 0 0 Papaya 0 0 0 0 0 0 Banana 0 0 0 0 0 0 Apple 6.3 0 0 10.7 0 0 Avocado 288.1 247.2 240.8 272.4 235.1 235.1
Table 8 and Table 9 present positive and negative deviations for each model. Significant differences can be seen in the unwanted total deviation between goal programming and preemptive goal programming.
Sum of deviation obtained by using goal programming for case of young men with age group 10-12 years old, 13-15 years old and 16-18 years old respectively are 199.28%, 259.89% and 292.42%, while the sum of deviation using preemptive goal programming are 220.17%, 365.37% and 515.59%. In case of young women with the age group 10-12 years old, 13-15 years old and 16-18 years old, sum of deviation with goal programming are 186.98%, 234.67 and 229.48%, while the sum of deviation using preemptive goal programming are 222.88%, 343.05% and 343.13%.
Overall the sum of unwanted deviation obtained using goal programming is smaller compared to sum of deviation using preemptive goal programming for all cases, but the preemptive goal programming is superior in meeting energy and fat requirements which are top priority in preemptive goal programming models.
Table 8. Deviations of Goal Programming.
Deviations Male Female
10-12 13-15 16-18 10-12 13-15 16-18
Deviations Male Female
10-12 13-15 16-18 10-12 13-15 16-18
Underachievement of Vitamin E 7.02% 0% 16.01% 10.85% 33.14% 33.14% Underachievement of Vitamin C 0% 0% 0% 0% 0% 0% Underachievement of Vitamin B1 10.16% 12.80% 19.73% 0.57% 6.70% 6.70% Underachievement of Vitamin B2 0% 0% 0% 0% 0% 0% Underachievement of Vitamin B3 0% 0% 0% 0% 0% 0% Underachievement of Vitamin B12 0% 0% 0% 0% 0% 0% Underachievement of Folate 0% 0% 0% 0% 0% 0% Underachievement of Calcium 0% 0% 0% 0% 0% 0% Underachievement of Phosporus 0% 0% 0% 0% 0% 0% Underachievement of Magnesium 0% 0% 0% 0% 0% 0% Underachievement of Copper 0% 0% 0% 0% 0% 0% Underachievement of Iron 0% 0% 0% 0% 0% 0% Underachievement of Zinc 36.51% 45.85% 43.16% 33.47% 39.13% 30.43% Underachievement of Vitamin K 0% 0% 0% 0% 0% 0% Underachievement of Vitamin B5 0% 0% 0% 0% 0% 0% Underachievement of Vitamin B6 0% 0% 0% 0% 0% 0% Underachievement of Choline 0% 30.04% 33.62% 0% 0% 0% Underachievement of Sodium 74.28% 69.48% 68.08% 74.10% 70.50% 70.50% Underachievement of Potassium 9.22% 22.04% 20.31% 7.52% 17.59% 21.10% Underachievement of Manganese 0% 0% 0% 0% 0% 0% Underachievement of Selenium 0% 0% 0% 0% 0% 0% Sum of Deviations 199.28% 259.89% 292.42% 186.98% 234.67% 229.48%
Table 9. Deviations of Preemptive Goal Programming.
Deviations Male Female
10-12 13-15 16-18 10-12 13-15 16-18
Overachievement of Energy 0% 0% 0% 0% 0% 0% Underachievement of Energy 0% 0% 0% 0% 0% 0% Underachievement of Protein 0% 0% 0% 0% 0% 0% Overachievement of Carbohydrate 0% 0% 0% 0% 0% 0% Underachievement of Carbohydrate 0% 0% 0% 0% 0% 0% Overachievement of Fat 0% 0% 0% 0% 0% 0% Underachievement of Fat 0% 0% 0% 0% 0% 0% Underachievement of Fiber 0% 3.89% 23.64% 0% 0% 0% Underachievement of Vitamin A 0% 0% 1.50% 0% 0% 0% Underachievement of Vitamin D 60.44% 52.52% 58.52% 64.36% 54.68% 54.68% Underachievement of Vitamin E 0% 0% 10.25% 0% 8.49% 8.49% Underachievement of Vitamin C 0% 0% 69.34% 0% 0% 0% Underachievement of Vitamin B1 14.74% 18.17% 19.30% 0% 0% 0% Underachievement of Vitamin B2 0% 0% 30.53% 0% 0% 0% Underachievement of Vitamin B3 0% 0% 0% 0% 0% 0% Underachievement of Vitamin B12 0% 0% 0% 0% 0% 0% Underachievement of Folate 0% 0% 0% 0% 0% 0% Underachievement of Calcium 12.99% 54.06% 77.99% 15.07% 51.86% 51.86% Underachievement of Phosporus 0% 0% 0% 1.72% 0% 0% Underachievement of Magnesium 0% 0% 0% 0% 0% 0% Underachievement of Copper 0% 0% 0% 0% 0% 0% Underachievement of Iron 0% 44.56% 34.16% 8.05% 59.97% 59.97% Underachievement of Zinc 36.64% 47.29% 38.73% 33.77% 48.00% 40.57% Underachievement of Vitamin K 0% 0% 0% 0% 0% 0% Underachievement of Vitamin B5 0% 0% 0% 0% 0% 0% Underachievement of Vitamin B6 0% 0% 0% 0% 0% 0% Underachievement of Choline 0% 41.10% 40.04% 0.02% 30.71% 34.78% Underachievement of Sodium 74.88% 78.57% 81% 75.24% 70% 70% Underachievement of Potassium 20.49% 25.21% 30.60% 24.65% 19.35% 22.78% Underachievement of Manganese 0% 0% 0% 0% 0% 0% Underachievement of Selenium 0% 0% 0% 0% 0% 0% Sum of Deviations 220.17% 365.37% 515.59% 222.88% 343.05% 343.13%
4.2. Linear Programming Nutrition Optimization Model
In this model the objective function is to minimize the cost of food by meeting the constraints that represent the daily nutrition needs of adolescents according to the AKG.
∑
=
=
20
1
min
j j jx
c
z ,
subject to
∑
=
≥
20
1
j
i j ijx g
a , for i = 1, 2, …, 28,
and all variables are nonnegative, with xjis jth food typeand
a1j, a2j,..., a28j are nutrients that need to be fulfilled as in
preemptive goal programming nutrition model.
The same model is used in other case of linear programming nutrition optimizations such as young men with the age group 13-15 years old and 16-18 years old, as well as young women with the age group 10-12 years old, 13-15 years old and 16-18 years old. Nutrition requirements and limits on nutrients that are safe for consumption can be adjusted to age groups based on Table 1 and Table 2.
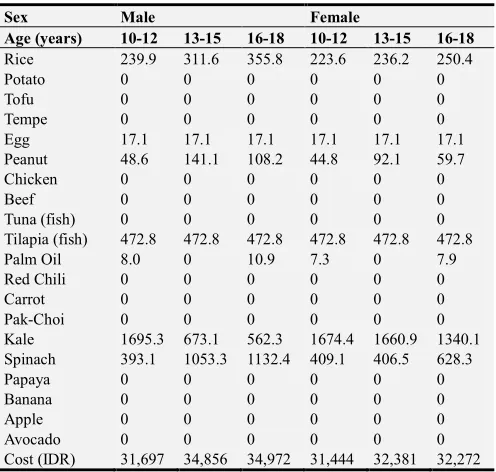
LINGO computing results are optimal results because they satisfy all the constraints. Table 10 shows that variations in food combinations for young men and young women of all age groups are almost the same.
Table 10. Food Combination (grams) for Adolescents with Linear Programming.
Sex Male Female
Age (years) 10-12 13-15 16-18 10-12 13-15 16-18
Rice 239.9 311.6 355.8 223.6 236.2 250.4 Potato 0 0 0 0 0 0 Tofu 0 0 0 0 0 0 Tempe 0 0 0 0 0 0 Egg 17.1 17.1 17.1 17.1 17.1 17.1 Peanut 48.6 141.1 108.2 44.8 92.1 59.7 Chicken 0 0 0 0 0 0 Beef 0 0 0 0 0 0 Tuna (fish) 0 0 0 0 0 0 Tilapia (fish) 472.8 472.8 472.8 472.8 472.8 472.8 Palm Oil 8.0 0 10.9 7.3 0 7.9 Red Chili 0 0 0 0 0 0 Carrot 0 0 0 0 0 0 Pak-Choi 0 0 0 0 0 0 Kale 1695.3 673.1 562.3 1674.4 1660.9 1340.1 Spinach 393.1 1053.3 1132.4 409.1 406.5 628.3 Papaya 0 0 0 0 0 0 Banana 0 0 0 0 0 0 Apple 0 0 0 0 0 0 Avocado 0 0 0 0 0 0 Cost (IDR) 31,697 34,856 34,972 31,444 32,381 32,272
Sources of carbohydrates only comes from rice. Sources of protein and fat come from eggs, peanuts, tilapia and oil. Vegetables consumed are kale and spinach. The computational results show that all micronutrients have been satisfied even though no fruits are consumed.
Slight differences occur in the age group 13-15 years old, both young men and young women which there is no oil consumption because the fat needs have been satisfied. The minimum meal costs obtained for young men with a age group of 10-12 years old, 13-15 years old and 16-18 years old respectively are IDR31,697, IDR34,856 and IDR34,972.
The minimum meal costs obtained for girls with age group 10-12 years old, 13-15 years old and 16-18 years old respectively are IDR31,444, IDR32,381 and IDR32,272. This number is directly proportional to the nutrition needs that are increasing as the age is increasing.
The results in Table 10 is one of food combinations that meet the daily nutrition of adolescents. However we can make alternative food combinations by eliminating selected foods to be consumed so that they are replaced by other types of food based on the same source of nutrients. Suppose we want to avoid consuming tilapia in a diet, we simply remove tilapia from the decision variables. So to meet the daily protein requirements mostly contained in tilapia, other food types which are also a source of protein such as tofu, tempe, chicken, beef and tuna will be selected.
5. Conclusions
The combination of foodstuff obtained using goal programming and preemptive goal programming is very satisfying, although some nutrients that do not meet the daily needs of adolescents still occur. The factor that results in non-fulfillment of nutrients is the limited budget, which amount to IDR20,113. The computational results of linear programming models show that to meet the daily nutrition requirements of adolescents of 2000 kcal the cost of IDR31,444 is required.
The combination of food produced is one of food combination that meets the daily nutrition of adolescents. Basically the food that is selected for consumption is the most efficient food to meet nutrition needs both in terms of price and nutrient content. To make alternative food combinations can be done by removing food selected for consumption so that it is replaced by other types of foods in the same group of nutrition sources. However, deviations of nutrients that will be met will also be different.
The goal programming and preemptive goal programming have advantages and disadvantages. Goal programming is more flexible in producing a combination of foods because the goal programming is not focused on meeting certain nutrients. All nutrients have the same chance to satisfy so that the combination of foods produced is only influenced by the types of food that are sampled. Different from preemptive goal programming, the combination of foods produced with this model is bound to defined priorities. Deviation generated for the lowest priority are so large, so the total deviation of the preemptive goal programming is greater than goal programming.
In case discussed earlier, goal programming is superior in satifying calcium and iron needs. Unwanted deviations by the goal programming for these nutrients is 0% for all cases. In preemptive goal programming, deviations for energy and fat is lower than goal programming, which is a top priority in preemptive goal programming models which is defined by the authors as decision maker.
meeting daily nutritional needs, optimization should be done using a goal programming. Preemptive goal programming will be more effective if used for more specific cases, for example to produce a combination of foods for athletes.
References
[1] S. Almatsier, Basic Principles of Nutrition Sciences, Gramedia Pustaka Utama, Jakarta, 2002.
[2] J. Stang and M. T. Story, Guidelines for Adolescent Nutrition Services, University of Minnesota, Minneapolis, 2005.
[3] A. Charnes dan W. W. Cooper, Management Model and Industrial Application of Linear Programming, Volume 1, Wiley, New York, 1961.
[4] S. M. Lee, Goal Programming for Decision Analysis, Auerbach, Philadelphia, 1972.
[5] J. P. Ignizio, Introduction to Linear Goal Programming, Sage, Beverly Hills, 1985.
[6] C. Romero, Extended lexicographic goal programming: A unifying approach, Omega, 29 (2001), 63–71.
[7] M. Tamiz, D. Jones dan C. Romero, Goal programming for decision making: An overview of the current state-of-the-art, European Journal of Operational Research, 111 (1998), 567– 581.
[8] H. L. Li, An efficient method for solving linear goal programming problems, Journals of Optimization Theory and Applications, 90 (1996), 465–469.
[9] C.-T. Chang, Multi-choise goal programming, The International Journal of Management Science, 35 (2004), 389– 396.
[10] C.-T. Chang, On the mixed binary goal programming problems, Applied Mathematics and Computation, 159 (2004), 759–768.
[11] B. B. Pal, B. N. Moitra dan U. Maulik, A goal programming procedure for fuzzy multiobjective linear fractional programming problem, Fuzzy Set and Systems, 139 (2003), 395–405.
[12] A. M. Anderson and M. D. Earle, Diet planning in the third world by linear and goal programming, Journal of Operational Research Society, 34 (1983), 9–16.
[13] E. L. Ferguson, N. Darmon, U. Fahmida, S. Fitriyanti, T. B. Harper and I. M. Premachandra, Design of optimal food-based complementary feeding recommendations and identification of key “problem nutrients’ using goal programming, The Journal of Nutrition, 136 (2006), 2399–2404.
[14] O. Santika, U. Fahmida and E. L. Ferguson, Development of food-based complementary feeding recomendations for 9- to 11-month-old peri-urban Indonesian infants using linear programming, The Journal of Nutrition, 139 (2009), 135–141.
[15] O. A. Omotesho and A. Muhammad-Lawal, Optimal food plan for rural house-hold's food security in Kwara state, Nigeria: the goal programming approach, Journal of Agricultural Biotechnology and Sustainable Development, 2 (1) (2010), 007–014.
[16] M. Pasic, A. Catovic, I. Bijelonja and A. Bathanovic, Goal programming nutrition optimization model, Annals & Proceedings of DAAAM International 2012, 23 (1) (2012). [17] M. Pasic, A. Catovic, I. Bijelonja and A. Bathanovic,
Weighted goal programming optimization diet model, Journal of Trends in the Development of Machinery and Associated Technology, 17 (1) (2013), 101–104.
[18] M. Pasic, A. Catovic, I. Bijelonja and S. Crnovrsanin, Linear programming local cost nutrition optimization model, Annals & Proceedings of DAAAM International 2011, 22 (1) (2011). [19] H. Okubo, S. Sasaki, K. Murakami, T. Yokoyama, N. Hirota,
A. Notsu, M. Fukui and C. Date, Designing optimal food intake patterns to achieve nutritional goals for Japanese adults through the use of linear programming optimization models, Nutrition Journal, (2015).
[20] A. C. Iwuji, M. Nnanna and N. I. C. Ndulue, An optimal DASH diet model for people with hypertension using linear programming approach, Open Journal of Optimization, 5 (2016), 14–21.