http://www.sciencepublishinggroup.com/j/sjams doi: 10.11648/j.sjams.20180603.15
ISSN: 2376-9491 (Print); ISSN: 2376-9513 (Online)
Application of Factor Analysis in the Assessment of Solid
Waste Management in Bolgatanga Municipality of Ghana
Edward Akurugu
1, Abdul-Majeed Issahaku
1, *, Abdul-Samed Aliou
21
Department of Statistics, Bolgatanga Polytechnic, Bolgatanga, Ghana
2Department of Earth Science, University of Ghana, Accra, Ghana
Email address:
*
Corresponding author
To cite this article:
Edward Akurugu, Abdul-Majeed Issahaku, Abdul-Samed Aliou. Application of Factor Analysis in the Assessment of Solid Waste Management in Bolgatanga Municipality of Ghana. Science Journal of Applied Mathematics and Statistics.
Vol. 6, No. 3, 2018, pp. 99-109. doi: 10.11648/j.sjams.20180603.15
Received: June 27, 2018; Accepted: July 7, 2018; Published: August 6, 2018
Abstract:
The issue of waste management has become a daunting challenge for many countries particularly for developing countries. The adverse effects of waste on human lives and the environment have reached scary levels that call for a thorough assessment of waste management systems across the globe and in particular developing countries. In Bolgatanga municipality of the Upper East Region of Ghana, the situation of waste disposal is appalling exposing residents to all kinds of health related risk. City authorities who have the responsibility of ensuring that the environment is clean and safe for habitation are confronted with the serious burden of managing waste disposal in the municipality. This study therefore sought to examine a set of 18 variables relevant to the topic under investigation and how they relate to influence solid waste management in the municipality from the perspective of residents of the Bolgatanga municipality through the application of Factor Analysis. The object of this approach is to identify a set of indicator variables that amalgamate to form common factors. The opinions of 400 subjects on Solid Waste Management in the municipality were successfully collected through the administration of questionnaires and analyzed. A preliminary analysis of the data showed that the correlation matrix was not an identity matrix and a KMO value of 0.797 described as “middling” was obtained. These provided the necessary and sufficient grounds for the application of Factor Analysis to the data. Further analysis of the data revealed five latent factors which are Institutional Dormancy, Financial Constraint, Infrastructural Lapses, Accessibility and Behavioral Canker as factors that need to be addressed in order to improve the status of Solid Waste Management in Bolgatanga municipality.Keywords:
Waste Management, Factor Analysis, Institutional Dormancy, Financial Constraint, Infrastructural Lapses, Accessibility and Behavioral Canker1. Introduction
Addressing issues of waste generation in our environment is fundamental in realizing the ideals of the Sustainable Development Goals (SDGs). Day in day out, a rise in population results in a corresponding increase in the rate of consumption culminating in the production of large amounts of waste. The Environment Protection Act 1993, defines waste as “any discarded, rejected, abandoned, unwanted or surplus matter, whether or not intended for sale or for recycling, reprocessing, recovery or purification by a separate operation from that which produced the matter; or
anything declared by regulation or by an environment protection policy to be a waste; whether of value or not” [1]. Similarly, waste according to [2] are materials that are not prime products (that is products produced for the market) for which the initial user has no further use in terms of his/her own purposes of production, transformation or consumption, and of which he/she wants to dispose. Other definitions of waste can be seen in [3-5].
bottles, aluminum cans, flower trimmings, etc) which are discarded simply because they are considered waste to that effect. [7] also share the view that, waste products emanate from our ways of life and it is generated at every stage of production and development. They indicate that, it covers all stages of human activities, from manufacturing to consumption.
In Ghana, one major feature of urban cities is the nasty spectacle of filth which is primarily due to population explosions in the midst of weak waste management systems. Urban cities have become places for rural migrants who move into these urban areas in search of jobs. According to [8], proliferation of urban population comes with it rising demand for food and other essential services which in turn increases the waste generated daily by each household. Similarly, studies from [9] and [10] point out that, continuous economic development and increase in living standards result in the increasing demand for goods and services and the resultant effect is the proportionate increase in per capita waste generation. Other related studies [11-23] have all indicated that factors such as urbanization, economic development, living standards, population growth, globalization, industrialization, consumption patterns, household size and income levels have a positive effect on the volume of waste generation.
These wastes generated being it domestic or industrial has the potential of polluting the environment and consequently posing serious health problems to inhabitants of the environment.
According to [24], insufficient collection and poor disposal practices generate serious health related problems to humans and the environment. Also [25] states that, diseases transmission, fire hazards, odor nuisance, atmospheric and water pollution, aesthetic nuisance and economic losses are some of the common problems associated with poor management of solid waste. [26] share the view that, municipal solid waste is generally collected and deposited in landfill and such unscientific disposal approach attract rodents, birds and fleas to the waste site and create unhygienic conditions. [27] submit that, unscientific landfill site could reduce the quality of drinking water and cause diseases like nausea, jaundice, asthma. In a related development, [28] and [29] admonished that, residents who live closer to exposed and unmanaged waste dumps are subject to more bouts of cholera, an acute intestinal infection, skin diseases, blood and eyes cancer and respiratory infections. In Sub-Saharan Africa for instance, poor disposal practices have aggravated health related problems [8]. [30] also revealed that high incidence of diarrhea in children under six is inter related to food contamination by flies who feed on wastes.
According to [31], hygiene related diarrhea alone is thought to cause 30,300 deaths per year and is considered one of the commonest outpatient cases. Another poor waste management practice has shown to be the disposal of waste into water bodies. Poor waste management particularly with regards to waste disposal creates serious issues of
environmental contamination of water and soil, air pollution from waste burning, sanitation and hygiene challenges which go a long way to pose serious environmental health risk and aesthetic burdens [32]. The negative impacts of wastes on human lives as well as the environment are well articulated in documentary evidence. The effects of ineffective waste collection and poor waste management are countless.
Available data from a baseline survey on environmental sanitation in 2007/2008 revealed that, nearly 76% of households in Ghana depend on inappropriate waste collection and disposal methods, with only less than 5% using the services of house to house collection [33]. This assertion is backed by statistics from [34] which indicates that the most widely used method of solid waste disposal is by public dump in an open space accounting for 37.9% and about one in 12 households (8.2%) dump their solid waste indiscriminately. House to house waste collection accounts for 6.9%. For liquid waste disposal, that is throwing waste onto the streets (64.7%) and onto the compound (10.9%) are the two most common methods used by households in most Municipalities in Ghana. A study by [35] titled “Investigating Solid Waste Management in the Bolgatanga Municipality of the Upper East Region, Ghana”, revealed that, the most predominant waste disposal is the communal disposal at sites normally not approved in the peri-urban communities. This was followed by the door-to-door services which was prevalent in the urban residential areas. They went further to state that, “despite the dominant nature of communal skips and door-to-door services mostly in the Bolgatanga community, inhabitants still practice improper disposal from disposal in nearby bush to open dumps due to lack of enforcement of regulatory policies and programmes irrespective of income levels.
Elsewhere [9], [36-38] revealed that in most developing countries, communities have often adopted methods of waste disposal such as open dumping and burning that have proven to be destructive to human health and the environment simply because they feel they have no other ways of managing their waste. [39] opines that unhealthy disposal of solid waste is one of the key challenges facing developing countries. In the same vain, [40] proffer that, the method of waste collection and disposal form the bulk of the problems faced by developing countries in the management of solid waste.
A number of writers have given various definitions of waste management. For example, [41] in their study focused on municipal solid waste management defined it as “the collection, transfer, treatment, recycling, resource recovery and disposal of solid waste in urban areas”. [42] also defined waste management as “purposeful, systematic control of the generation, storage, collection, transportation, separation, processing, recycling, recovery and disposal of solid waste in a sanitary, aesthetically acceptable and economical manner”.
generation, collection, transfer and transportation, treatment and disposal of solid wastes. [45] reveals that, the collection and transportation of these solid wastes usually account for the bulk of Municipal budget spending and these processes are recognized to have the strongest impact on urban living.
According to [46], organized solid waste management practices were first implemented in the ancient city of Mahenjo-Daro in the Indus Valley by 2000 BC. This suggests that, the people at the time were conscious of the adverse effects of waste on human lives and the environment and therefore instituted schemes to manage solid waste generation. It is also documented that by 500 BC, the Greeks had both issued a decree prohibiting waste disposal on the streets and setup the first Western-type ‘municipal dumps’ while the Chinese had ‘disposal police’ to enforce disposal laws by 200 BC [47]. This clearly shows that improper waste disposal has been a longstanding attitude of man. To stop people from indiscriminately disposing of waste, the people at the time realized the need to provide municipal dumps, enact laws to govern people’s waste disposal attitudes and get personnel to enforce the laws. This appears to be a comprehensive approach to tackling the waste situation at the time. [48] and [49] in their respective works concur that, urban solid waste management is considered to be one of the most serious environmental problems confronting urban areas in developing countries.
According to [50] and [51], the basic drive for solid waste management is to address the health, environmental aesthetic, land use, resource, and economic concerns associated with improper solid waste management.
In view of the devastating effects of wastes on human lives and the environment, issues of sanitation have become matters of global concern.
The Sustainable Development Goals (SDGs) which is an advancement of the Millennium Development Goals (MDGs) clearly espouses goals that seek to promote the health of man as well as protect the environment. For example, SDG 3 talks of good health and well-being, SDG 6 also talks of clean water and sanitation and SDG 13 talks of climate action. These provisions of the SDGs transcend beyond physical and medical health to environmental consciousness.
In Ghana, the Metropolitan, Municipal and District Assemblies across the length and breadth of the country continue to make huge investments to rid the cities of filth, waste management in most cases accounts for (30-50)% of municipal operational budgets [52]. According to [53], even though cities are using (20-50)% of their budgets in solid waste management, only (20-80)% of the waste is collected.
It is important to state that, the burden of cleaning the environment of waste has become an overwhelming task for city authorities the world all over. This observation is confirmed by [54] who opine that, municipal solid waste management continues to be a major headache for local governments in both urban and rural areas across the world. A similar sentiment is shared by [55] and [56] that waste produced by burgeoning cities is overwhelming local authorities and national governments alike.
The sanitation situation of the Bolgatanga municipality is one that can best be described as poor. Litters of waste (plastics, papers, rubbers, rags, metals, human and animal excreta, and so forth) is a major feature of the environment posing serious health problems to residents. The municipality like many other local government areas is suffocating in generated waste. Though a number of studies have been undertaken to assess diverse perspectives of waste in the municipality [35], [57-58], much attention has not been devoted in identifying the militating factors to proper waste management in the municipality. A study by [59] indicated that, volumes of solid waste in towns will run into millions of tons and would accumulate if no proper management schemes are put in place to collect them. This certainly gives a cause for concern. To be able to address the waste management situation of the municipality requires a thorough understanding of the factors that serve as barriers to proper waste management in the municipality.
In view of the observed lacuna in the existing literature pertaining to waste management in the Bolgatanga municipality, this study seeks to examine the critical factors that account for poor Waste Management in the municipality through the application of Factor Analysis. Other studies which utilizes the explorative power of Factor Analysis can be viewed in [60-63].
2. Materials and Methods
Primary data was collected through the survey research approach which involved the use of questionnaires to gather the empirical data from the target subjects. The questionnaires designed for this study was in a likert scale format (1=Strongly Agree, 2=Agree, 3=Not Certain, 4=Disagree and 5=Strongly Disagree) containing a total of eighteen (18) items. A convenience sampling approach was used to contact a sample of 500 subjects based on their ease of accessibility, willingness and readiness to respond to the research instrument.
The basis for selecting a sample of 500 subjects is backed by [64] in their study which indicated that “the adequacy of sample size might be evaluated very roughly on the following scale: 50-very poor, 100-poor, 200-fair, 300-good, 500-very good, and 1000 or more-excellent”. Therefore, due to time and resource constraints, the study opted for the 500 instead of using 1000 or more subjects. Out of the 500 subjects contacted, 400 successfully completed and returned their questionnaires which formed the basis of the analysis. Factor Analysis was used to identify underlying dimensions (or factors) that explain correlations among a set of variables as well as identify new smaller set of variables that are uncorrelated purposely to replace original set of variables in subsequent multivariate analysis.
2.1. The M-Factor Model
The model takes into consideration the original variables
observed variables ( ’s) then
= + + ⋯ + +
= + + ⋯ + +
⋮ (1)
= + + ⋯ + +
In terms of Matrix Notation, the above linear combination for (1) becomes
⋮ = ⋮ ⋮
⋯ ⋯ ⋮
⋯ ⋮
⋮ + ⋮ (2)
From (2), similar representation takes the form of
= Λ ! + (3) where
Λ × is a matrix of factor loadings, F × is a vector of −factors, × is a vector of −unique factors and × is the factor solution (vector of common factors). Also the unique factors have a mean of zero, %& ) = 0, common and unique factors are uncorrelated, %&! ) = 0 and that the variance of the common factor equals one (1), ()*&!) = 1.
Succinctly from (1) and (2), the model can be written as
,= ∑./ ,. .+0, (4)
where 1 = 1,2, ⋯ , ; 3 = 1,2, ⋯ ,
Hence equation (3)|(4) is referred to as the 5 −
!)678* 5890:.
From (4), introducing variance results to the Communality of , with the factors seeks to measure or explain the variations in , that is:
()*& ,) = ∑./ ,. ()*&.) + ()*&0,) (5)
()*& ,) = ∑./ ,. (6)
From (5), a measure of the unique variance of , through change of subject yields
()*&0,) = 1 − ∑./ ,. (7)
2.2. Assumptions of Factor Analysis
Factor Analysis is designed for interval scale data, although it can also be used for ordinal scale data (e.g. scores assigned to Likert scale).
The variables used in Factor Analysis should be linearly related to each other. This can be checked by looking at scatterplots of pairs of variables.
Obviously, the variables must also be at least moderately correlated to each other; otherwise the number of factors will be at most the same as the original variables, which means
carrying out a Factor Analysis would be pointless [65]. The sample size chosen for the study should be large enough so as to obtain reliable estimates of correlations among the variables.
Observation that is far from the rest of the observations (outliers) should be checked and corrected either by removing it or recording to a less extreme value.
Statistical tests such as the Bartlett’s test of Sphericity should be significant at the specified level of significance and Kaiser-Meyer-Olkins (KMO) Measure of Sampling Adequacy must be high. Experience has shown that
;5< > 0.6 is an indication of appropriateness of Factor Analysis.
2.3. Determining the Number of Factors to Retain
Several methods are available to determine the criteria for retaining the number of factors with their own inherent challenges and notable among them is the Scree test [66], [67] eigenvalue-greater-than-1 rule, and Parallel Analysis [68]. According to [66] cited in [69], the scree test is performed by searching for an “elbow” in the plot, or an abrupt transition from large to small eigenvalues. [70] noted that scree plots can be ambiguous due to the presence of more than one discontinuity in the graph or the lack of a visible discontinuity.
Due to the presence of a discontinuity in a scree plot, ‘stopping rule’ has been devised and according to [71], Kaiser criterion is the most commonly used stopping rule. The rule sets the threshold between large and small values at an eigenvalue of 1. Each eigenvalue greater than 1 is interpreted as representing a factor, and each value below 1 is not.
The basis for the rule is that, a factor should not account for less total item variance than a single item [67] cited in [69]. However, this criterion fails to take into account normal sampling error. As [72] noted, the difference between eigenvalues of 1.01 and 0.99 is negligible and may be due to nothing more than sampling error, yet the former value will be considered indicative of a factor while the latter value will not. Moreover, sampling error will yield some eigenvalues greater than 1 even when there are no latent factors. Unsurprisingly, this criterion has been found to identify too many factors [73].
3. Results and Discussion
Table 1. Measures of Goodness of Fit.
Cronbach’s Alpha Reliability Coefficient 0.7661
Correlation Matrix Determinant 0.036
Bartlett’s Test of Sphericity
Chi-Square 1298.469
Degree of freedom 153
p-value 0.000
Kaiser-Meyer-Olkin (KMO) Measure of Sampling Adequacy 0.797
The internal consistency of the questionnaire was assessed using Cronbach’s alpha reliability coefficient. A coefficient value of 0.7661 was obtained which implies that should the instrument be replicated in a similar environment the result is almost 77% likely to always be the same. The reliability coefficient of 0.7661 is in line with a study by [74] indicating that “a value of 0.6 or more indicates satisfactory internal consistency reliability”.
The Determinant of the Correlation Matrix was also assessed to check the assumption of multi-collinearity among the manifest variables and with a value of 0.036 quite different from zero, refutes the presence of such an assumption.
Assessment from the Bartlett’s Test also revealed a Chi-Square value of 1298.469, degree of freedom153and a p-value of 0.000 < @ −value of 0.05 which is highly significant at the 5% level of significance confirming that the correlation matrix is not an identity matrix (manifest variables in the correlation matrix are collinear).
Also, the Kaiser-Meyer-Olkin (KMO) Measure of Sampling Adequacy value of 0.797 can be said to be “middling” [75] and a value high enough to signal that the manifest variables have so much in common to warrant the basis for the application of Factor Analysis to the empirical data.
Table 2. Total Explained Communalities.
Factor Eigenvalue Difference Proportion Cumulative
Factor 1 3.87926 1.92090 0.2155 0.2155
Factor 2 1.95836 0.64796 0.1088 0.3243
Factor 3 1.31040 0.01733 0.0728 0.3971
Factor 4 1.29307 0.21921 0.0718 0.4689
Factor 5 1.07386 0.09038 0.0597 0.5286
Factor 6 0.98347 0.11148 0.0546 0.5832
Factor 7 0.87200 0.04889 0.0484 0.6317
Factor 8 0.82311 0.09703 0.0457 0.6774
Factor 9 0.72608 0.01913 0.0403 0.7178
Factor 10 0.70695 0.03690 0.0393 0.7570
Factor 11 0.67005 0.05191 0.0372 0.7943
Factor 12 0.61814 0.01179 0.0343 0.8286
Factor 13 0.60635 0.04462 0.0337 0.8623
Factor 14 0.56173 0.02512 0.0312 0.8935
Factor 15 0.53661 0.02841 0.0298 0.9233
Factor 16 0.50820 0.04131 0.0282 0.9515
Factor 17 0.46689 0.06140 0.0259 0.9775
Factor 18 0.40549 . 0.0225 1
Method: Principal-Component Factors.
Using the eigenvalue-greater-than-one (1) retention criteria [67], a total of five factors were retained in this study representing approximately 53% of the total variance being accounted for whiles the remaining thirteen (13) factors wholly or partially accounted for approximately 47% of the total variance unexplained.
The results showed that five factors emerged significant in this study with their eigenvalues above one (1) and hence deserve to represent the five latent factors whiles the remaining thirteen (13) factors are discarded since their eigenvalues are less than one (1).
Table 3 presents the proportion of communality and unique
(specific) variance accounted for by the common factors and the independent variables. It is evident that almost all the measured variables recorded a percentage variability of 50% and above which is an indication that most of the observed variables have been explained by the common factors.
Table 3. Initial Variance, Communality and Unique Variances of Manifest Variables.
Variable Initial Variance Communality Uniqueness
Low Income Generation from the Assembly 1.000 0.6849 0.3151
Low Funding for Waste Management 1.000 0.6661 0.3339
High Cost of Waste Management 1.000 0.6770 0.3230
Inadequate Waste Assessment 1.000 0.4063 0.5937
Inadequate Landfill Disposal Site 1.000 0.5603 0.4397
Low Communal Labor 1.000 0.4559 0.5441
Negative Cultural Beliefs 1.000 0.6435 0.3565
Poor Education on Waste Management 1.000 0.3986 0.6014
Distance to Landfill Site 1.000 0.5554 0.4446
Inadequate Recycling Facilities 1.000 0.5442 0.4558
Inadequate Dustbins 1.000 0.5652 0.4348
Delay in Picking Dustbins 1.000 0.4413 0.5587
Lack of Regulations/Bye-Laws 1.000 0.5414 0.4586
Lack of Knowledge on Environmental Laws 1.000 0.5561 0.4439
Lack of Policy Enforcement 1.000 0.4604 0.5396
Attitudes of Waste Service Provider’s 1.000 0.5627 0.4373
Poor Waste Treatment 1.000 0.3191 0.6809
Attitude of Community Members 1.000 0.4767 0.5233
Method: Principal-Component Factors.
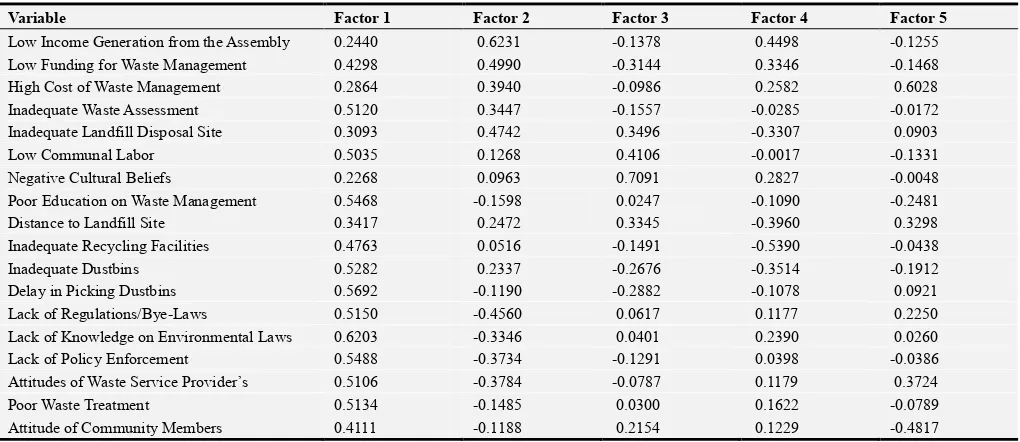
Table 4. Unrotated Factor Loadings (Pattern Matrix).
Variable Factor 1 Factor 2 Factor 3 Factor 4 Factor 5
Low Income Generation from the Assembly 0.2440 0.6231 -0.1378 0.4498 -0.1255
Low Funding for Waste Management 0.4298 0.4990 -0.3144 0.3346 -0.1468
High Cost of Waste Management 0.2864 0.3940 -0.0986 0.2582 0.6028
Inadequate Waste Assessment 0.5120 0.3447 -0.1557 -0.0285 -0.0172
Inadequate Landfill Disposal Site 0.3093 0.4742 0.3496 -0.3307 0.0903
Low Communal Labor 0.5035 0.1268 0.4106 -0.0017 -0.1331
Negative Cultural Beliefs 0.2268 0.0963 0.7091 0.2827 -0.0048
Poor Education on Waste Management 0.5468 -0.1598 0.0247 -0.1090 -0.2481
Distance to Landfill Site 0.3417 0.2472 0.3345 -0.3960 0.3298
Inadequate Recycling Facilities 0.4763 0.0516 -0.1491 -0.5390 -0.0438
Inadequate Dustbins 0.5282 0.2337 -0.2676 -0.3514 -0.1912
Delay in Picking Dustbins 0.5692 -0.1190 -0.2882 -0.1078 0.0921
Lack of Regulations/Bye-Laws 0.5150 -0.4560 0.0617 0.1177 0.2250
Lack of Knowledge on Environmental Laws 0.6203 -0.3346 0.0401 0.2390 0.0260
Lack of Policy Enforcement 0.5488 -0.3734 -0.1291 0.0398 -0.0386
Attitudes of Waste Service Provider’s 0.5106 -0.3784 -0.0787 0.1179 0.3724
Poor Waste Treatment 0.5134 -0.1485 0.0300 0.1622 -0.0789
Attitude of Community Members 0.4111 -0.1188 0.2154 0.1229 -0.4817
Method: Principal-Component Factors.
To interpret Factor Analysis, it is necessary to consider the size of the factor loadings (scores) for each measured variable. As a rule of thumb, high loadings are indicative of the fact that such sets of indicator variables constitute a latent factor whiles small loadings suggest they are not a latent factor.
Using a cut-off point of 0.6 as a threshold for this study, the first factor loaded high (0.6203) on only the measured variable (Lack of Knowledge on Environmental Laws), the second factor loaded high (0.6231) on the manifest variable (Low Income Generation from Assembly), the third factor loaded high (0.7091) on the indicator variable (Negative Cultural Beliefs), the fifth factor loaded high (0.6028) on the measured variable (High Cost of Waste Management) whiles
the remaining factor (that is factor four) loaded low below the threshold of 0.6.
Since the loadings (scores) associated with the indicator variables in general did not load high on all the factors and also two or more manifest variables did not come together to form a common factor, it becomes difficult interpreting the Unrotated Factor Loadings (Pattern Matrix) hence we resort to the Varimax Rotated Factor Loadings with Kaiser Normalisation for easy interpretation.
Table 5. Suppressed Rotated Factor Loadings (Pattern Matrix).
Variable Factor 1 Factor 2 Factor 3 Factor 4 Factor 5
Low Income Generation from the Assembly 0.8130
Low Funding for Waste Management 0.7844
High Cost of Waste Management Inadequate Waste Assessment
Inadequate Landfill Disposal Site 0.6858
Low Communal Labor Negative Cultural Beliefs
Poor Education on Waste Management
Distance to Landfill Site 0.7006
Inadequate Recycling Facilities 0.6728
Inadequate Dustbins 0.6730
Delay in Picking Dustbins
Lack of Regulations/Bye-Laws 0.7219
Lack of Knowledge on Environmental Laws 0.6875 Lack of Policy Enforcement
Attitudes of Waste Service Provider’s 0.7366
Poor Waste Treatment
Attitude of Community Members 0.6517
Method: Principal-Component Factors, Rotation: Orthogonal Varimax (Kaiser on).
Table 5 is the results of the Varimax Rotation with Kaiser Normalisation for factor loadings suppressed at 0.6. In the above results, three indicator variables (Lack of Regulations/Bye-Laws, Lack of Knowledge on Environmental Laws and Attitude of Waste Service Provider’s) loaded high on Factor 1. A careful inspection of these indicator variables on Factor 1 relates to “Institutional Dormancy”.
Factor 2 has two manifest variables (Low Income Generation from the Assembly and Low Funding for Waste Management) which were found to have high loadings. An introspection of these two variables on Factor 2 depicts “Financial Constraint”.
Examination of Factor 3 with indicator variables (Inadequate Recycling Facilities and Inadequate Dustbins) which loaded high on it can be said to portray “Infrastructural Lapses”.
Also Factor 4 had the observed variables (Inadequate Landfill Disposal Site and Distance to Landfill Site) loading high on it and Factor 5 had only the independent variable (Attitude of Community Members) loading high on it. The Factor 4 can be viewed in terms of “Accessibility” whiles Factor 5 connotes “Behavioral Canker”.
The first factor comprises of (Lack of Regulations/Bye-Laws, Lack of Knowledge on Environmental Laws and Attitudes of Waste Service Providers) which we classified as “Institutional Dormancy” is an important factor accounting for the waste situation in the municipality. The respondents generally believed that, the lack of regulations/bye-laws, lack of knowledge on Environmental Laws and Attitudes of Waste Service Providers contribute immensely to the problem of waste management in the municipality. This is in line with the view of [76] who points out that, lack of social pressure to prevent littering, absence of realistic penalties or
consistent enforcement and lack of knowledge of the environmental effects of littering accounts for poor waste management. Similarly, [8] submit that public awareness and attitudes about waste can affect the whole solid waste management system. An earlier study by [77] suggested that, to overcome the burden of solid waste crises, the conscience of individuals need to be raised through environmental awareness and concern, inculcation of sustainable consumption practices and education on waste management. In Ghana and for that matter the Bolgatanga municipality, there are institutions of state with the express mandate to ensure sound waste disposal and management practices. This position is corroborated by [78] who also shares the opinion that, Ghana has almost all the institutions, agencies and policies for waste management at all levels of government; from the central government down to the very grass-root level of unit committees. However, despite all these institutions and policies, the problems of waste management continue to linger on. In Kenya for example, [50] espouse a similar concern and according to them, although there is sufficient legislation covering waste management, local authorities lack the capacity to implement them. The lack of knowledge due to low public education and awareness on environmental and waste issues, lack of regulations/bye-laws and enforcement of same is a clear case of the responsible institutions sleeping on the job. [79] observed that, extremely slow and inefficient institutional structures have had a disastrous effect on the quality and reach of solid waste management services in many regions in the developing world. The institutions charged with the responsibility of ensuring a safe environment must sit up and live up to their job functions.
“Financial Constraint” plays a significant role in waste management in the Bolgatanga municipality. The inability of the municipality to raise enough funds coupled with low funding for waste management activities in the municipality has put the state of affairs with regards to sanitation in a sorry state. According to [80], local governments usually do not have adequate resources to deal with the issues of waste generation. [81] emphasizes that, inadequate budgetary allocation is a major impediment to waste management. [82] observed that, limited government budget limits opportunities for the development of sustainable solid waste management systems and as such proper waste management is overlooked. Again [83] presented that, due to lack of organization, financial resources, complexity and system multidimensionality, municipalities are not able to perform activities such as collection, storage, transportation, processing, treatment and disposal which are their responsibility. It is therefore important for the authorities of Bolgatanga municipality to take steps to expand their revenue base and also seek for external support to fund waste management programs.
The third factor (Inadequate Recycling Facilities and Inadequate Dustbins) which we coined as “Infrastructural Lapses” contribute greatly to the poor state of sanitation in the municipality. The absence or lack of adequate recycling facilities and dustbins largely accounts for the huge litters of waste in the environment. In fact, even when people are environmentally conscious and ready to practice proper waste disposal, they may be caught in the web of the tragedy of fate if the necessary infrastructure is not in place. Even such people may be compelled to dispose-off their waste anyhow. Studies from [50], [84-88] also acknowledged infrastructural problems as a major obstacle to sustainable solid waste management systems in developing countries like India, Botswana and Honduras. In view of this, the provision of the necessary infrastructure is nonnegotiable in the effort to stem the menace of indiscriminate disposal of waste in the municipality. Authorities can also initiate programs that sought to stretch the creativity of individuals on alternative uses of waste or innovative ways of dealing with waste in a sustainable way.
The fourth factor (Inadequate Landfill Disposal Site and Distance to Landfill Site) is being described as “Accessibility”. When people lack landfill sites or the distance to the landfill site is very far from them, they tend to dispose of their waste indiscriminately or adopt unapproved modes of waste disposal like burning or throwing them into water bodies. In Nairobi city of Kenya, [36] observed that, majority of residents from poorer areas who had no storage receptacles resorted to indiscriminate dumping and burning. Also a study by [89] on recycling behaviors in India revealed that, location and convenience are important determinants of waste disposal. To address this issue, provision of adequate landfill sites at strategic locations is very paramount.
Lastly, factor five (Attitude of Community Members) is named “Behavioral Canker”. It has often been postulated
that, the canker of waste is as a result of human behavior and therefore the remedy lies in changing behavior [90]. In Botswana, it was realized in a study that, though the people were aware of recycling and other sustainable waste management practices, that did not necessarily culminate in the people undertaking pro-environmental activities such as recycling initiatives [85]. In the work of [55], they pointed out that, people sometimes become used to indiscriminately throwing their waste onto the streets and other wrong places due to the absence of a proper disposal systems in their communities. Such people become adamant to change out of pure habit and custom when changes are instituted. It is therefore important for effective behavior change communication strategies be adopted to drive change in people’s behavior towards the environment in a responsible manner. As suggested by [77], the conscience of individuals needs to be raised through environmental awareness and concern, inculcation of sustainable consumption practices and education on waste management. Authorities must also ensure that, a reorientation of the mindset starts with children by inculcating behavior change programs and environmental programs at the basic schools through to the tertiary institutions.
4. Conclusion
The study discovered five latent factors that are “Institutional Dormancy”, “Financial Constraint”, “Infrastructural Lapses”, “Accessibility” and “Behavioral Canker” as factors regarded in order of priority towards Solid Waste Management in Bolgatanga municipality. To improve waste management in the municipality, the authorities of Bolgatanga municipality must as a matter of necessity endeavor to address these factors by adopting innovative and sustainable solutions to these five factors.
Sanitation is a global issue and is interrelated with the attainment of the several SDGs. It is therefore important to tackle the challenges of sanitation head-on. Government can by way of policy tie issues of waste management to the performance appraisal of the various districts and municipal assemblies. An initiative like that will compel authorities to move out of their comfort zones and seek innovative and sustainable approaches to dealing with the waste confronting their assemblies.
References
[1] Environment Protection Authority (2009). Waste Guidelines, South Australia.
https://www.epa.sa.gov.au/files/4771336_guide_waste_definit ions.pdf
[2] United Nations Statistics Division (UNSD), (1997). Glossary of Environment Statistics.
[4] Wokekoro, E. (2007). Solid Waste Management in the Construction Industry: A Case Study of Port Harcourt Metropolis. International Conference “Waste Management, Environmental Geotechnology and Global Sustainable Development (ICWMEGGSD'07 - GzO'07)” Ljubljana, SLOVENIA, August 28-30.
[5] Mwayafu, D. (2010). Waste plastic Disposal: A grave problem UCSD.
www.ugandacoalition.or.ug/sites/default/files/Waste%20plasti c%20Disposalpdf.pdf
[6] Abagale, K. F., Mensah, A. and Osei, A. R. (2012). “Urban solid waste sorting in a growing city of Ghana”, International Journal of Environment and Sustainability, Vol. 1, No. 4, Pp 18-25, available online at www.sciencetarget.com
[7] Oyelola, O. T., Babatunde, A. I. and Abiodun, A. A. (2011), “Appraisal of Municipal Solid Waste Management in Lagos Metropolis”, Wilolud Journals, Vol. 2, No. 2, Pp 1-7. Available on line at wwwiloludjournal.com
[8] Zhu, D., et al. (2008). Improving Municipal Solid Waste Management in India: A Source Book for Policy Makers and Practitioners. World Bank, Washington D. C.
[9] Narayana, T. (2009). Municipal Solid Waste Management in India: From Waste Disposal to Recovery of Resources? Waste Management, 29(3), 1163-1166. doi: 10. 1016/j. wasman. 2008. 06. 038.
[10] Oteng-Ababio, M., Melara, J. E. and Gabbay, O. (2012). Solid waste management in African cities: Sorting the facts from the fads in Accra, Ghana, Habitat International, 39:96-104. [11] Grossmann, D., Hudson, J. F. & Marks, D. H. (1974). Waste
generation models for solid waste collection. Journal of the Environmental Engineering Division, 100(6), 1219–1230. [12] Wertz, K. L. (1976). Economic factors influencing
household’s production of refuse. Journal of Environmental Management and Economics, 2, 263–272.
[13] Medina, M. (1997). The effect of income on municipal solid waste generation rates for countries of varying levels of economic development: A model. Journal of Resource Management and Technology, 24, 149–155.
[14] UNEP, International Source Book on Environmentally Sound Technologies for Municipal Solid Waste Management, (IETC) Technical Publication, no. 6, 2002.
[15] Nilanthi, J. G. J. B., et al. (2006). Relation of waste generation and composition to socio-economic factors: A case study. Environmental Monitoring and Assessment, 135, 31–39. [16] Gidde, M. R., Todkar, V. V. & Kokate, K. K. (2008). Municipal
solid waste management in emerging mega cities: a case of study of Pune city. Proceedings of Indo Italian Conference on Green and Clean Environment, Pune, India (March 20-21). [17] Minghua, Z., et al. (2009). Municipal solid waste management
in Pudong New Area, China. Waste Management, 29:1227-1233. doi:10. 1016/j. wasman. 2008. 07. 016.
[18] Afroz, R., Hanaki, K. and Tudin, R. (2010). Factors affecting waste generation: a study in a waste management program in Dhaka City, Bangladesh. Environ Monit Assess (2011) 179:509–519. DOI 10. 1007/s10661-010-1753-4.
[19] Ukpong, I. E. and Udofia, E. P. (2011). Domestic Solid Waste
Management in a Rapidly Growing Nigerian City of Uyo. Journal of Human Ecology, 36(3), 229-235.
[20] Thanh, N. P., Matsui, Y. and Fujiwara, T. (2011). Assessment of plastic waste generation and its potential recycling of household solid waste in Can Tho City, Vietnam. Environ. Monit Assess, 175:23-35
[21] Olukanni, D. O. and Akinyinka, M. O. (2012). Environment, Health and Wealth: Towards an Analysis of Municipal Solid Waste Management in Ota, Ogun State, Nigeria. Proc. ICCEM (2012), pp. 138 – 145.
[22] Wilson, D. C., et al. (2012). Comparative analysis of solid waste management in 20 cities. Waste Management & Research, 30(3):237-254. DOI: 10. 1177/0734242X12437569. [23] Tahir, M., Hussain, T. and Behaylu, A. (2015). Scenerio of Present and Future of Solid Waste Generation in India: A Case study of Delhi Mega City. J. of Environ and Earth Sci., 5(8), 83-91. [24] Loboka, M. K., et al. (2013). Municipal solid waste
management practices and fecal coliform water contamination in the cities of the developing countries: The case of Juba, South Sudan. Int. J. Environ. Sci., 3(5): 1614-1624.
[25] Jilani, T. (2002). State of Solid Waste Management in Khulna City, Unpublished Undergraduate thesis, Environmental Science Discipline, Khulna University Khulna, pp. 25– 85. [26] Suchitra, M. (2007). Outside: Burnt or buried, garbage needs
land, Down to Earth, pp 22–24.
[27] Bean, E. A., Rovers, F. A. and Farquhar, G. J. (1995). Solid Waste Landfill Engineering and Design, Prentice Hall, NJ, pp380.
[28] WHO (World Health Organization), (2000). The world health report 2000: Health systems: Improving performance. WHO, Geneva 27, Switzerland.
[29] UNEP (United Nations Environment Programme), (1996). Kenya Waste Management Sector. Chapter 2. http://www.unep.org/PDF/Kenya_waste_mngnt_sector/chapte r2.pdf
[30] Boadi, K. O. and Markku, K. (2005). Environment and health impacts of household solid waste handling and disposal practices in the third world cities: The case of Accra Metropolitan Area, Ghana. J. Environ. Health, 68(4): 34-36. [31] Domfeh, K. (2009). Some environmental factors affecting
health in the Greater Accra Metropolitan Area, Ghana. Environments, 27: 1-13.
[32] Attipoe, D. (1996). The Community environment and health: The role of metropolitan, municipal and district assemblies. Paper presented at the Ghana Medical Association Annual General and Scientific Meeting.
[33] Ministry of Local Government and Rural Development (MLGRD) Environmental Sanitation Policy 2009 (Revised 2010). Government of Ghana, 2010.
[34] Ghana Statistical Service (2010). 2010 Population and housing Census, District Analytical Report, Bolgatanga Municipality.
[36] Mwanthi, M. A., Nyabola, L. O. and Tenambergen, E. (1997). Solid waste management in Nairobi City: Knowledge and attitudes. Journal of Environmental Health, 60(5), 23-29. [37] Goett, J. (1998). Waste and resource: Household management
of solid waste on the North Coast of Honduras. Yearbook. Conference of Latin Americanist Geographers, 24, 111-119. [38] Hilburn, A. M. (2015). Participatory risk mapping of
garbage-related issues in a rural Mexican municipality. Geographical Review, 105(1), 41-60.
[39] Kofoworola, O. F. (2007). “Recovery and recycling practices in municipal solid waste management in Lagos, Nigeria”, Waste Management Journal, Vol. 27, No. 9, Pp 1139-1143.
[40] Aliu, I. R., Adeyemi, O. E. and Adebayo, A. (2014). Municipal Household Solid Waste Collection Strategies in an African megacity: Analysis of Public Private Partnership Performance in Lagos. Waste Mgt. and Res., 32(9), 67-78. [41] Schubeller, P., Wehrle, K. and Christen, J. (1996), “Urban
Management and Infrastructure. Conceptual Framework for Municipal Solid Waste Management in Low-Income Countries”. Working Paper No. 9., UNDP/UNCHS (Habitat/World Bank/SDC Collaborative Programme on Municipal Solid Waste Management in Low- Income Countries). St. Gallen, SKAT.
[42] Gilpin, A. (1996). “Dictionary of Environment and Development”, John Wiley and Sons, Chester and New York. [43] Gbekor, A. (2003). “Domestic Waste Management”, Ghana
Environmental Protection Agency (EPA) Newsletter, Vol. 47, No. 5. Ghana EPA, Accra.
[44] Joseph, K. (2006). Stakeholder participation for sustainable waste management. Habitat Int, 30: 863-871.
[45] UN-HABITAT (2010). Collection of Municipal Solid Waste in Developing Countries. Malta: Gutenberg Press.
[46] Worrel, W. A. and Vesilind P. A. (2012). Solid Waste Engineering. Second Edition, Cengage Learning, Stanford, CT.
[47] Melosi, M. V. (1981). Garbage in the Cities: Refuse, Reform, and Environment, 1880-1980, first ed. Texas A&M University Press, College Station, Tex.
[48] Pfammatter, R., and Schertenleib, R. (1996). Nongovernmental refuse collection in low-income urban areas (Lessons learned from selected schemes in Asia, Africa and Latin America. SANDEC Report No. 1/96). Water and Sanitation in Developing Countries. Duebendorf, Switzerland: EAWAG/SANDEC.
[49] Sinha, A. and Enayetullah, M. I. (2000). Community based solid waste management: The Asian experience. Dhaka: Waste Concern & USAID.
[50] Henry R. K, Yongsheng, Z. and Jun D. (2006). Municipal solid waste management challenges in developing countries – Kenyan case study. Waste Management 26(1), 92-100. [51] Wilson, D. C. (2007). Development drivers for solid waste
management. Waste Management and Research, 25(3), 198-207.
[52] Medina, M. (2010). Solid Wastes, Poverty and the Environment in Developing Country Cities: Challenges and
Opportunities. WIDER Working Paper 2010/023. Helsinki: UNU-WIDER.
[53] Achankeng, E. (2003). Globalisation, Urbanisation and Municipality Solid Waste management in Africa. Proceedings of the African Studies Association of Australasia and the Pacific, 2003, Africa on a Global Stage.
[54] Wang, H., He, J., Kimand, Y. and Kamata, T. (2011). Municipal Solid Waste Management in Small Towns: An Economic Analysis Conducted in Yunnan, China. Policy Research working paper, no. WPS 5767. https://openknowledge.worldbank.org/handle/10986/3529 [55] Yousif, D. F. and Scott, S. (2007). Governing solid waste in
Mazatengo, Guetemala. International Development Planning Review, 29(4), 433-450. https://doi.org/10.3828/idpr.29.4.2 [56] Okot-Okumu, J. and Nyenje, R. (2011). Municipal solid waste
management under decentralisation in Uganda. Habital International, 35, 537-543.
[57] Alnaa S. E., Ahiakpor F. and Aglobitse P. B. (2011). Willingness to Pay for Efficient Waste Management: The Case of Bolgatanga Municipality. The Oguaa Journal of Social Sciences (JOSS) 6(1): 170-189.
[58] Buzong B. Y., Maxwell A. G. & Maurice M. B. (2016). State of Waste Management and the Willingness of Households to Sort Plastic Wastes before Disposal in Bolgatanga Municipality. Haya: Saudi J. Life Sci.; Vol-1, Iss-2(Apr-Jun, 2016):76-84. DOI: 10. 21276/haya. 2016. 1. 2. 4.
[59] Songsore, J. and McGranaham, G. (1993). Environment, wealth and health: Towards an analysis of intra-urban differentials within the Greater Accra Metropolitan Area, Ghana. Environment and Urbanization, 5 (2). http://dx.doi.org/10.1177/095624789300500203
[60] Boyacioglu, H., Buyaciouglu, H. and Gunduz, O. (2005). Application of Factor Analysis in the Assessment of Surface Water Quality in Buyuk Menderes River Basin. European Water, 9(10): 43-49.
[61] Srivastava, S. K. and Ramanathan, A. L. (2007). Geochemical assessment of groundwater quality in vicinity of Bhalswa landfill, Delhi, India, using graphical and multivariate statistical methods. Environmental Geology 53: 1509-1528.
[62] Bustamante, M. A., et al. (2010). Use of chemometrics in the chemical and microbiological characterization of composts from agro industrial wastes. Bioresour. Technol., 101(11): 4068-4074. DOI: 10. 1016/j. biortech. 2010. 01. 085.
[63] Lin C., et al. (2011). Multivariate Statistical Factor and Cluster Analyses for Selecting Food Waste Optimal Recycling Methods. Environ. Eng. Sci., 28:349-356.
[64] Comfrey, A. L. & Lee, H. B. (1992). A First Course in Factor Analysis. Hillsdale, NJ: Lawrence Erlbaum Associates. [65] Rosie, C. (2007). Factor Analysis, Mathematics Learning
Support Centre.
http://www.statstutor.ac.uk/resources/uploaded/factoranalysis. pdf
[67] Kaiser, H. F. (1960). The application of electronic computers to factor analysis. Educational and Psychological
Measurement, 20, 141–151. doi: 10. 1177/001316446002000116.
[68] Horn, J. L. (1965). A rationale and test for the number of factors in factor analysis. Psychometrika, 30, 179–185. doi:10. 1007/BF02289447.
[69] John R. and Brendan, R. (2012). Determining the Number of Factors to Retain in an Exploratory Factor Analysis Using Comparison Data of Known Factorial Structure, Psychological Assessment; Vol. 24, No. 2, 282–292. DOI: 10. 1037/a002569. [70] Gorsuch, R. L. (1983). Factor analysis (2nd ed.). Hillsdale,
NJ: Erlbaum.
[71] Henson, R. K. and Roberts, J. K. (2006). Use of exploratory factor analysis in published research: Common errors and some comment on improved practice. Educational and Psychological Measurement, 66(3), 393–416. doi: 10. 1177/0013164405282485.
[72] Turner, N. E. (1998). The effect of common variance and structure pattern on random data eigenvalues: Implications for the accuracy of parallel analysis. Educational and Psychological Measurement, 58, 541–568. doi: 10. 1177/0013164498058004001.
[73] Fabrigar, L.R., et al. (1999). Evaluating the use of exploratory factor analysis in psychological research. Psychological Methods, 4, 272–299. doi: 10. 1037/1082-989X. 4.3. 272. [74] Churchill, G. A., JR. (1979). A Paradigm for Developing
Better Measures of Marketing Research Constructs”, Journal of Marketing Research, 16, 64-73.
[75] Kaiser, H. F. (1974). An index of factor simplicity. Psychometrika, 39: 31–36.
[76] Al-Khatib, I. A., et al. (2009). Enhanced solid waste management by understanding the effects of gender, income, marital status, and religious convictions on attitudes and practices related to street littering in Nablus – Palestinian territory. Waste Management, 29(1), 449-455. DOI:10. 1016/j. wasman. 2008. 02. 004.
[77] Aini, M. S., et al. (2002). Practices, attitudes and motives for domestic waste recycling. International Journal of Sustainable Development and World Ecology, 9(3), 232.
[78] Mariwah, S. (2012), “Institutional arrangements for managing solid waste in the Shama-Ahanta-East Metropolis, Ghana”,
Journal of Sustainable Development in Africa, Volume 14, No. 6, Clarion University of Pennsylvania, Clarion, Pennsylvania. [79] Marshall R. E. & Farahbaksh, K. (2013). Systems approaches
to integrated solid waste management in developing countries. Waste Management, 33, 988-1003.
[80] Sujauddin, M., Huda S. M. S. and Hoque A. T. M. R. (2008). Household solid waste characteristics and management in Chittagong, Bangladesh. Waste Manage, 28(9): 1688-1695. [81] Burnley, S. J. (2007). A review of municipal solid waste
composition in the United Kingdom Waste Manage., 27(10), 1274-1285. https://doi.org/10.1016/j.wasman.2006.06.018 [82] Al-Khatib, I. A., et al. (2010). Solid waste characterization,
quantification and management practices in developing countries. A case study: Nablus district – Palestine. Journal of Environmental Management, 91(5), 1131-1138. doi:10. 1016/j. jenvman. 2010. 01. 003.
[83] Al-Khatib, I. A., et al. (2015). Public perception of hazardousness caused by current trends of municipal solid waste management. Waste Management, 36:323-330. doi: 10. 1016/j. wasman. 2014. 10. 026.
[84] Hoornweg, D. and Giannelli, N. (2007). Managing municipal solid waste in Latin America and the Caribbean: Integrating the private sector, harnessing incentives. Gridlines, No. 28. World Bank, Washington DC.
[85] Bolaane, B. (2006). Constraints to promoting people centred approaches in recycling. Habitat International, 30(4), 731-740. http://dx.doi.org/10.1016/j.habitatint.2005.10.002.
[86] Oteng-Ababio, M. (2011). Missing links in solid waste management in the Greater Accra Metropolitan Area in Ghana. GeoJournal, 76(5), 551-560.
[87] O'Connell, E. J. (2011). Increasing public participation in municipal solid waste reduction. Geographical Bulletin, 52(2), 105-118.
[88] Périou, C. (2012). Waste: The challenges facing developing countries. Proparco's Magazine, 1-27.
[89] Venkateswaran, S. (1994). Managing waste: Ecological, economic and social dimensions. Economic and Political Weekly, 29(45/46), 2907-2911.