INTERNATIONAL JOURNAL OF PHARMACEUTICAL, CHEMICAL AND BIOLOGICAL SCIENCES
Available online at
www.ijpcbs.com
DEVELOPMENT AND VALIDATION OF UV SPECTROPHOTOMETRIC
METHODS FOR THE ESTIMATION OF MICAFUNGIN IN BULK AND
PHARMACEUTICAL FORMULATIONS
SM. Anil Kumar
*, A. Satish Kumar Shetty and ND. Satyanarayan
Department of Pharmaceutical Analysis, National College of
Pharmacy, Shimoga-577 201, Karnataka, India.
INTRODUCTION
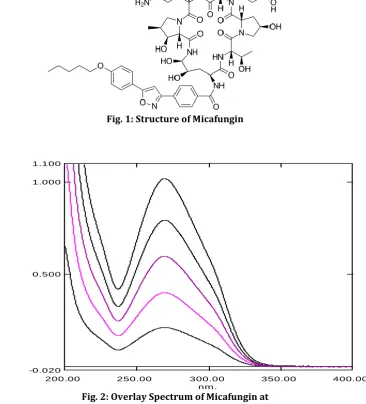
Micafungin (tradename Mycamine) {5-[(1S,2S)- 2-[(3S,6S,9S,11R,15S,18S,20R,21R,24S,25S,26S)-
3-[(1R)-2-carbamoyl-1-hydroxyethyl]- 11,20,21,25-tetrahydroxy-15-[(1R)-1- hydroxyethyl]-26-methyl-2,5,8,14,17,23- hexaoxo-18-(4-{5-[4-(pentyloxy)phenyl]-1,2- oxazol-3-yl}benzamido)-1,4,7,13,16,22- hexaazatricyclo[22.3.0.0⁹,¹³]heptacosan-6-yl]-
1,2-dihydroxyethyl]-2-hydroxyphenyl}oxidanesulfonicacidis
an echinocandin antifungal drug used to treat
and prevent invasive including candidemia, and abscesses and esophageal candidiasis.
Micafungin inhibits the synthesis of beta-1,3-D-glucan, an essential component of fungal cell walls which is not present in mammalian cells. It does this by inhibiting beta-1,3-D-glucan synthase1,2.
On literature survey it was revealed that several HPLC and UV or Mass spectrometric methods have been developed for the estimation of
micafungin in blood and plasma samples3,4,.
HPLC method for the estimation of micafungin
in related substances has been developed5.
Several methods have been reported on the
pharmacokinetic and saftey studies6. Since no
method has been found for the estimation of micafungin in bulk and pharmaceutical formulations, Here an attempt has been made to develop and validate simple , sensitive and precise UV Spectrophotometric methods for the estimation of micafungin in pure form and in formulation forms.
MATERIALS AND METHODS INSTRUMENTS USED
A double beam UV-VIS spectrophotometer (UV-1800, Shimadzu) connected to computer loaded with spectra manager software UV probe 2.4 with 10mm quartz cells was used. The spectra
were obtained with the instrumental
parameters as follows: wavelength range: 200-400nm. All weights were taken on electronic balance (Model Shimadzu AUX 120).
Research Article
ABSTRACT
The aim of present work was to develop an simple, accurate and precise zero order derivative method and First order derivative method for the estimation of Micafungin and validation according to ICH Q2(R1) guidelines. The absorbance maxima was determined at 269nm using Distilled Water .First order derivative spectrophotometric method has been developed at wavelength 249nm. The
methods represented the correlation coefficient R2 = 0.999 for zero order method and R2 = 0.999
for First order derivative at concentration range 8-40µg/ml for both methods.The methods were validated for the parameters such as linearity, accuracy, precision, limit of quantification & limit of detection as per ICH guidelines. The results suggested that the proposed methods were found to be cost effective, sensitive, precise and accurate and hence can be successfully applied for the routine analysis of Micafungin in bulk and formulations.
Standard stock solution
Micafungin (100mg) was accurately weighed and transferred in a 100ml volumetric flask. Volume was made up to 100ml with distilled water to obtain a concentration of 1000μg/ml (Stock-I). From Stock-I 10 ml of solution was withdrawn and transferred to a 100ml volumetric flask and made up the volume with distilled water to obtain a concentration of 100μg/ml (Stock-II). From the above stock
solution-II aliquots of 0.8ml, 1.6ml, 2.4ml, 3.2ml,
and 4ml were withdrawn and transferred into 10 ml volumetric flasks and made up the volume with distilled water to obtain a concentrations of 8µg/ml, 16µg/ml, 24µg/ml, 32µg/ml, and 40µg/ml respectively.
Determination of maximum wavelength
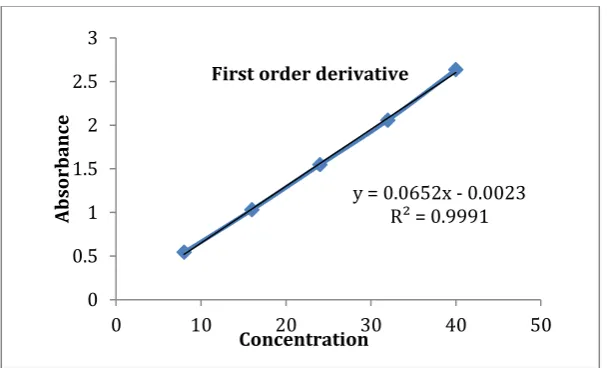
Micafungin 8-40 µg/ml solutions were scanned in UV spectrophotometer in the range of 200-400nm by using Distilled water as blank.
Preparation of standard calibration curve Zero order derivative
The standard calibration curve was obtained by measuring the absorbance of Micafungin solution in concentration range (8-40µg/ml) prepared from stock solutions in Distilled Water at 269nm . Calibration curve of Micafungin was plotted with absorbance on y-axis and Micafungin concentration on x-axis.
First order derivative spectroscopy
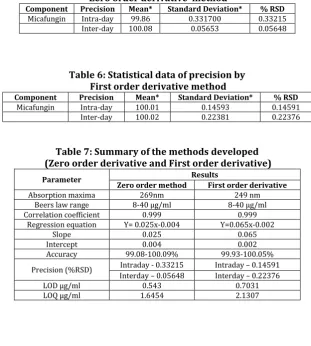
In this method solutions of Micafungin (8-40μg/ml) were prepared separately by appropriate dilution of standard stock solution and scanned in the spectrum mode from 200 to 400 nm. The absorption spectra obtained were derivatized to first order derivative peaks by taking scaling factor 100 and delta lambda 4. First order derivative spectra were selected for analysis of drug. The absorbance was measured at wavelength 249 nm for the respective concentration of standard and plotted against concentration and absorbance and regression equation was calculated.
RESULTS VALIDATION
The developed methods were validated as per ICH guidelines.
Linearity
The linearity was determined by using working
standard solution between 8-40µg/ml.
Absorbance values of these solutions were measured at wavelength 269nm in zero order and at 249nm in first order method. The value of
correlation coefficient for Micafungin
demonstrated the good relationship between absorbance and concentrations. Therefore, the developed methods were linear in concentration range of 8-40μg/ml.
Accuracy
The accuracy of the method was determined by calculating percent recovery of the drug by standard addition method. Percent recovery of Micafungin was determined at three different level 80%, 100% and 120% of the target concentration in triplicate absorbance was measured at wavelength 269nm for Zero order method and at 249nm for first order derivative method.
Precision
Precision of the methods were demonstrated by intraday and inter day variation studies. In Intraday variation , 24μg/ml of Micafungin solution was analysed six times in a day and the absorbance values were noted. From the parameters mean, Standard deviation were calculated. The acceptable limit for intraday variation should be within 2% and results shown in table 5 and 6 indicate the drug complied with the required limit.
In Interday variation studies, solution of 16μg/ml of Micafungin was analysed six times a day for three consecutive days and absorbance values were recorded.
LOD and LOQ
Limit of detection (LOD) is the lowest amount of analyte in the sample that can be detected. Limit of Quantification (LOQ) is the lowest amount of analyte in the sample that can be quantitatively determined by suitable precision and accuracy. LOD and LOQ were determined using the following equation.
LOQ =
LOD = 3.3
Where s is the standard deviation of the response and m is the slope of the related calibration curve. The LOD and LOQ were found to be 0.543 and 1.6454 for zero order derivative method .
The LOD and LOQ were found to be 0.7031 and 2.1307 respectively for First order derivative method.
DISCUSSION
The proposed methods provides a simple, accurate, economical and convenient methods for the analysis of Micafungin using UV
spectrophotometry. The wavelength
order and 269nm in first order derivative method. Beer’s law was obeyed in the concentration range of 8-40 µg/ml for both the methods with correlation coefficient 0.999. Accuracy of the proposed methods were determined by recovery studies, a good % recovery (99.08-100.09 % for Zero order method and 99.93-100.05 % for First order derivative method ) of the drug obtained indicates that the methods are accurate. The methods were found to be precise as %RSD values for interday and intraday was found to be less than 2%. The limit of detection and limit of quantification of the proposed zero order method was found to be 0.543 and 1.6454 respectively and for the First order derivative method was found to be 0.7031 and 2.1307 respectively. The results of the analysis of
pharmaceutical formulation by the developed methods was consistent with the label claim, highly reproducible and reliable.
CONCLUSION
The developed UV spectrophotometric methods for the estimation of Micafungin is simple, sensitive ,and economical. These methods were also validated by checking the parameters such as accuracy, precision, linearity, LOD and LOQ. The proposed methods showed high level of precision as depicted by low values of standard deviation and relative standard deviation. Hence these methods can be used for routine analysis of Micafungin in bulk and pharmaceutical formulations without interference of excipients and other additives.
Fig. 1: Structure of Micafungin
Fig. 2: Overlay Spectrum of Micafungin at 269nm (Zero order method)
nm .
200.00 250.00 300.00 350.00 400.00
Ab
s.
1.100
1.000
0.500
Fig. 3: Overlay Spectrum of Micafungin at 249nm (First order derivative)
Fig. 4 : Calibration curve of Micafungin for Zero order method
nm.
202.21 250.00 300.00 371.32
A
b
s.
4.900
4.000
2.000
0.000
-2.000
-4.000
-4.841
y = 0.0253x - 0.0043 R² = 0.9993
0 0.2 0.4 0.6 0.8 1 1.2
0 10 20 30 40 50
Concentration
Abs
or
ba
nce
Fig. 5: Calibration curve of Micafungin for first order derivative
Table 1: Linearity profile of Micafungin for Zero order derivative
Sr.No Concentration (µg/ml) 269.0 nm± S.D. Absorbance at
1 8 0.203±0.00850
2 16 0.401±0.00519
3 24 0.599±0.00264
4 32 0.794±0.00461
5 40 1.019±0.02137
Table 2: Linearity profile of Micafungin for First order derivative Sr.No Concentration (µg/ml) 269.0 nm± S.D. Absorbance at
1 8 0.542±0.01389
2 16 1.029±0.01443
3 24 1.546±0.00964
4 32 2.056±0.01069
5 40 2.635±0.05533
Table 3: Recovery studies for Zero order Derivative Level of %
recovery Mean* Deviation* Standard %RSD
80% 99.08 0.08333 0.08410
100% 99.88 0.23867 0.23895
120% 100.09 0.33942 0.33911
Table 4: Recovery studies for First order Derivative Level of %
recovery Mean* Deviation* Standard %RSD
80% 99.93 0.37807 0.37833
100% 99.98 0.17769 0.17771
120% 100.05 0.21262 0.21249
y = 0.0652x - 0.0023 R² = 0.9991
0 0.5 1 1.5 2 2.5 3
0 10 20 30 40 50
Concentration
Abs
or
ba
nce
Table 5: Statistical data of precision by Zero order derivative method
Component Precision Mean* Standard Deviation* % RSD
Micafungin Intra-day 99.86 0.331700 0.33215
Inter-day 100.08 0.05653 0.05648
Table 6: Statistical data of precision by First order derivative method
Component Precision Mean* Standard Deviation* % RSD
Micafungin Intra-day 100.01 0.14593 0.14591
Inter-day 100.02 0.22381 0.22376
Table 7: Summary of the methods developed (Zero order derivative and First order derivative)
Parameter Results
Zero order method First order derivative
Absorption maxima 269nm 249 nm
Beers law range 8-40 µg/ml 8-40 µg/ml
Correlation coefficient 0.999 0.999
Regression equation Y= 0.025x-0.004 Y=0.065x-0.002
Slope 0.025 0.065
Intercept 0.004 0.002
Accuracy 99.08-100.09% 99.93-100.05%
Precision (%RSD) Intraday - 0.33215 Intraday – 0.14591
Interday – 0.05648 Interday – 0.22376
LOD µg/ml 0.543 0.7031
LOQ µg/ml 1.6454 2.1307
REFERENCES
1. https://en.wikipedia.org/wiki/Micafun
gin.
2. https://www.drugbank.ca/drugs/DB01
141
3. Lobenhoffer JM, Rupprecht V, Stefanie
M and Boger B. Determination of micafungin and anidulafungin in human plasma: UV- or mass spectrometric quantification. J of chromatography B. 2011;879:2051-6.
4. Talviya S and Majmudar F. Analysis of
antifungal agents by RP-HPLC: a review. WJPPS. 2014; 3:397-409.
5. Zhu S, Meng X, Su X, Luo Y and Z Sun.
Development and validation of
stability-indicating HPLC method for
determination of related substances of Micafungin Sodium in drug substances.
Int J of Molecular sciences.
2013;14(11):21202-14.
6. Gloria HP, Dale GR, Michael RD, John
NVA and Blumer. The pharmacokinetics and safety of Micafungin, a novel Echinocandin, in premature infants. J of Paediatric infectious disease. 2006; 25:1110-5.
7. ICH, Harmonised Tripartite Guideline,