http://www.sciencepublishinggroup.com/j/ijmsa doi: 10.11648/j.ijmsa.20170604.16
ISSN: 2327-2635 (Print); ISSN: 2327-2643 (Online)
Correlation of the Effects of Alloying Elements on the
Hardenability of Steels to the Diffusion Coefficients of
Elements in Fe
Yoshiharu Mae
Maetech, Mimuro, Midori Ward, Saitama City, Japan
Email address:
To cite this article:
Yoshiharu Mae. Correlation of the Effects of Alloying Elements on the Hardenability of Steels to the Diffusion Coefficients of Elements in Fe. International Journal of Materials Science and Applications. Vol. 6, No. 4, 2017, pp. 200-206. doi: 10.11648/j.ijmsa.20170604.16 Received: June 21, 2017; Accepted: July 5, 2017; Published: July 17, 2017
Abstract:
The effects of various alloying elements on the hardenability of steels are known experimentally, but the reasons for these effects are not well understood. In this work, the upper critical cooling rate was selected as the index of hardenability. Changes in the upper critical cooling rate of steel caused by the presence of alloying elements and the diffusion coefficients of those elements in the ã-phase of Fe, plotted on thermal conductivity–Young’s modulus diagrams, showed similar patterns. The correlation between these factors was studied. Good correlation was found: the upper critical cooling rate decreased linearly with increasing diffusion coefficient of the alloying element in the ã-phase, i.e., the hardenability increased. It is considered that a large diffusion coefficient of an alloy element in the ã-phase increases its entropy and, on cooling, thermodynamically stabilizes the ã-phase, thereby preventing its transformation to the á-phase and retaining the ã-phase at a lower temperature, which consequently favors martensitic transformation even at low cooling rates.Keywords:
Hardenability, Steel, Diffusion Coefficient, Young’s Modulus, Thermal Conductivity1. Introduction
When the steel is rapidly cooled from the ã-phase, martensite forms and the steel is hardened. Hardenability refers to the ease with which martensite forms [1]. Plain-carbon steels have low hardenability, because they need rapid cooling such as water quenching. Alloyed steels have high hardenanbility, because martensite forms even by slow cooling such as air cooling. Alloying elements were added in order to improve hardenability of steels, and effects of various alloying elements on the hardenability of steels are known experimentally. But the reasons for these effects are not well understood.
On the other hand, the author has developed the TC-YM diagram, taking the thermal conductivity on the abscissa and Young’s modulus on the ordinate and plotting each element on it. Using this diagram, the mechanisms of the effects of the alloying elements on the hardenability of steels were studied.
Almost all elements in the Periodic Table can be classified
as metallic or semi-metallic. Although the Periodic Table provides excellent visualization of the properties and relationships between elements, it is difficult to apply it to specific metallurgical phenomena. The author has therefore attempted to create a graphical expression of the metallic and semi-metallic elements to enable interpretation of their metallurgical characteristics. In general, two main characteristics of the metallic elements are their crystal structure and their possession of free electrons. Among many possible physical properties, lattice strength, as represented by Young’s modulus, and free electron mobility, as represented by thermal conductivity, were therefore selected for the characterization.
binding state of atoms. Thermal conductivity can be considered to be related to the mobility of free electrons in atoms. This is also a physically fundamental factor. A diagram with thermal conductivity on the abscissa and Young’s modulus on the ordinate (TC–YM diagram) can therefore reflect the essential properties of atoms of the metallic and semi-metallic elements.
2. Crystal Structures of Elements
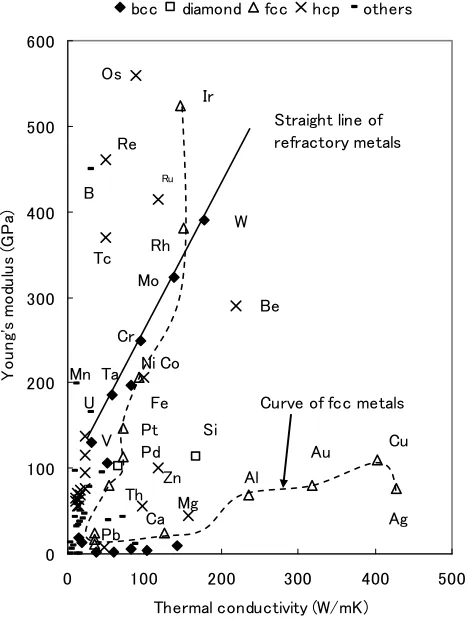
Figure 1 shows the distribution of the crystal structures of various elements on a TC–YM diagram.
Figure 1. Distribution of crystal structures of elements on the TC–TM diagram.
The crystal structures are classified as bcc (body-centered cubic), fcc (face-centered cubic), hcp (hexagonal close-packed), diamond structured, and “others” for miscellaneous structures [3]. The most remarkable feature of Figure 1 is that the bcc-structured elements mostly lie on a straight line connecting V, Ta, Cr, Mo, and W, which can be called the straight line of refractory metals. Fe is located near this line. Additionally, elements with fcc structures lie on a clear curve, which can be called the curve of fcc metals. In contrast, bcc-structured alkali metals lie on a curve near the abscissa (the curve of alkali metals). Elements with hcp and other structures are distributed elsewhere.
The TC–YM diagram therefore shows clear patterns with respect to the crystal structures of elements. Other elemental
properties, such as atomic radius, melting point, thermal expansion, boiling point, heat of fusion, vapor pressure, heat capacity, electronegativity, and ionization energy, also show clear patterns on TC–YM diagrams [4]. Because such diagrams can be considered as a tool to represent metallurgical phenomena, the mechanisms of the effects of alloying elements on the hardenability of steels were studied using this technique.
3. Effects of Alloying Elements on Upper
Critical Cooling Rates of Steel
There are several methods to evaluate the effect of alloying elements on the hardenability of steel; the upper critical cooling rate was selected because of the abundant available data. The upper critical cooling rate is the lowest cooling rate at which all grains transform into martensite. Figure 2 shows the changes in the upper critical cooling rate of 0.3 mass% C steel induced by various alloying elements as a function of alloy content in mol% (converted from original data expressed in mass%) [5].
Figure 2. Changes to the upper critical cooling rate of 0.3 mass% C steel by various alloying elements as a function of the alloy content (mol%) (S. Tawara [5]).
The critical cooling rate of unalloyed 0.3 mass% C steel is
0 100 200 300 400 500 600
0 100 200 300 400 500
Thermal conductivity (W/mK)
Y
o
u
n
g'
s
m
o
du
lu
s
(G
P
a)
bcc diamond fcc hcp others
Straight line of refractory metals
Curve of fcc metals
Ag Cu Au
Al Si Fe Rh
Ir
W
Mo
Cr
Ta
V Pt
Pd
Th
Pb Ca
Ni Co
Be
Mg Zn Os
Re
Ru
Tc B
Mn U
0 1 2 3 4 5 6 7
0 1000 2000 3000 4000 5000 6000
Critical cooling rate (℃/s)
A
ll
o
y
in
g
c
o
n
te
n
t
(m
o
l%
)
Be V Cr Mn
Al Ni W Si
Cu U Co Zr
Ti Mo
Be
V Cr
Mn Al Ni
W Si
Cu
Co
Zr
2500°C/s. The original figure (S. Tawara) [5] is very old, but is popular and still often cited in Japan [6–9], including very recently [10].
Although this plot gives cooling rates that are too high compared with those measured by other experiments, it is nevertheless recognized that the tendencies are correct [8]. Most alloying elements reduce the upper critical cooling rate at small additions; the effect then saturates and, in some cases, reverses at large additions. For Zr and Ti, the upper critical cooling rates decrease at very small additions and then increase rapidly, while Co exhibits a continuous increase in the upper critical cooling rate with increasing alloy content.
Figure 3 shows an expanded portion of Figure 2 for alloy contents below 1 mol%.
Figure 3. Expanded area of Figure 2 for alloy contents below 1 mol%.
In this concentration range, the upper critical cooling rates show good linearity for most elements. The critical cooling rates at 0.5 mol% and 1 mol% alloy content were therefore adopted as indexes of the effect of alloying elements on the hardenability of steel.
The values of the upper critical cooling rates of various alloying elements measured at 0.5 mol% alloy content are plotted on the TC–YM diagram shown in Figure 4.
Figure 4. Distributions of the upper critical cooling rates (°C/s) of alloyed steels measured at 0.5 mol% alloying content on the TC–YM diagram.
The numbers in the legend indicate the ranges of the upper critical cooling rates in units of °C/s: for example, the legend “500–1000” indicates that the upper critical cooling rates of the specified elements fall in the range from 500 to 1000°C/s. The upper critical cooling rate of steel itself is 2500°C/s. Elements with smaller upper critical cooling rate values improve hardenability; those with larger values degrade hardenability. The upper critical cooling rates are distributed regularly on the TC–YM diagram. The elements lying on and near the straight line of refractory metals (W, Mo, Cr, Mn, and V) show large hardenability; elements with high thermal conductivity, such as Si, Al, and Cu, show medium hardenability; elements with low Young’s modulus and low thermal conductivity (U, Ti, Zr, Nb, and Co) show negative hardenability. The upper critical cooling rates measured at 1 mol% alloy contents show similar trends.
4. Diffusion Coefficients of Alloying
Elements in Fe
The distribution of diffusion coefficients of alloying elements in Fe on the TC–YM diagram was independently studied. Diffusion coefficients in Fe are categorized for four phase regions: ferromagnetic α-Fe, paramagnetic α-Fe, γ-Fe, and δ-Fe. There are discontinuities at A3 and A4. However,
within each phase, the order of magnitude of the diffusion coefficient values for a specific element does not change across a wide temperature range. The diffusion coefficient
0 0.5 1
0 1000 2000 3000 4000 5000 6000
Critical cooling rate (℃/s)
A
llo
yi
n
g
c
o
n
te
n
t
(m
o
l%
)
Be V Cr Mn
Al Ni W Si
Cu U Co Zr
Ti Mo
Be
V Cr
Mn Al
Ni
W Si
Cu
Co
Zr
Ti
Mo
U
0 100 200 300 400 500 600
0 100 200 300 400 500
Thermal conductivity (W/mK)
Y
ou
n
g'
s
m
o
du
lu
s
(G
P
a)
0-500 500-1000 1000-1500 1500-2000 2000-2500 2500(Fe) >3000
Fe Mo W
Cr
Mn
V Ti
Zr Si
Al
Cu Be
U
Ni Co
Straight line of refractory metals
can therefore be represented by the value for a single temperature in each of the ferromagnetic α, paramagnetic α, and γ regions. Diffusion data were adopted from the Japan Institute of Metals [11].
Figure 5 shows the distribution of diffusion coefficients of alloy elements at 1073 K (800°C) in paramagnetic α-Fe on a TC–YM diagram.
Figure 5. Distribution of the diffusion coefficients (m2/s) of alloying elements in paramagnetic α-Fe at 1073 K (800°C) on the TC–YM diagram.
“E-16” in the legend indicates, for example, that the particular elements have diffusion coefficients of a magnitude of 10−16 m2/s. Fe has a small diffusion coefficient. The elements Ni and Co, located near Fe, and the elements Cr, Mo, and W, on the upper part of the straight line of refractory metals, have similar values to Fe. Elements around the lower part of the straight line of refractory metals, such as Mn, V, and Zn, and those of high thermal conductivity, such as Al, Au, Cu, and Ag, show slightly larger values. The elements on the lower side of the diagram (Ti, Sb, Sn, and Si) have larger values.
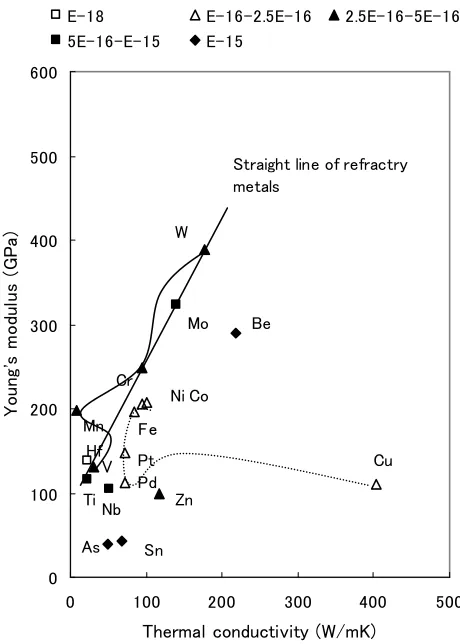
Figure 6 shows the distribution of diffusion coefficients of elements at 1273 K (1000°C) in γ-Fe on the TC–YM diagram.
Figure 6. Distribution of diffusion coefficients (m2/s) of alloying elements in γ-Fe at 1273 K (1000°C) on the TC–YM diagram.
The trend differs from that in α-Fe. Fe has the smallest diffusion coefficient, except for Hf; elements near Fe, such as Ni, Co, Pt, and Pd, and the elements with high thermal conductivity, such as Cu, show small and similar values to Fe; elements on and near the straight line of the refractory metals (W, Mo, Cr, Mn, V, Ti, Nb, and Zn) show large values. It is currently unknown why the diffusion coefficients of elements in Fe distribute regularly on TC–YM diagrams or why the patterns differ for α-Fe and γ-Fe.
5. Correlation Between Upper Critical
Cooling Rate and Diffusion Coefficient
Comparing Figures 4 and 5, it is difficult to find any similarities. In particular, W, Mo, and Cr show different trends. Comparing Figures 4 and 6, however, it is possible to recognize some similarities: W, Mo, Cr, Mn, and V show similar trends. The author was therefore inspired to speculate on a correlation between Figure 4 and Figure 6, i.e., between the upper critical cooling rate at 0.5 mol% alloy addition and the diffusion coefficient of the alloy element in γ-Fe at 1273 K (1000°C).
For reference, correlation between the upper critical cooling rates measured at 0.5 mol% alloy content and the diffusion coefficients in paramagnetic α-Fe at 1073 K (800°C) is shown in Figure 7.
0 100 200 300 400 500 600
0 100 200 300 400 500
Thermal conductivity (W/mK)
Y
ou
ng
's
m
od
ul
u
s
(G
P
a)
E-17 E-16-5E-16 5E-16-E-15 E-15 E-14
Nb W
Ni Co Mo
Cr
Mn
V
Zn
Al Au
Cu
Ag Ti
Sb Sn
Si
Be
Fe
Straight line of refractory metals
0 100 200 300 400 500 600
0 100 200 300 400 500
Thermal conductivity (W/mK)
Y
ou
ng
's
m
o
du
lu
s
(G
P
a)
E-18 E-16-2.5E-16 2.5E-16-5E-16 5E-16-E-15 E-15
W
Cr
Mn
Ni Co
Pt Pd Hf
V
Ti Nb
As Sn
Be Mo
Cu
Zn Fe
Figure 7. Correlation between the upper critical cooling rates measured at 0.5 mol% alloy content and the respective diffusion coefficients in paramagnetic α-Fe at 1073 K (800°C).
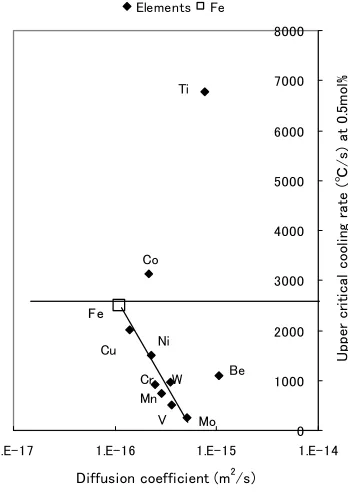
The elements are randomly distributed: the upper critical cooling rates have no correlation with diffusion coefficients in paramagnetic α-Fe. In contrast, a clear correlation is recognized between the upper critical cooling rates measured at 0.5 mol% alloy content and diffusion coefficients in γ-Fe at 1273 K (1000°C), shown in Figure 8.
Figure 8. Correlation between the upper critical cooling rates measured at 0.5 mol% alloy content and the respective diffusion coefficients in γ-Fe at 1273 K (1000°C).
The elements Fe, Cu, Ni, W, Cr, Mn, V, and Mo lie on a straight line. The upper critical cooling rate decreases linearly
with increasing diffusion coefficient of these elements, although Co and Ti show the opposite tendency. The same correlations were obtained throughout all temperatures of the γ-region, specifically 1184 K (911°C) (A3 point of pure Fe),
1373 K (1100°C), and 1473 K (1200°C).
Very similar results were also obtained at 1 mol% concentration of the alloy elements.
6. Correlation Between Multiplying
Factor and Diffusion Coefficient
As an alternative to using the upper critical cooling rate to evaluate the hardenability of steel, the multiplying factor can also be used. The ideal critical diameter DI, from which full
martensite is obtained at quenching, is expressed by the following equation for alloyed steel:
DI = DI• × FMn × FSi × FCr × FMo × (1)
where DI•is the ideal critical diameter of the unalloyed steel,
which is determined by the carbon content and austenite grain size. FX is the multiplying factor of the alloying
element X,represented by:
FX = 1 + αXCX (2)
where αX is a constant for element X and CX is the alloy
content of element X.
The multiplying factor can also be thought of as an index for the hardenability of steel. Multiplying factors for several elements are given by Hollomon and Jaffe [12] as linear functions of alloy content. The original data are old, but have been often cited. [13-15].
Figure 9. Multiplying factors for various elements (Hollomon & Jaffe [12]) as a function of their alloy content (mol%).
0 1000 2000 3000 4000 5000 6000 7000 8000
1E-16 1E-15 1E-14 1E-13
Diffusion coefficient (m2/s)
U
p
pe
r
cr
it
ic
a
l
c
oo
li
ng
r
at
e
(
℃
/s
)
at
0
.5
m
o
l%
Elements Fe
W Co
Mo Cr
Ni Al
V Cu
Mn Ti
Si
Be Fe
0 1000 2000 3000 4000 5000 6000 7000 8000
1.E-17 1.E-16 1.E-15 1.E-14
Diffusion coefficient (m2/s)
U
p
p
e
r
c
ri
ti
c
a
l
c
o
o
li
ng
r
a
te
(
℃
/
s)
a
t
0
.5
m
o
l%
Elements Fe
Cu Co
Ni
Cr Mn
W
V Mo
Ti
Be Fe
1 2 3 4 5 6 7
0 0.5 1 1.5
Alloying content (mol%)
M
ul
ti
p
ly
in
g
f
ac
to
r
(h
o
llo
m
on
&
J
af
fe
)
Mn P Cr Ni
Mo Cu
Mo
Mn
Cr
P
Figure 9 shows the values of these multiplying factors for various alloying elements as a function of alloy content, converted from mass% to mol%.
The values of the multiplying factor at 0.5 mol% alloy content were adopted here to represent the effect of that element on the hardenability of steel. Using the same methodology as for the upper critical cooling rate, correlation between the multiplying factor and the diffusion coefficient at 1273 K (1000°C) was tested. The results are shown in Figure 10.
Figure 10. Correlation between the multiplying factor at 0.5 mol% alloy content and the diffusion coefficient of the respective alloy element in γ-Fe at 1273 K (1000°C).
Although there are fewer data points, the elements Cu, Ni, Cr, Mn, and Mo show good correlation. Similar to the effect observed for the upper critical cooling rate, the hardenability of steel, as expressed by the multiplying factor, increases with increasing diffusion coefficient of the alloy element.
7. Discussion
Figure 7 shows no correlation between the upper critical cooling rates and the diffusion coefficients of alloy elements in α-Fe; Figure 8, however, does show such correlation in γ-Fe. Figure 10 also demonstrates a correlation between the multiplying factor and the diffusion coefficient of the respective alloy element in γ-Fe.
In general, martensite is formed from austenite. Rapid cooling is needed to avoid the “nose” of ferrite or pearlite formation on the continuous cooling transformation (CCT) diagram and to reach the martensite start (Ms) temperature. The concept of hardenability refers to the ease with which martensite forms [1, 16]. The lower the cooling rate permitted, the better the hardenability. The minimum cooling rate necessary to achieve a completely martensitic structure is
called the upper critical cooling rate. In general, hardenability is ruled by the type and content of alloying elements in the γ-phase, the amount and distribution of undissolved carbon compound particles, the austenitizing temperature, and the austenite grain size [17, 18].
7.1. Effects of Factors Other Than Alloying Elements
The austenitizing temperature changes the austenite grain size. With increasing grain size, the area of austenite grain boundary that provides a nucleation site for ferrite and pearlite decreases; the hardenability consequently increases [18–20]. Undissolved carbon compound particles lower the content of alloying elements in austenite and provide nucleation sites for transformation, consequently decreasing the hardenability [21].
7.2. Effects of Alloying Elements
Elements such as C, Cr, Mn, Ni, Mo, and B are added to improve hardenability. It is generally recognized that alloying elements improve hardenability in the series V, Mo, Mn, and Cr. In contrast, Ni and Si must be added in considerable amounts to improve hardenability, W has little effect, and Co shows the opposite tendency and degrades hardenability [8]. Figures 2, 3, and 9 confirm these effects. To date, however, the reasons for these effects have been largely unknown. It is believed that Mo and W slow the rate of diffusion of carbon in the γ lattice and that Cr and Ni retard the γ→α rearrangement [22]. These phenomena suggest that these alloying elements play a role in increasing the hardenability of steel, but the mechanism is not clear [23].
In this study, the values of the upper critical cooling rates at 0.5 mol% and 1 mol% alloy content are adopted and plotted on diagrams of Young’s modulus and thermal conductivity. It is assumed that other factors that affect hardenability (such as austenite grain size and the amount of undissolved carbon compound particles) remained essentially constant. The diffusion coefficients of alloying elements in Fe were also plotted on a TC–YM diagram. Diagrams of the upper critical cooling rates and the diffusion coefficients in γ-Fe at 1273 K (1000°C) showed a similar pattern, so a correlation between these properties was speculated. Good correlation was found between the upper critical cooling rate and the diffusion coefficient in the γ-phase, as shown in Figure 8. Good correlation was also found between the multiplying factor and the diffusion coefficient in the γ-phase. The orders of magnitude of the diffusion coefficient values of the alloying elements studied here do not change in the temperature range of the γ-region: values determined at 1273 K (1000°C) are therefore valid throughout the γ-phase.
The mechanism of the effect of alloying elements on the hardenability of steel can be considered as follows: if diffusion of alloying elements in the γ-phase is active, then, on cooling according to the CCT diagram, this increases the entropy and thermodynamically stabilizes the γ-phase, which retards transformation to the α-phase at higher temperatures and retains the γ-phase down to lower temperatures, thereby
1 2 3 4 5 6
1E-17 1E-16 1E-15 1E-14
Diffusion coefficient at 1273K
M
u
ti
pl
y
in
g
f
a
c
to
r
(H
ol
lo
m
on
&
J
a
ff
e
)
a
t
0
.5
m
o
l%
Elements Fe
Cu Ni
Cr Mn
Mo
P
enabling the γ-phase to reach the Ms temperature even at low cooling rates. Martensite is then usually understood to form by a diffusionless process [24, 25]. The orders of magnitude of the diffusion coefficients of the elements discussed are speculated to be valid in this metastable γ-phase. No correlation was found between the upper critical cooling rate and the diffusion coefficient in α-Fe because the α-phase is excluded from this process.
Naturally, some exceptions are observed. Ti shows a very large upper critical cooling rate. Ti is a strong carbide former. It has the smallest standard free energy for carbide formation among the alloying elements considered [26] and therefore reduces the solute contents of C and N in the γ-phase and degrades the hardenability [6]. Co also shows a large upper critical cooling rate, which has been reported previously [6, 8]. The reasons for this remain unknown. But it can be suspected that Co is more likely to form carbide than Ni [26]. Be has a small upper critical cooling rate, but deviates from the correlation line: too large a difference in diffusion coefficient from that of Fe does not further improve hardenability. Some scatter in the correlations is considered to be due to differences in the austenite grain size, the amount and form of carbide, and the carbon content in solution induced by the presence of different alloying elements.
8. Conclusions
Plots of thermal conductivity against Young’s modulus (TC–YM diagrams) were used as a tool to illustrate the effects of alloying elements on the hardenability of steel and the diffusion coefficient of alloying elements in the γ-phase of steel. The following conclusions are drawn:
(1) With increasing diffusion coefficient of alloying elements in the γ-phase for elements such as Cu, Ni, Cr, Mn, W, V, and Mo, the upper critical cooling rate of the alloyed steel decreases and the multiplying factor increases, i.e., hardenability of the alloyed steel increases.
(2) A large diffusion coefficient of the alloying element in the γ-phase increases the entropy of the phase, and, on cooling according to the CCT diagram, this thermodynamically stabilizes the γ-phase, thereby retarding transformation to the α-phase and retaining the γ-phase at a lower temperature, finally enabling the γ-phase to reach the Ms temperature, even at low cooling rates.
References
[1] D. R. Askeland: The Science and Engineering of Materials, PWS Publishing, Boston, 1994, p. 350.
[2] W. Hayden, W. G. Moffat and J. Wulff, The Structure and Properties of Materials, vol. 3, Iwanami, Tokyo, 1965, pp. 26-31.
[3] Japan Institute of Metals, Metals Data Book, 3rd ed., Maruzen,
Tokyo, 1993, pp. 36-43.
[4] Y. Mae, “What the Darken-Gurry plot means about the
solubility of elements in metals,” Metall. Mater. Trans. A, vol. 47, pp. 6498-6506, 2016.
[5] S. Tawara, “The effects of alloying elements on the hardenability of steels”, Tetsu-to-Hagane (Iron and Steel), vol. 23, p. 875-909, 1937.
[6] M. Tanino and S. Suzuki, Science of Steel, Uchida-Roukakluho, Tokyo, 2001, p. 105.
[7] The Iron and Steel Institute of Japan, Handbook of Iron and Steel, 3rd ed. vol. 1, Maruzen, Tokyo, 1981, p. 415.
[8] K. Monnma, Ferrous Materials, Jikkyo-publishing, Tokyo, 1981, p. 242.
[9] I. Tamura, Ferrous Materials, Asakura Book-Store, Tokyo, 1981, p. 66.
[10] N. Masahasi, News Letter 25, Kansai Center for Industrial Materials Research Institute for Materials Research , Tohoku Univ., Osaka, 2013, p. 3.
[11] Japan Institute of Metals, Metals Data Book, 4th ed.,Maruzen, Tokyo, 2004, pp. 20-25.
[12] J. H. Hollomon, and L. D. Jaffe, “The hardenability concept,” Trans. AIME, vol. 167, pp. 601-616, 1946.
[13] K. Monnma, Ferrous Materials, Jikkyo -publishing, Tokyo, 1981, p. 250.
[14] T. Kasuya, and N. Yurioka, “Carbon equivalent and multiplying factor for hardenability of steel,” Weld. J., vol. 72, pp. 263-268, 1993.
[15] Japan Institute of Metals: Metals Data Book, 3rd ed., Maruzen, Tokyo, 1993, p. 153.
[16] H. K. D. H. Bhadeshia and R. W. K. Honeycombe, Steels: Microstructure and Properties, 3rd ed., Elsevier, Oxford, 2006, p167.
[17] R. Tanaka, Dictionary of Metallic Materials, Asakura Book-store, Tokyo, 1990, pp. 440-442.
[18] H. K. D. H. Bhadeshia and R. W. K. Honeycombe, Steels: Microstructure and Properties, 3rd ed., Elsevier, Oxford, 2006,
pp. 176-179.
[19] The Iron and Steel Institute of Japan, Handbook of Iron and Steel,5th ed. vol. 3, Maruzen, Tokyo, 2014, pp. 159-162.
[20] G. E. Totten, Steel Heat Treatment, 2nd. ed. Taylor & Francis, N. Y., 2006, pp. 195-196.
[21] I. Tamura, Ferrous Materials, Asakura Book-store, Tokyo, 1981, p. 74.
[22] G. E. Totten, Steel heat treatment, 2nd. Ed. Taylor & Francis, N.
Y., 2006, p. 176-177.
[23] R. A. Grange, “Estimating the hardenability of carbon steel,” Metall. Trans. 4, pp. 2231-2244, 1973.
[24] G. E. Totten, Steel heat treatment, 2nd. Ed. Taylor & Francis, N. Y., 2006, p. 177.
[25] H. K. D. H. Bhadeshia, “Martensite and bainite in steels: transformation mechanism & mechanical properties”, Journal De Physique5, C5, p. 368, 1997.