ISSN: 2231-5381
http://www.ijettjournal.org
Page 74
Prototype o f Fault Identification in the
Electric Power Distribution Network with
Remote Signalling
Tiago de Oliveira Luciano ¹,Gilberto Sousa Lopes², Tiago Bittencourt Nazaré ³
¹Student ofIndustrialEngineering, Faculdades Integradas de Cataguases-FIC/UNIS ²Bachelor degreeofElectronicEngineering, UniversidadeGama Filho –UGF ³Master in Engineering systems management, Universidade Católica de Petrópolis-UCP
Cataguases/MG, Brazil
Abstract
This article describes the construction of a prototype using the Arduino platform, in conjunction with Fault Identifier Equipment (FI), in order to facilitate the identification of faulty stretches in the electric power distribution networks, thus optimizing the entire displacement process of the teams in the field in the execution of maneuvers to isolate the defects, which provide a reduction in the indicators of the company be they external or internal and a consumer satisfaction that in turn will have its energy reestablishes in a shorter time.
Keywords - Automation; Prototype; Power Outage Indicator, Satisfaction.
I. INTRODUCTION
Interruptions in the supply of electricity occur regularly at random points that can be caused by electrical failure or lack of preventive maintenance, these faults can be highlighted in stretches where there is contact of trees with cables, rupture of cables, malfunctioning equipment etc.
The problem does not only affect consumers but also electricity distribution companies that lose energy that has not been delivered to their customer for a certain period of time and can be penalized if the energy is not delivered to the customer during the time limit to meet the indicators established by the rules of the National Electric Energy Agency (ANEEL)[1]. On the other hand, with the consumer the injury and relative, due to the fact that the interruption of a residential user is different from the commercial, (example shopping) as well as industrial sites where there is the possibility of having a large amount of money to be lost, (example: production stop).
When it comes to identifying a fault, which can bring about a network deactivation in the distribution of electric power, responsible companies begin to do remote tactics that consists of isolating the fault, identified through alarms of remote components such as reclosers and remote keys , after performing the remote maneuvers, a team of electricians is driven to go to the place where there is no power and begin
field inspections, to identify the reason for the failure and to restore electricity.
According to [2],states that the location of a defective point is a constant problem for electricity distribution companies, since the electrician's team spends considerable time conducting network inspections and maneuvering until the fault is isolated. In contrast, when the location of the fault is known, the action of the teams is faster.
In the improvement to reduce the time spent in identifying the fault (IF) in the power distribution network, it culminated in the elaboration of a prototype that coupled to the identified fault device and able to remotely signal the identification of a fault at a certain point in the network.
For this reason, the objective of this project is to show the possibility of building a prototype that remotely signals and reports the presence of power distribution network failure, Fritzing Software was used to dismount connections, Software visio to exemplify the processing cycle of the prototype and a comparison of data to demonstrate the reduction caused by the use of the prototype.
The prototype will facilitate the identification process and thus will assist in the maneuvers by the field teams, as it will be connected to the FI and send a text message with information to the responsible sector. (COD –DistributionElectric Energy Operation Center).
This process will reduce the need to send a team to the location to verify the IF and accelerate the maneuvers that are made to isolate and identify the fault.
With the specific objective of an analysis to reduce and perfect the displacement of the field team, focusing on the reduction of indicators and on customer satisfaction.
II. LITERATURE REVIEW
A. Electrical Energy’s Regulator Agent
ISSN: 2231-5381
http://www.ijettjournal.org
Page 75
Energy Ministry, having as main attributions to regulate, to inspect and to determine tariff.
1) Indicators:According to [1],determines that the concessionaires provide a continuity standard, for this reason there are limits for the indicator of collective continuity, which are the Equivalent Interruption Duration per Consumer Unit (DEC) and the Equivalent Interruption Frequency per Consumer Unit (FEC), highlighting that the emergency occurrences’ service is evaluated through indicators linked to a set of consuming units, which are: the average time of preparation (TMP), the average time of dislocation (TMD) and the average time of execution (TME).
Basing on data obtained in the previously said indicators, not only the total average time of all the process of system re-establishment is determined but also one of the emergent occurrences’ services, Average Time of Assistance to Emergency Occurrences(TAME), as it is shown in Formula 1:
𝑇𝑀𝐴𝐸=𝑇𝑀𝑃+𝑇𝑀𝐷+𝑇𝑀E (1)
2) Network supply:According to [1],a distribution network of power energy can be defined as a segment of an electric sector dedicated to tension demotion that proceeds from transition system formed by both electric network and installations set, as well as by electric equipment which operate in high levels of voltage (higher than 69kV and lower than 230kV), medium level voltage (higher than 1kV and lower than 69 kV) and low level voltage (equal or lower than 1 kV).
According to [3],had said that every and any electric system has the possibility to be affected by a transitory or permanent fault, this can occur even though the worries and care are taken during the elaboration of the project and the installation’s execution, following the most severe norms and recommendation that exist.
According to [4],describes that failures can be caused by different reasons, for instance, characteristics like weather conditions, equipment errors and also vegetation.
According to [4],had said, the power quality is worsened by supply interruptions and the system’s reliability indexes, as a result, the costumer’s satisfaction decreases.
According to [1],has created the Costumer’s Satisfaction Index (IASC Consumer Satisfaction Index) which aims to estimate the level of satisfaction through costumer’s perception related to the distributing concessionaires of power energy. IASC discloses quality criteria with three dimensions: “Costumer’s Info”, “Company Access” and “Services Reliability”, (ANEEL, 2018).
B. Outage Indicator
According to [5], said, the fault’s indicator device has the ability to monitor the feeder voltage
and possesses minimum “intelligence” to identify electric currents that are caused by short circuit, momentary ignoring currents affected by the transformers’ magnetisation effect (in-rush), in addition to that, automatically adapting to the loading variation of the distribution line where it is monitored. So, the equipment will signalise in a bright way, identifying for the electrician if the fault is in discrimination or cascading, however, the team will have to visually check it before doing the tactics.
C. Prototype
According to [6], prototypes can be understood as functional samples developed through preliminaries specifications with the intention to simulate the appearance and functionality of a determined equipment to be developed, although it may be incomplete.
The best results in the interface of a product and obtained through the collection of usability data in the early stages of development. [7]
According to [7],a prototype is the quickest and most economical way to develop a project due to the fact that when there is the real integration of the user with the system it is possible to visualise all details and adjustments, which can project a perfect experience, becoming easier to manipulate the prototype to have an efficacy in simulating the project, therefore, unnecessary waste of time and money can be avoided.
According to [7], that the more advancedis the project, bigger are the impacts to realise changes or corrections, in addition to that, the wasted time to build the prototype is inversely proportional to the necessary time to apply it, summarising, as much dedication there is in the prototype’s early stage, lower values will be spent in its application, also stresses that altering a product in its preliminary phase is cheaper than making changes in the final product. It is said that can be a hundred times less expensive before starting to programme it than to wait the whole development has been done.
According to [7], in the construction of a prototype can be highlighted some advantages:
Time low demand to develop and low cost. Facilitates the product’s visualisation for the
costumer since the early stage.
Enables to receive costumer’s feedback quicker.
Facilitates a survey requisites and functionalities.
Allows estimating the most accurate way related to complexity and time development. Allows tests of interaction.
Reduces development effort.
III. MATERIALS AND METHODS
A. Materials
ISSN: 2231-5381
http://www.ijettjournal.org
Page 76
prototypes which use technology and Arduino Ethernet Shield GSM found at Academic Google and SCIELO (Scientific Electronic Library Online).
Firstly, was defined which component would be necessary for the prototype’s execution, after that the decision of microcontroller was made to choose a sensor that could work better, and which electronic components would achieve the best performance.
Table 1 is possible to see all the materials used to build the prototype.
TABLE I : Components and description COMPONENTS DESCRIPTION
microcontroller Arduino Uno R3 Atmega328 Shield -Gsm/Gprs SIM900
Communication Chip SIM –OperatorVIVO
Cables/ jumpers Jumper premium 20cm
Cabo micro USB 2.0-30cm
Sensor AR-350 SEL
LDR-Light Dependent Resistor
Table 1 presents a list of the components and their description for the construction of the
prototype,assembly of the components in item C.
B. Software
For creating and testing the prototype, it will be shown the tools used to achieve this purpose. To
programmer the controllers, it was used the LLC, according to [8], the programming language used in this software and in an Integrated Development Environment (IDE) turns the Arduino to be a tool to write programs, compile binary codes and load in the microcontroller memory. It can be found in many projects and academic tools that make use of Arduino due to the support module (sensor, display, drive...).
In this project, the model used was Uno R3 which is a microcontroller board based on the ATmega328 set with Shield-GSM/GPRS that will do the communication and dispatch the message.
To be used in breadboard construction and simulation, according to [10], describes Fritzing as an open-source software which assists in an easy and pleasant way the prototype’s assembly in a virtual breadboard. After that, there is the possibility to change the display modes to the schematic diagram as well as the printed circuit layout.
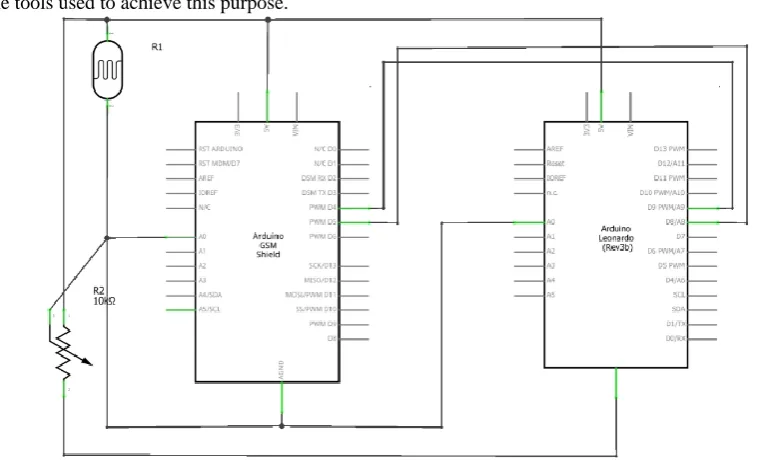
C. Assembly
The ProntoBard will be fed through a jumper connected to the Arduino's 5v output and connected to the ProntoBard positive track, then a jumper is connected to the Arduino's GDN output and the ProntoBard's negative track, the LDR will be connected to the GND output on the track and the positive VCC track, and connected to the LDR Output D0 on the Arduino AO pin.
Connecting the GSM module SIM900 GPRS ShieldArduino UNO SIM900 PIC, on the Arduino microcontroller, which replaces the Arduino pins, but pins 9, 8, A0, 5vcc, CDN will be used. Shield is expansive modules that add a new function to the microcontroller. In the project was used the Shield - Gsm/GPRS SIM900 that aims to expand the functionality of UNO for the use of GSM technology for sending and receiving SMS.
Elaborated source code that the microcontroller Arduino UNO, identifies the exact moment that luminous intensity exceeds the value 100.
#
include <SoftwareSerial.h> SoftwareSerial SIM900(7, 8); // Defining the variables used char incoming_char = 0; intsair = 0;// Defining communication pins with the sensor LDR intldrPin = 0; //LDR on analog pin 8
intldrValue = 0; //Read value of LDR
ISSN: 2231-5381
http://www.ijettjournal.org
Page 77
// Setandotodas as variáveis void setup()
{SIM900.begin(19200); delay(25000); Serial.begin(19200); Serial.println("OK");}
// Function to send an sms to the defined cell number void sends_sms()
{SIM900.print("AT+CMGF=1\r"); delay(100);
SIM900.println("AT+CMGS=\"+5532984870330\""); //Number to which will be sent a smsdelay(100); SIM900.println("Flag 1 Played.");
//Message that will be sent to the number delay(100); SIM900.println((char)26);
delay(100); SIM900.println(); delay(5000);
Serial.println("SMS sent successfully ");} void loop()
{//read the valuedo LDR
ldrValue = analogRead(ldrPin); //0 value read will be between 0 and 1023
//If the value read is greater than 100, we will send a message
if(ldrValue>=800)
envia_sms(); // Sends an sms to the cell number defined in the send_sms()
//prints the read value of the LDR no Serial.print Serial.println(ldrValue);
delay(100);
// Loop to verify that the operator's signal is sufficient to carry the commands to the chipfor (;;) {if (SIM900.available() > 0)
{incoming_char = SIM900.read(); Serial.print(incoming_char);} if (Serial.available() > 0)
{ if (Serial.read() == 'A') break;}} Serial.println("OK-2");
delay(100); SIM900.println(); delay(30000); while (1);}
Source code1: Represents a Beautiful Programming for Prototype Operation
IV. RESULTS AND DISCUSSION
The prototype developed from the previously presented methodology is presented here, which will be coupled and isolated in the Fault Identifier so that it can communicate and signal remotely to COD.
Fig.3: Prototype for coupling and adaptation to fault identification equipment.
The prototype is constituted with the base in the assembly of shield plate, that assumes the pins of the Arduino microcontroller, and connected through a protoborde to the sensor LDR, that is responsible for the readingof the luminous intensity.
A. Flowchart
A monitoring flowchart was made by the prototype, as it can be seen in figure 4.
Fig.4:Dismantles the Verification cycle executed by the system.
Using the visiosoftware, it was possible to elaborate a flowchart describing the cycle executed by the prototype, which will constantly be checking the sensor reading, when it detects an increase in light intensity will be perceived by the data processing of the Arduino microcontroller and that will send a message to those responsible.
B. The use of the prototype connected to the power outage
ISSN: 2231-5381
http://www.ijettjournal.org
Page 78
Fig.5: Simulating a possible network failure diagram.
Strategic spots for fault’s indicators can be understood as a network point that will help to identify all the path until the failure. In general, these spots are found in bifurcations in the network and in main derivations. (It helps to identify and isolate the fault, and also with the consumers’’ power supply re-establishment.
C. An occurrence simulation
It was taken into consideration a power outage occurred in “Zona da Mata”, in Brazil, caused by a fallen tree that had broken an electrical cable, which affected 6254 customers. For the tactics’ execution made by the maintenance teams, as well as the time wasted for this act (pruning the tree and joining the cable), was registered a total of the affected client (without energy due to each step of the tactic), expressed in figure 6.
Fig.6: Value indicators demonstrated in an OC without the prototype installation
The staff dislocation was possible to be simulated, where is known the path of it, having as parameter the maximum limit of speed that can be covered with a vehicle, not only in urban but also rural perimeter. This can be checked in figure7.
Fig.7: Value indicators demonstrated in an OC with the
prototype installation.
By looking at the covered distance, the fault’s identification time, tactics to energise the customers in the part which were not affected, the service execution time and the network regularization, it is possible to verify a reduction in DEC and TMAE indicators and there is no alteration in the FEC given the fact that it is not related to the time, but in fact with the frequency.
V. CONCLUSIONS
For seeking electrical energy supply concessionaires to have better quality of the service provided, there is always the necessity to reinvent and innovate to have a process increase, considering what has in the Procedures of Electrical Energy Distribution in the Nacional Electric System (PRODIST - Procedures for Distribution of Electric Energy in the National Electric System) which standardizes the technical activities related to the functionality and development of power energy supply systems (ANEEL, 2018).
In this article it was developed a prototype that aimed to help identification of power outages in the electrical energy distribution, in a way that could reduce the part “medium voltage network” to be inspected by the maintenance staff, providing a quicker identification of the fault as well as for the re-establishment of the energy in non-affected network.
After the information being processed by the prototype through the message, the process of inspection and dislocation of the team to the tactics’ spots has as objective to isolate the shortest stretch, then to identify the failure and have a solution for it to be quicker. The information’s flow agility directly impacts the DEC indicator, as the same for TMD which decreases, like it was possible to see a reduction of 32,87% in the OC’s DEC and 18,18% in the TMAE in section 4.3 simulation.
At first, the prototype will send a text message through a mobile phone network, however, it is already in development a future project for communication over software which will immediately signalize in the alarm’s display managed by COD, being possible to have an easier and quicker visualization and can be accessed in many machines at the same time.
REFERENCES
[1] (2018) The ANEEL website. [Online]. Available: http://
http://www.aneel.gov.br
[2] Baldwin, T.; Renovich, F. andSaunders, L. F. (2003).
“DirectionalGround-FaultIndicator for”.
[3] J. M.Filho, Manual de equipamentos Elétricos, 3º edição,
pag 265, 2011.
[4] R. Dashti,J. SADEH, Faultindicatorallocation in
powerdistributionnetwork for
improvingreliabilityandfaultsectionestimation. In:
AdvancedPowerSystem Automation andProtection (APAP), 2011 InternationalConferenceon. IEEE,2011. p. 1406-1411.
[5] F. J. Andrade, J. C. Santos, D. R. Mônaco, A. A. Ferreira, J.
Camargo (2014). Monografia - Redução no Tempo Médio de Atendimento a Ocorrências Emergenciais Aplicando o Sinalizador de Faltas.
[6] (2006) The PUC-Rio website. [Online]. Available:
https://www.maxwell.vrac.puc-rio.br/9731/9731_11.PDF
[7] (2013) The thiagonasc website. [Online]. Available:
http://thiagonasc.com/desenvolvimento-web/a-importancia-dos-prototipos-no-desenvolvimento-de-sistemas.
[8] F.Djuandi (2011). PengenalanArduino-menegenalarduino.
[9] L. H. D. Toledo, R. P. Machado, L. Ramos. Conhecendo o