http://www.sciencepublishinggroup.com/j/ijema doi: 10.11648/j.ijema.20170501.12
ISSN: 2328-7659 (Print); ISSN: 2328-7667 (Online)
Presence of Agricultural Herbicide Atrazine in Water,
Foods, and Human Urine Samples
Anthony Concilla, He Liu
*Department of Biology, Morosky College of Health Professions and Sciences, Gannon University, Erie, USA
Email address:
concilla003@knights.gannon.edu (A. Concilla), liu017@gannon.edu (He Liu)
*Corresponding author
To cite this article:
Anthony Concilla, He Liu. Presence of Agricultural Herbicide Atrazine in Water, Foods, and Human Urine Samples. International Journal of Environmental Monitoring and Analysis. Vol. 5, No. 1, 2017, pp. 9-13. doi: 10.11648/j.ijema.20170501.12
Received: February 6, 2017; Accepted: February 17, 2017; Published: March 4, 2017
Abstract:
Atrazine is a commonly used water-soluble agricultural herbicide in the United States. In this study, we measured the atrazine levels in water, beverages, foods, and urine samples obtained from young students at an urban university. The effects of physiological and behavioral factors were examined. Our results show that water samples obtained from Lake Erie and tap water both contained very low level of atrazine. Beverages and foods had various levels of atrazine contamination. Atrazine was also detected in the urine samples and mid-term physical activity appeared to be a factor to reduce the atrazine level in these subjects.Keywords: Atrazine, Water, Food, Urine, Great Lakes, Erie
1. Introduction
Atrazine (2-chloro-4-ethylamino-6-isopropylamino-s-triazine, molecular formula C8H14ClN5, molecular weight
215.6 Da) is a colorless or white odorless crystalline solid with the melting point 171-175°C. It is a water-soluble herbicide used on crops all over America, especially in the Midwestern states. Atrazine not only commonly stays on the foods consumed by humans, it also runs off into lakes and other water bodies resulting in contamination of some of the population’s water supply.[1] Ever since the U.S. approved its use in 1959, about 64 to 80 million pounds of atrazine are used in the United States each year (Portage County Government, 2008). The Maximum Contaminant Level (MCL) for atrazine in drinking water is 3 ppb. [2] Although atrazine is quickly metabolized in the human body with a biological elimination half-life of 11 hours, [3] multiple studies have shown that atrazine disrupts metabolism, reproduction, immune function, and cell division by affecting the expression of multiple genes. [1] Even atrazine levels lower than the MCL were shown to disrupt female menstrual cycle regularity. [4]
In a recent study, atrazine was shown to consistently exceed the water quality benchmark, likely because of runoff
from usage at nearby locations.[5] The presence of atrazine has been detected in cattle, rat, dog, mouse, [6-10] and specific human populations such as agricultural workers, [4, 11-14] as well as in homes not located on farms. [15] In this study, atrazine levels in water, foods, and urine samples obtained from young students at an urban university were measured. The correlation between lifestyle (such as diet, BMI, sleep, and exercise) and the urinary concentrations of atrazine in these individuals was examined. The results showed the presence of atrazine with various concentrations in water samples collected from different sources, as well as various beverages and food samples. Atrazine was detected at low concentrations in the urine samples. Data analysis suggests that atrazine levels are lower in subjects with longer physical exercise time in medium-term (a week).
2. Materials and Methods
2.1. Sample Collection
collected from local grocery stores at Erie, PA. Solid samples were soaked overnight or homogenized. Supernatants were
taken after liquid samples were centrifuged at 13,000 x for 3 minutes. Details of sample preparation are listed in Table 1.
Table 1. Sample Preparation Methods.
Sample Type Sample Preparation Method
Water Samples
Tap water Collected from Gannon University campus
Lake water, Bay water Collected from Lake Erie and the Presque Isle Bay
Lab water Distilled water further purified by Thermo Scientific ion exchange column
Liquid Samples
Soda, Beer Shaken for 10 minutes, centrifuged, supernatant collected
Sports drink, Fruit juice, Popsicle Centrifuged and supernatant was collected Non-organic milk, Organic milk, Soy milk Centrifuged twice and supernatant was collected
Solid Samples
Corn, Cucumber, Fish, Beef Sliced if necessary, homogenized, centrifuged, and supernatant was collected
Tea leaf, Tea bag Soaked in 10x weight lab water for 3 days and liquid was centrifuged
Cane sugar, Sorghum, Corn starch Dissolved/soaked in water until desired concentration present
Tofu, Chicken Juice from the package was collected
Honey Diluted to 1:40 concentration
Urine samples were collected from subjects recruited from an undergraduate course at Gannon University. The average age of the subjects was 20.3 years with an age range of 19 to 24. Out of 36 subjects, 20 were males and 16 were females. The subjects came from mixed races but were primarily Caucasians. Samples were collected at ~2PM. No restriction of food or drink intake was applied prior to sample collection. Subjects were asked to fill out a questionnaire at the time of sample collection. The use of student urine samples for measurement and the publication of group data were approved by the Institutional Review Board at Gannon University.
2.2. Atrazine Measurements
Atrazine concentrations were measured with the ELISA method (Enzyme Linked Immunosorbent Assay) using Atrazine ELISA Microtiter Plate kit (Warminster, PA). The absorbance at 450nm was measured using a microplate reader (Promega, Madison, WI). Absorbance values of a series of standard samples provided by the kit (0.05 to 5.0ppb) were used to construct the standard curve with a linear regression between log (absorbance) and log (concentration).
2.3. Data Analysis
Statistical analyses (two-tailed Student’s t-test) were performed using IBM SPSS Statistics version 22.0 (IBM Corp.). The group average values are reported in the form of Mean ± SEM.
3. Result
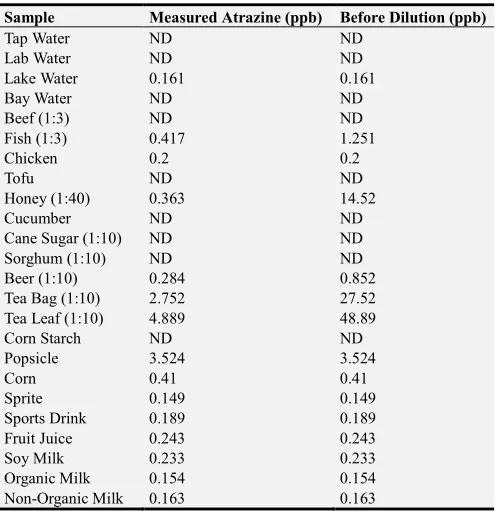
Atrazine concentrations were measured in various samples of water, beverages, and food. The concentrations are listed in Table 2. Any value in Table 2 that is below 0.12 ppb, the lowest concentration in the standard samples to construct the standard curve, was below the limit of detection (LOD) of the assay, thus is marked as “not detected” (ND). Relatively higher atrazine concentrations were observed in the group of food and beverage samples. Those samples with atrazine concentrations higher than the Maximum Contaminant Level
(MCL) for atrazine in drinking water (3 ppb) were honey, tea bag, tea leaf, and popsicle.
Table 2. Atrazine Concentrations in Water Beverage and Food Samples.
Sample Measured Atrazine (ppb) Before Dilution (ppb)
Tap Water ND ND
Lab Water ND ND
Lake Water 0.161 0.161
Bay Water ND ND
Beef (1:3) ND ND
Fish (1:3) 0.417 1.251
Chicken 0.2 0.2
Tofu ND ND
Honey (1:40) 0.363 14.52
Cucumber ND ND
Cane Sugar (1:10) ND ND
Sorghum (1:10) ND ND
Beer (1:10) 0.284 0.852
Tea Bag (1:10) 2.752 27.52
Tea Leaf (1:10) 4.889 48.89
Corn Starch ND ND
Popsicle 3.524 3.524
Corn 0.41 0.41
Sprite 0.149 0.149
Sports Drink 0.189 0.189
Fruit Juice 0.243 0.243
Soy Milk 0.233 0.233
Organic Milk 0.154 0.154
Non-Organic Milk 0.163 0.163
*Values below the LOD are marked as ND (not detected).
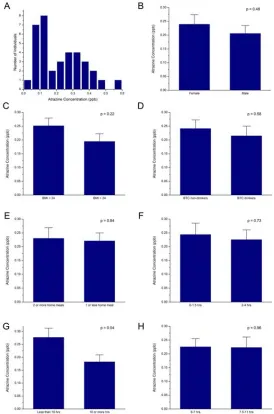
one serving of beer, tea, or coffee (“BTC drinkers” in Fig. 1D) showed slightly less urinary atrazine concentrations (0.215 ± 0.035 ppb, n = 17) than the subjects who reported not to have drank beer, tea, or coffee (“BTC non-drinkers” in Fig. 1D, urinary atrazine concentrations 0.241 ± 0.031 ppb, n = 19), but the difference was not statistically different (p = 0.58). When taking the location of subjects’ meals in the past 24 hours into consideration (Fig. 1E), those who had 2 or more home meals had about the same urinary atrazine concentration (0.230 ± 0.039 ppb, n = 14) compared to those who had 1 or zero home meals (0.220 ± 0.029 ppb, n = 22, p = 0.84, Fig. 1E). As physical exercise elevates metabolic levels, we compared subjects according to their reported physical exercise hours in the day and in the week prior to sample collection. Short-term exercise seemed to have minimal effect on the urinary atrazine levels, those who had 2
to 4 hours of physical exercise in the past day (0.225 ± 0.035 ppb, n = 16) showed no difference from those who had 0 to 1.5 hours of physical exercise in the past day (0.243 ± 0.041 ppb, n = 14, p = 0.63, Fig. 1F). Only three subjects reported zero hour of physical exercise in the past day and their average urinary atrazine level was 0.312 ± 0.154 ppb. The medium-term physical exercise showed greater effect (Fig. 1G). Those who had exercised 10 or more hours in the past week had significantly lower urinary atrazine levels (0.182 ± 0.027 ppb, n = 20) from those who had exercised less than 10 hours in the past week (0.276 ± 0.036 ppb, n = 16, p = 0.04). Sleep duration appeared to have no effect on the urinary atrazine levels (Fig. 1H). Those who had 6 to 7 hours of sleep in the previous night had almost the same level as those who had 7.5 to 11 hours of sleep (0.225 ± 0.029 ppb vs. 0.223 ± 0.038 ppb, p = 0.96).
4. Discussion
Our results revealed that atrazine concentrations in the water samples collected were very low compared to the atrazine Maximum Contaminant Level drinking water (3 ppb). Tap water has concentration below the LOD (0.12ppb). The water sample collected from Lake Erie (0.161 ppb) was only slightly above the LOD. Interestingly, the water sample collected from the bay at Erie, PA had a concentration below the LOD of the assay. This could be due to the different proximities to water sources from agricultural lands or simply an experimental error, as the values approach to the LOD of the assay. A recent study took water samples from 57 different tributaries by the Great Lakes over the course of three years and showed the mean concentration of atrazine at 0.086 ppb at urban watersheds and 0.143 at nonurban watersheds. [5] Our lake water values are consistent with their findings. Additionally, it was noted that atrazine levels in the tributaries are higher during certain times of the year, particularly early summer, because of different growing schedules certain crops have. [5] Our samples were collected in late summer.
The samples that consisted of foods or beverages tended to have higher atrazine concentrations. Among them, the two samples with the highest atrazine concentrations were the tea bag and tea leaf, possibly from the high levels of atrazine used in the fields where they were grown, as the top tea-producing countries are in Asia, Africa and South America according to the statistics of UN Food and Agriculture Organization.[16] Also, the source of the honey sample we used is located in a country in South America. Additionally, we observed higher levels of another agricultural herbicide in beer,[17] but the level of atrazine in beer was not very high compared to other foods, probably because the barley used in beer production is from different regions, such as the U.S.
Atrazine levels in urine samples collected from 36 undergraduate students were examined in this study. The average concentration was 0.224 ± 0.023 ppb, about two fold of the analysis LOD and 1/10 of the atrazine Maximum Contaminant Level drinking water (3 ppb). This result is consistent with the reported urinary levels (less than 0.3 ppb) from the National Health and Nutrition Examination Survey in U.S. population. [3] We also looked at how various factors including gender, body mass index (BMI), drinking of certain beverages, location of meal preparation, physical exercise, and sleep duration affected concentrations. Most of the comparisons didn’t generate differences that are statistically significant, probably due to two reasons. First, our sample size is relatively small (n = 36 in total and divided in two groups for comparisons). A much larger sample size is probably needed to confirm our findings and the comparison statistics may be substantiated. Second, for practical reasons, the subjects did not have a strictly controlled diet, fixed amount of water intake, or monitored behavioral conditions before sample collections. Therefore, there may be other factors that weren’t included in our survey but still contribute
to urinary atrazine levels.
We did observe different urinary atrazine levels in subjects with different reported physical exercise time in the past week. Other reports showed that physical activity promoted metabolism. [18-20] However, in some reports acute exercise resulted in decreased glomerular filtration rate and renal clearance. [21, 22] This may at least partly contribute to the fact that we didn’t observe a difference with short-term physical activity.
Acknowledgements
This research is supported by a faculty research grant provided by Gannon University. We thank Ms. Rachel Stauffer and Mr. Joshuva John for their help with sample collection and processing.
References
[1] Concilla, A., Liu, H., "Changes in Gene Expression Linked to Adverse Health Effects of Herbicide Atrazine," International Journal of Pharmacology, Phytochemistry and Ethnomedicine, 2017. 6: p. 17-20.
[2] National Primary Drinking Water Regulations. 1995; Available from: https://nepis.epa.gov/.
[3] CDC Tox Guide for Atrazine Available from: https://www.atsdr.cdc.gov/toxguides/toxguide-153.pdf.
[4] Cragin, L. A., J. S. Kesner, A. M. Bachand, D. B. Barr, J. W. Meadows, E. F. Krieg, and J. S. Reif, "Menstrual cycle characteristics and reproductive hormone levels in women exposed to atrazine in drinking water," Environ Res, 2011. 111 (8): p. 1293-301.
[5] Baldwin, A. K., S. R. Corsi, L. A. De Cicco, P. L. Lenaker, M. A. Lutz, D. J. Sullivan, and K. D. Richards, "Organic contaminants in Great Lakes tributaries: Prevalence and potential aquatic toxicity," Sci Total Environ, 2016. 554-555: p. 42-52.
[6] Komsky-Elbaz, A. and Z. Roth, "Effect of the herbicide atrazine and its metabolite DACT on bovine sperm quality," Reprod Toxicol, 2016. 67: p. 15-25.
[7] Peighambarzadeh, S., S. Safi, S. Shahtaheri, M. Javanbakht, and A. Rahimi Forushani, "Presence of atrazine in the biological samples of cattle and its consequence adversity in human health," Iran J Public Health, 2011. 40 (4): p. 112-21.
[8] Campbell, J. L., Jr., M. E. Andersen, P. M. Hinderliter, K. D. Yi, T. P. Pastoor, C. B. Breckenridge, and H. J. Clewell, 3rd, "PBPK Model for Atrazine and Its Chlorotriazine Metabolites in Rat and Human," Toxicol Sci, 2016. 150 (2): p. 441-53.
[9] Forster, G. M., D. G. Brown, G. P. Dooley, R. L. Page, and E. P. Ryan, "Multiresidue analysis of pesticides in urine of healthy adult companion dogs," Environ Sci Technol, 2014. 48 (24): p. 14677-85.
[11] Perry, M. J., D. C. Christiani, J. Mathew, D. Degenhardt, J. Tortorelli, J. Strauss, and W. C. Sonzogni, "Urinalysis of atrazine exposure in farm pesticide applicators," Toxicol Ind Health, 2000. 16 (7-8): p. 285-90.
[12] Curwin, B. D., M. J. Hein, W. T. Sanderson, D. B. Barr, D. Heederik, S. J. Reynolds, E. M. Ward, and M. C. Alavanja, "Urinary and hand wipe pesticide levels among farmers and nonfarmers in Iowa," J Expo Anal Environ Epidemiol, 2005. 15 (6): p. 500-8.
[13] Bakke, B., A. J. De Roos, D. B. Barr, P. A. Stewart, A. Blair, L. B. Freeman, C. F. Lynch, R. H. Allen, M. C. Alavanja, and R. Vermeulen, "Exposure to atrazine and selected non-persistent pesticides among corn farmers during a growing season," J Expo Sci Environ Epidemiol, 2009. 19 (6): p. 544-54.
[14] Mendas, G., M. Vuletic, N. Galic, and V. Drevenkar, "Urinary metabolites as biomarkers of human exposure to atrazine: atrazine mercapturate in agricultural workers," Toxicol Lett, 2012. 210 (2): p. 174-81.
[15] Curwin, B. D., M. J. Hein, W. T. Sanderson, M. G. Nishioka, S. J. Reynolds, E. M. Ward, and M. C. Alavanja, "Pesticide contamination inside farm and nonfarm homes," J Occup Environ Hyg, 2005. 2 (7): p. 357-67.
[16] Food And Agriculture Organization of the United Nations. Available from: http://www.fao.org/faostat/en/#home.
[17] Joshuva John, H. L., "unpublished research."
[18] Dahjio, Y., J. J. Noubiap, M. Azabji-Kenfack, M. Essouma, G. E. Loni, A. E. Onana, M. Dehayem, A. Mvom, M. N. Tadjore, and E. Sobngwi, "Impact of a 12-week aerobic exercise training program on anthropometric and metabolic parameters of a group of type 2 diabetes Cameroonian women aged >/=50 years," Ann Transl Med, 2016. 4 (19): p. 364.
[19] Adams, J. D., S. A. Kavouras, J. I. Robillard, C. N. Bardis, E. C. Johnson, M. S. Ganio, B. P. McDermott, and M. A. White, "Fluid Balance of Adolescent Swimmers During Training," J Strength Cond Res, 2016. 30 (3): p. 621-5.
[20] Ramel, A., A. Arnarson, O. G. Geirsdottir, P. V. Jonsson, and I. Thorsdottir, "Glomerular filtration rate after a 12-wk resistance exercise program with post-exercise protein ingestion in community dwelling elderly," Nutrition, 2013. 29 (5): p. 719-23.
[21] F, V. Z., A. Innerd, L. B. Azevedo, G. M. Whitford, and A. Maguire, "Effect of exercise on fluoride metabolism in adult humans: a pilot study," Sci Rep, 2015. 5: p. 16905.