Effect Of Concept Mapping On Learner
Achievement On Mole Concept
Kasompo Damaso, Asiana Banda
Kalonga Secondary School, Natural Sciences department, P. O. Box 80925 Kabwe, Zambia.
The Copperbelt University, School of Mathematics and natural Sciences, P. O. Box 21692. Kitwe, Zambia.
Abstract: The purpose of this study was to determine the effect of concept mapping on learner achievement on mole concept. Participants comprised 80 grade 11 learners, 38 male and 42 female, at a government co-education secondary school in Kabwe district of Zambia. The study adopted a pretest-posttest counter balanced quasi-experiment research design. Two classes were randomly selected to participate in the study. The classes were then randomly assigned to the experimental and control groups. The learners in the experimental group were instructed with the integration of concept mapping while those in the control group were instructed without integrating concept mapping. Both groups were taught the same content on mole concept. Data were analysed using independent sample t-test and descriptive statistics computed from the collected data using SPSS. Results show that there was a significant difference in the mean scores of the experimental (M= 53.37) and control (M=36.51) groups, t (63.208) = -4.109, p = .000, α = .05 two tailed for the first posttest and t (78) = 2.163, p = .034, α = .05 two tailed for the second posttest. The results indicate that those instructed with concept mapping did better than those instructed without concept mapping. The result also reveal that both males and females benefited from concept mapping and its impact is not gender dependent.
Keywords: Achievement, Concept Mapping, Mole Concept.
1.0 Introduction.
The importance of science, technology, mathematics and engineering in the development of any nation is undisputed. The Zambian Ministry of Education [1] explains the importance of mathematics and science in the agenda to develop Zambia the country. It posited that it will give priority to the improvement of mathematics and science education in high schools of all types by devoting more time and resources to the teaching of mathematics and science. The development of a country depends on its educated citizenry. Science, Technological, Engineering and Mathematics (STEM) subjects are core in fostering national development. The role of science in the development of a nation cannot be over emphasized [2]. Malik [3] posits that throughout history, the development of new technologies is vital for human survival and progress. The third world countries need this most hence the efforts by many of them to embrace science and technology. Indeed, the so-called tiger nations in the Far East were able to rise to where they are now because of the heavy investment in science and technology. There has been increased efforts by the government of the republic of Zambia in investing in education in terms of infrastructure and human resource development. But over the years the results produced in science and chemistry in particular have not been impressive and of expected standards to foster national development. In terms of learner performance by subject it was observed that performance was best in practical subjects and lowest in mathematics, science and commerce [4]. Chemistry is one of the subjects in science and in Zambia it is taught at senior secondary level as a single subject (5070) or as part of science (5124) that comprises chemistry and physics concepts. The performance of learners at grade 12 level in school certificate examinations in some topics of chemistry has been perpetually low. One of such topics is
explored the use of concept mapping to enhance conceptual understanding of mole concept and how they will impact on learner achievement and attitude on mole concept.
1.1 Concept mapping
Concept mapping is the visual representation of the relationships between concepts held by an individual, materials of a lecture, text book or laboratory exercise [10]. Concept mapping is a meta-learning strategy based on the Ausubel-Novak-Gowin theory of meaningful learning [11]. It has its origins in research done at Cornell University to study changes in students’ understanding of science concepts over a 12-year span of schooling [12]. Thus concept mapping is not only a visual representation of the relationships between concepts but is a meta-cognition learning process. It engages the mental processes of the learner at a high level and makes them think about their thinking. In addition it helps to understand the concepts held by an individual on a topic and how that individual relates those concepts. In the field of science education, concept mapping has been introduced to face the problem of linking the often multidimensional nature of the subject [13]. The principle concepts in chemistry especially on mole concept range from concret to abstract. Relating these concepts become a challenge to most of the learners, hence concept mapping comes in to brigdge the gap. On mole concept learners are faced with three three levels of representation: the macroscopic level, microcsopic level and the dymbolic level [14]. The concepts on mole concept can be represented at each level, and it is the transition from one level to other that posses a challenge. For instance sodium chloride can be reprented in terms of mass which is a macroscopic level, or interms of mole which is a microscopic level or interms of chemical formular which is symbolic. Concept mapping is seen as a means to facilitate the linking of concepts on macroscopic level to those on the microscopic level or help learners link underlying concepts on the microscopic level only [13].
1.2 The mole concept.
The mole concept was introduced by Ostwald at the beginning of the 20th century with a meaning of weight (mass), in a context of skepticism towards Dalton’s atomic hypothesis [9]. Since then the mole concept has evolved in meaning and context over time [15]. The concept of mole is leant in grade 11 in the Zambian school system [16]. It comprises of three sub topics: relative masses, the mole and empirical and molecular formulae. Relative masses has two specific objective, the mole has eight specific objectives and the last sub topic has three specific objectives. Thus the mole concept learnt by the Zambian grade 11 learners has 13 specific objectives in total. The teaching and learning of mole concept has been a problem for a long period of time. Teaching and learning the ‘amount of substance’ concept is a big challenge for learners and teachers [17].
2.0 Problem statement
Many studies show that students have trouble understanding the concept of the mole, concentration,
students who do not fully understand the mole experience difficulties in understanding the subsequent topics in chemistry Bamidele, Adetungi, Awodele and Irinoye [19] pointed out a number of reasons for students’ poor performance in the West African Senior School Certificate examination. Among them is the deficient use of the mole concept and its applications. Similarly, the low achievement by learners in chemistry and mole concept in particular has been reflected in the Examination Council of Zambia, annual performance report for ( [21], [6], [22], [23] and [24]). The EZC reports show that Performance has been low in the following topics: rates of chemical reactions and equilibrium, mole concept, non-metals and organic chemistry [5]. The 2013 examination performance report for natural science [6] cites lack of in-depth knowledge of the mole concept as one of the challenges learners face in chemistry. Examinations council of zambia [25] posits that questions involving mole concept where pooly answered by candidates. They attributed this to poor teaching. In the same report a question in 5070/3 involving mole concept was not only poorly done by candidates but by supervisors aswell. This poor performance by candidates on mole concepts could be contributing to the low and general poor performance of candidates at grade12 in their school certificate leaving examinations. A comparison of performance over the years show almost the same performance in chemistry and science. Table 1 shows comparison of performance from 2012 to 2015 at national level in chemistry and science.
Table 1: Comparison of performance in chemistry and
science in % from 2012 to 2017 at national level.
2012 2013 2014 2015 2016 2017 Chemistry 48.17 47.9 49.12 49.82 48.21 50.06 Science 29.37 33.9 17.76 17.65 32.83 35.28
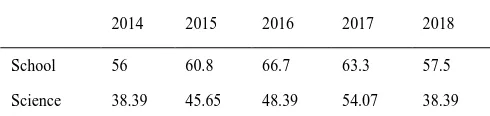
The trend shows that there has been poor performance of the learners in chemistry and science at national level as shown in Table 1. The mean performance of learners at the secondary school, in terms of the school mean and mean science performance where the research was done from 2014 to 2018 is tabulated in Table 2.
Table 2: Results for the secondary school and science in % from 2014 to 2018.
2014 2015 2016 2017 2018
School 56 60.8 66.7 63.3 57.5
Science 38.39 45.65 48.39 54.07 38.39
Though the school average pass percentages may be slightly higher than the national average the poor performance of learners in science is still evident. Improvement of achievement in this topic may improve the learner achievement in chemistry in their final examination.
2.1 Research objectives.
2. To determine if the achievement of learners differs significantly with gender of the learners?
2.2 Research questions.
The following were the research questions:
1. What is the effect of concept mapping on learner achievement on mole concept?
2. Does the achievement of learners differ significantly with gender of the learners?
2.3 Research hypotheses
The research had the following hypotheses:
H1: There is a statistically significant effect of concept mapping on learner achievement on mole concept. H0: There is no statistically significant effect of concept mapping on learner achievement on mole concept. H2: The achievement of learners statistically differ significantly by gender.
H0: The achievement of leaners does not statistically differ significantly by gender.
In all the hypotheses the significance level (α) is set at .05 two tailed and confidence level at 95%.
2.4 Significance of the research
This study is significant in that its findings will add to the existing knowledge on concept mapping and its effect on achievement on mole concept. The findings may also be useful to teachers, learners, curriculum developers, other stake holders in education and educational researchers.
3.0 Methodology
3.1 Research design
The study adopted a pretest-posttest counter balanced quasi-experiment research design. Two classes were randomly assigned to the experimental and control groups.
R O1 X O3 O5 R O2 O4 X O6
3.2 Sampling
Random sampling with replacement was used to select the sample. Five pieces of paper, of the same size and color were cut. A letter representing a class was written on each piece of paper, that is, letters from A to E. These were folded in the same way and placed in a box with a hole that could only allow a hand to go through. The box was shaken and a blindfolded person while facing aside will picked a piece of paper at a time. The first paper to be picked represented the class to be in the sample. It was placed back in the box, the box was shaken and a second paper was picked, it represented the other class to be part of the sample. Of the two classes picked, their papers were placed in the same box after emptying the other papers. The same process was followed and the first paper to be picked, was assigned to the experimental group and the other automatically became the control group. This process ensured researcher bias in terms selecting classes and consequently learners to participate in the research was eliminated. The experimental group had 41 participants while the control group had 39 participants.
3.3 Research instruments
Three researcher designed pen and paper mole concept achievement tests (MCAT) were constructed. One was administered as a pre-test and the other two as post-tests.
3.4 Data collection procedure
The following procedure in terms of the activities in the experimental group and the control group were followed leading to the collection of data. The groups were taught for 9 weeks and were meeting twice a week for 80 minutes per session. A pre-test was administered after a week of introducing the learners to mole concept. Thereafter the intervention was introduced to the experimental group. After the pre-test, the groups where assigned to the experimental and the control group randomly as outlined under sampling. After the post –test the groups were swapped to counterbalance. The control group became the experimental and the experimental group became the control group. The intervention was then administered to the experimental group based on the new content that they were learning. The second posttest was then administered.
3.4.1 Experimental group
The learners in the experimental group learnt mole concept with the integration of concept mapping. Concept mapping (appendix A) was integrated into group discussion, class discussion practical work and teacher exposition. It was also be used to introduce the topic and highlight the expected outcomes and conceptual framework of the topic. After learning learners were also asked to draw their own concept maps (Appendix B). The learners were at liberty to expand the initial concept maps they had drawn as they expanded their knowledge. They were asked to draw specific concept maps based on the lessons covered. The concept maps were also used to consolidate the learnt concepts.
3.4.2 Control group
Learners in the control group learnt the same content on mole concept as the learners in the experimental group without the integration of concept maps. They used class and group discussion, practical activities and group work. They were also given regular homework in terms of summaries and calculations except concept mapping.
4.0 Results and discussion.
This section presents the results of the study. The results are presented in the order in which the research questions were asked.
4.1 Effect of concept maps on learner achievement on mole concept.
The research question was:
Table 3: pretest Group Statistics
Group N Mean Std. Deviation Std. Error Mean Pretest CG 39 28.31 10.979 1.758 EG 41 29.29 15.715 2.454
The control group (CG) had 39 participants, with a mean of 28.31 and standard deviation of 10.979 while the experimental group (EG) had 41 participants and a mean of 29.29 and standard deviation of 15.715. The t-test results from pretest of the control and the experimental groups are presented in Table 4.
Table 4: Pretest Independent Samples Test
Mean
diff T df SE diff
p-sig (2-tailed) Equal
variances not assumed
-.985 -.326 71.70 3.019 .745
The p-value was found to be .745 > .05. The means of the two groups were equal since the p > α. Thus the two groups were of similar character at the start of the research.
Posttest 1 results.
The researcher analysed the posttest results and presented them appropriately. Table 5 shows the group statistics of the posttest1 for the experimental group and the control group.
Table 5: posttest 1 Group Statistics
Group N Mean Std. Deviation Std. Error Mean posttest 1 CG 39 36.51 12.688 2.032 EG 41 53.37 22.814 3.563
The CG had 39 participants a mean of 36.51 and standard deviation of 12.688. The EG had 41 participants a mean of 53.37 and standard deviation of 22.814. Table 6. Show the independent samples t-test results for the posttest 1 for the two groups.
Table 6: Posttest 1 Independent Samples Test
Mean
diff T Df SE diff
p-sig (2-tailed) Equal variances not assumed
-16.853 -4.109 63.208 4.102 .000
Table 6 shows a p-value of, p = .000, α = .05 two tailed. The mean of the EG was significantly different from that of the CG.
Posttest 2 results.
The initial CG and EG were swapped. This is because the research design was a counter balance research design. This ensured that no group of learners was denied the learning opportunity in the course of the research and remove the bias towards the experimental group over the
table 7 shows the posttest 2 group statistics and Table 8 shows the independent samples t-test for the posttest 2.
Table 7: Posttest 2 Group Statistics
Group N Mean Std. Deviation
Std. Error Mean posttest 2 EG 39 48.44 14.151 2.266 CG 41 40.76 17.353 2.710
The EG had 39 participants a mean of 48.44 and standard deviation of 14.151. The CG had 41 participants, a mean of 40.76 and standard deviation of 17.353. Table 8 shows the posttest 2 independent samples t-test results.
Table 8: Posttest 2 Independent Samples Test
Mean
diff t Df SE diff
p-sig (2-tailed) Equal
variances assumed
7.680 .2.163 78 3.551 .034
Table 8 shows a p-value of, p = .034, α = .05 two tailed. The mean of the EG was significantly different from that of the CG. The results indicate that concept maps had an effect on the learner achievement on mole concept. Thus the null hypothesis was rejected and the alternative hypothesis adopted. The findings of the study agree with those of Abayomi and Kehinde [26] who found that concept mapping was an effective instructional tool on secondary school learning outcomes in secondary school. Olorundare and Aderogba [27] adds that students exposed to concept mapping performed better than those exposed to analogy that also performed better than those exposed to expository method of learning. Combining concept mapping with other methods or indeed the traditional or conventional way of teaching has synergistic effect as compared to its unilateral use. This was affirmed by Moono and Singh [28] who found in their research that concept mapping is an effective method of teaching chemistry and that its effect is even significantly higher when it is combined with the traditional method of teaching. These findings are also echoed by [2] who found in their research that learners taught using concept mapping strategy responded better than those taught without concept mapping. Thus based on the results of this research the null hypotheses which stated there was no significant effect on concept mapping on learner achievement was rejected and the alternative hypothesis upheld. And therefore concept mapping had a positive effect on the learner achievement on concept mapping
4.2 Learner achievement by gender.
Table 9: First experimental pretest Group Statistics
GENDER N Mean Std. Deviation Std. Error Mean
PRE TEST MALE 20 31.05 13.694 3.062 FEMALE 21 27.62 17.600 3.841
The first EG had 20 male and 21 females. The males had a mean of 31.05 while the females had a mean of 27.62.
Table 10: First experimental group Pretest Independent Samples t-test by gender
Mean
diff T df SE diff
p-sig (2-tailed) Equal
variances assumed
3.431 .694 39 4.92 .492
Table 10 shows that the first experimental group had a p-value of, p = .492 > .05, α = .05 two tailed. The mean achievement scores of both males and females was not statistically different before the intervention.
Posttest results by gender.
Since there was no significant difference by gender at the start of the research after the intervention posttests were administered to determine if the achievement would differ significantly by gender. Table 11 shows the group statistics by gender after the intervention in the experimental group and table 12 shows the independent samples t-test for the same group.
Table 11: First experimental posttest 1 Group Statistics by gender.
GENDER N Mean Std. Deviation Std. Error Mean POST -TEST 1 MALE 20 61.30 17.171 3.840 FEMALE 21 45.81 25.258 5.512
Table 11 show that the males had a mean of 61.30 and the females had a mean of 45.81 after the intervention.
Table 12: First experimental group posttest 1Independent Samples Test
Mean diff t Df SE diff p-sig (2-tailed) Equal
variances assumed.
15.490 2.285 39 6.779 .028
Table 12 shows that the group had a p-value of, p = .028, α = .05 two tailed. The first EG showed a significant difference by gender. The males had a significant higher mean than the females. The posttest 2 results for the experimental group are shown in table 13 and the independent samples t-test for the same group is shown in table 14.
Table 13: Experimental group posttest 2 Group Statistics by gender
Gender N Mean Std. Deviation
Std. Error Mean
post-test 2 Male 18 46.72 15.036 3.544 Female 21 49.90 13.542 2.955
Table 14: Experimental group Posttest 2 Independent Samples t-test by gender
Mean diff T df SE diff p-sig (2-tailed) Equal
variances assumed
-3.183 -.695 37 4.577 .491
The results in Table 14 show that p-value of, p = .491, α = .05 two tailed indicate that the there was no significant difference in the mean score of the male and female learners in the second posttest. These results agree with the findings of Chawla [29]who found that concept mapping method of teaching had a significant effect on achievement of leaners in chemistry over conventional teaching but that this method had no significant effect on gender with regard to achievement in chemistry. Qarareh [30] adds that the method is beneficial irrespective of gender. The results from the two groups by gender show that both males and females can be impacted positively by concept mapping. In one case the males performed better than female and in another the females performed better than males. Thus overall the null hypothesis could not be rejected.
5.0 Conclusion
There were statistical differences between the experimental and the control groups in favour of the experimental groups. The results of the study showed that concept mapping is for teaching mole concept. Concept mapping has the ability to improve student’s achievement on mole concept and consequently in chemistry because mole concept is applicable to many other topics in chemistry. Also, concept mapping makes students learn meaningfully to improve upon their capacity to answer high order cognitive level questions. Furthermore, in this study both males and females in the experimental groups performed better than their counter parts in the control groups. Therefore concept mapping as a teaching strategy should be used on both males and females when teaching mole concept.
5.1 Recommendations.
Based on the findings of this study, the following recommendations have been made:
1. Since the integration of concept mapping in teaching and learning of mole concept has proved to be effective and since this strategy is relatively new, it should be included in the curriculum of pre-service teachers of chemistry teachers. This will help popularise this technique and bring about more effective learning of integrated science. This is so because most teachers involved in this study were not familiar with the strategy.
5.2 Recommendations for further research
Based on the findings of this research the following recommendations have been made for further research:
1 More research needs to be done to include other topics so that the effect of concept mapping on senior secondary chemistry can be determined. This is because this research only focused on one topic.
2. Another research to be done to include a large sample and a number of schools so that its results can be generalized to a wide population. The results of this study only apply to the sample involved in the study.
References
[1] Ministry of education. , "Educating our futre, national policy on education," Ministry of education, Lusaka, 1996.
[2] Gongden, E.T. and Delmang, T. K. , "The Efficacy of Concept Mapping Instructional Strategy in Remedying Students' Problem-Solving Difficulties in Stoichiometry.," African research review An International Multi-disciplinary Journal, 2016.
[3] Malik, A. , "Technology and developing countries.," Retrieved July 18, 2014 from http://amalik17.blogspot.com/2010/09/importam ce-of-science-andtechnology.html, 2010.
[4] Ministry of general education. , "2015 Annual progress report.," Ministry of general education., Lusaka:, 2015.
[5] Examinations council of Zambia., "Chief examinars' reports.," ECZ, Lusaka, 2012.
[6] Examinations council of Zambia. , "2013 Examination performance report for natural science.," Examinations Council of Zambia., Lusaka, (2013). .
[7] E. M. Omwirhiren, "Analysis of error in learning of mole concept among selectect senior secondary schools in Zeria, Nigeria.," journal of research and method in education, pp. 01-07, 2015.
[8] Gabel, D. L., & Sherwood, R. D. , " Analysing difficulties with mole-concepts tasks by using familiar analog tasks.," Journal of Research in Science Teaching, vol. 21, no. 8, p. 843 – 851, 1984).
[9] Furio, C. , " Difficulties in teaching the concept of 'amount of substance' and the 'mole'," International Journal of science education, vol. 22 , no. 12, pp. 1285-1304, 2000.
[10]Novak. , " Introduction to concept mapping.," 1999.
[11]Novak, J. D., Gowin, D. B., & Johansen, G. T. , "The use of concept mapping and knowledge vee mapping with junior high school science students," Science Education, vol. 67, no. 5, pp. 625-645, 1983.
[12]Mistades, V. M. , "Concept Mapping in Introductory Physics.," Journal of education and human development, vol. 3, no. 1, 2009.
[13]Sabine, A. and Sumfleth, S. , "Collaborative
concept mapping., Tallinn, Estonia and Helsink., 2008.
[14]Johnstone, A. H. , " The development of chemistry teaching: A changing response to changing demands.," Journal of chemical education, pp. 701-705, 1993.
[15]Brousseau, N. and Vázquez-Abad, J. , "High-school students’ problems learning t mole: A study to eventually get it right?," Journal of Research in Science Teaching, vol. 20, no. 2, pp. 163-177, 2017.
[16]MINISTRY OF EDUCATION, SCIENCE, VOCATIONAL, TRAINING AND EARLY EDUCATION , "Chemistry syllabus grade 10-12," Curriculum Development Centre , Lusaka, 2013.
[17]Indriyanti, N. Y. and Barke, H., "Teaching the mole concept with sub-micro level:Do the students perform better?," Vols. AIP Conference Proceedings 1868, 030002 (2017); doi: 10.1063/1.4995101, 2017.
[18]Hafsah, T., Rosnani, H., Zurida, I., Kamaruzaman, J., & Khoo, Y. Y. , "The influence of students’ concept of mole, problem representation ability and mathematical ability on stoichiometry problem solving.," in The 2014 WEI International Academic Conferenc, 2014. [19]Bamidele, E. F., Adetunji, A. A., Awodele, B.
A., and Irinoye, J. , "Attitudes of Nigerian secondary school chemistry students towards concept mapping strategies in learning the mole concept," Academic journal of interdisciplinary studies, pp. MCSER-CEMAS, 2000.
[20]Musa, U. , " Teaching the mole concept using a conceptual change method at college level.," Education, vol. 194, no. 4, p. 683 – 691, 2009. [21][Examination Council of Zambia, "2012
Examination perfomance report for Natural sciences," Examinatio Council of Zambia, Lusaka., 2012.
[22]Examination council of Zambia, "2014 Examination performnance report for natural sciences," ECZ, Lusaka, 2014.
[23]Examination council of Zambia, "2015 Examination performance report for natural sciences," ECZ, Lusaka, 2015.
[24]Examination council of Zambia, "2016 Examination preformance report for natural sciences," ECZ, Lusaka, 2016.
[25]Examination council of zambia, "2017 Examination performane report for natural sciences," Examination council of zambia, Lusaka, 2017.
[26]Abayomi, O. and Kehinde, O. A., "Effects of Concept Mapping and Problem Solving Instructional Strategies on Secondary School Learning Outcomes in Chemistry," African Research Review , vol. 2, no. 1, 2008.
[28][Moono, K and Singh, I. S. , " The Effect of using Concept Maps on Student Achievement in Selected Topics in Chemistry at Tertiary Level.," Journal of Education and Practice, vol. 6, no. 15, 2015.
[29]Chawla, J. , " Effect of Concept Mapping Strategy on Achievement in Chemistry of IX Graders in Relation To Gender," International Journal of Science and Research (IJSR)., vol. 4, no. 12, 2015.
[30]Qarareh, A.O.T., "he effect of using concept mapping in teaching on the achievement of fifth graders in Science.," Studies on Home and Community Science, Vols. 4(3), , no. Retrieved from www.krepublishers.com/.../HCS-4-3-155-10-127Qarareh-A-O-Tt.pdf, pp. 155-160., 2010. [31]ministry of general education, "2015 annual
progress report," ministry of general education, Lusaka, 2015.
APPENDIX: A
CONCEPT MAPS USED BY THE TEACHER