Flood Modelling by using HEC-RAS
Azhar Husain
Associate Professor Department of Civil EngineeringJamia Millia Islamia, (central university) New Delhi
Abstract: HEC-RAS is an integrated system of software, designed for interactive use in a multi-tasking, multi-user network environment. The system is comprised of a graphical user interface (GUI), separate hydraulic analysis components, data storage and management capabilities, graphics and reporting facilities.
The HEC-RAS system will ultimately contain three 1-dimensional hydraulic analysis components for: (1) Steady flow water surface profile computations; (2) unsteady flow simulation;
(3) Movable boundary sediment transport computations.
Currently steady and unsteady flows are available and sediment transport is under development. A key element is that all three components will use a common geometric data representation and common geometric and hydraulic computation routines. In addition to the three hydraulic analysis components, the system contains several hydraulic design features that can be invoked once the basic water surface profiles are computed; including bridge scour computations, uniform flow computations, stable channel design, and sediment transport capacity.
Keywords: graphical user interface (GUI), HEC-RAS, steady flow and unsteady flow
I Introduction
A flood is an unusually high stage in a river. It is an overflow of water outside its normal course. A flood results when a stream runs out of its confines and submerges surrounding areas. A flood from sea may be caused by a heavy storm, a high tide, a tsunami, or a combination thereof. As many urban communities are located near the coast this is a major threat around the world. The annual cycle of flood and farming was of great significance to many early farming cultures, most famously to the ancient Egyptians of the Nile River and to the Mesopotamians of the Tigris and Euphrates rivers. In less developed countries, humans are particularly sensitive to flood casualties because of high population density, absence of zoning regulations, lack of flood control, and lack of emergency response infrastructure and early warning systems. Bangladesh is one of the most susceptible countries to flood disasters. About one half of the land area in Bangladesh is at an elevation of less than 8 meters above sea level. Up to 30% of the country has been covered with flood waters. In 1991 more 200,000
deaths resulted from flooding and associated tropical cyclones. In industrialized countries the loss of life is usually lower because of presence of flood control structures, zoning regulations that prevent the habitation of seriously vulnerable lands, and emergency preparedness. Still, property damage and disruption of life takes a great toll, and despite flood control structures and land use planning, floods still do occur.
II HEC-RAS
HEC-RAS is based on the U.S. Army Corps of Engineers’ HEC-RAS water surface profile model used for modeling both steady and unsteady, one-dimensional, gradually varied flow in both natural and man-made river channels. HEC-RAS also allows sediment transport/mobile bed computations and water temperature modelling.
Steady and unsteady flow modeling.
Mixed flow regime analysis, allowing analysis of both subcritical and supercritical flow regimes in a single computer run.
Bridge and culvert analysis and design, including FHWA culvert routines for elliptical, arch, and semi-circular culverts.
Multiple bridge and culvert openings of different types and sizes at a roadway crossing.
Bridge scours computations following FHWA Publication HEC-18.
Bridge design editor and graphical cross section editor.
Floodplain and floodway encroachment modelling
Multiple profile computations.
Lateral flow, split flow, over bank dendritic networks.
Sediment transport/movable bed modelling.
Sediment Impact Analysis Methods (SIAM).
Water quality capabilities (temperature modelling).
Tidal boundary conditions.
Reservoir and spillway analysis
Levee overtopping.
User defined rules for controlling gate operations.
Pumping of flooded areas.
Geometric model schematic can be placed over background maps. and incorporate clickable scanned images of structures
Inline weirs and gated spillways analysis, including both radial and sluice type gates and Ogee, broad and sharp crested weirs.
Tributary/diversion flow network capabilities, allowing for fully looped river system analysis in which reaches can be subdivided and combined
Quasi 2-D velocity distributions.
X-Y-Z (pseudo 3-D) graphics of the river system.
III HEC-RAS Hydraulics
HEC-RAS is a one-dimensional steady flow hydraulic model designed to aid hydraulic engineers in channel flow analysis and floodplain determination. The results of the model can be applied in floodplain management and flood insurance studies. If you recall from hydraulics, steady flow describes conditions in which depth and velocity at a given channel location do not change with time. Gradually varied flow is characterized by minor changes in water depth and velocity from cross-section to cross-section. The primary procedure used by HEC-RAS to compute water surface profiles assumes a steady, gradually varied flow scenario, and is called the direct step method. The basic computational procedure is based on an iterative solution of the energy equation, which states that the total energy (H) at any given location along the stream is the sum of potential energy (Z + Y) and kinetic energy (V2/2g).The change in energy between two cross-sections is called head loss (hL). The energy equation parameters are illustrated in the figure1.1:
Figure Error! No text of specified style in document..1 Flow in open channel
Given the flow and water surface elevation at one cross-section, the goal of the direct step method is to compute the water surface elevation at the adjacent cross-section. Whether the computations proceed from upstream to downstream or vice versa, depend on the flow regime. The dimensionless Froude
number (Fr) is used to characterize flow regime, where:
• Fr < 1 denotes Subcritical flow • Fr > 1 denotes Supercritical flow • Fr = 1 denotes Critical flow
For a subcritical flow scenario, which is very common in natural and man-made channels, direct step computations would begin at the downstream end of the reach, and progress upstream between adjacent cross-sections. For supercritical flow, the computations would begin at the upstream end of the reach and proceed downstream.
IV Project Methodologies:
The following paragraphs describe the methodologies used in performing the one-dimensional flow calculations within HEC-RAS. The basic equations are presented along with discussions of the various terms. Solution schemes for the various equations are described. Discussions are provided as to how the equations should be applied, as well as applicable limitations.
♦ General
♦ Steady Flow Water Surface Profiles
Steady Flow Water Surface Profiles:
HEC-RAS is currently capable of performing one-dimensional water surface profilecalculations for steady gradually varied flow in natural or constructed channels. Subcritical, supercritical, and mixed flow regime water surface profiles can be calculated. Topics discussed in this section include: equations for basic profile calculations; cross section subdivision for conveyance calculations; composite manning's n for the main channel; velocity weighting coefficient alpha; friction loss evaluation; contraction and expansion losses; computational procedure; critical depth determination; applications of the momentum equation; and limitations of the steady flow model. Figure depicts the terms of the energy equation representation.
V Equations for Basic Profile Calculations:
Water surface profiles are computed from one cross section to the next by solving the energy equation with an iterative procedure called the standard step method. The energy equation is written as follows:
Z1, Z2= elevation of the main channel inverts Y1, Y2= depth of water at cross sections
V1,V2= average velocities (total discharge/ total flow area)
Friction Loses:
The energy loss term he in equation 1 is composed of friction loss hfand form loss ho. Only contraction and expansion losses are considered in the geometric form loss term.
he= hf+ ho
To approximate the transverse distribution of flow of the river is divided into strips having similar hydraulic properties in the direction of flow. Each cross section is sub divided into portions that are referred to as subsections. Friction loss is calculated as shown below:
A1, A2 = downstream and upstream area, respectively of the cross sectional flow normal to the flow direction
J = total number of subsections
Lj = length of the jth strip between subsections n = Manning’s roughness coefficient
Q = water discharge
R1, R2 = downstream and upstream hydraulic radius
Other losses:
Energy losses due to contractions and expansions are computed by the following equation:
Where,
CL = loss coefficient for contraction and expansion. If the quantity within the absolute valuenotation is negative, flow is contracting, CL is the coefficient for contraction; if is positive, flow is expanding and CL is the coefficient of expansion. In the standard step method for water surface profile computations,calculations proceed from the downstream to upstream based upon the reach’s downstream boundary conditions and starting water surface elevation.
VI Working of HEC-RAS
In HEC-RAS terminology, a Project is a set of data files associated with a particular river system. The modeler can perform any or all of the various types of analyses, included in the HEC-RAS package, as part of the project. The data files for a project are categorized as follows: plan data, geometric data, steady flow data, unsteady flow data, sediment data, and hydraulic design data. During the course of a study the modeler may want to formulate several
different Plans. Each plan represents a specific set of geometric data and flow data. Once the basic data are entered into the HEC-RAS, the modeler can easily formulate new plans. After simulations are made for the various plans, the results can be compared simultaneously in both tabular and graphical form.
This chapter provides an overview of how a study is performed with the
HEC-RAS software.
Starting HEC-RAS
Steps in Developing a Hydraulic Model
With HEC-RAS
Starting HEC-RAS: To Start HEC-RAS from Windows:
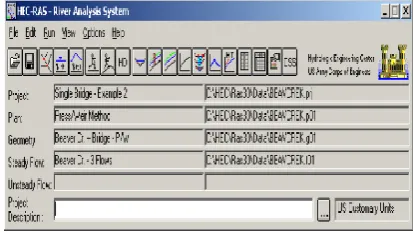
Double-click on the HEC-RAS Icon. If you do not have an HEC-RAS shortcut on the desktop, go to the Start menu and select Programs, then select HEC, and then HEC-RAS. When you first start HEC-RAS, you will see the main window as shown in Figure (except you will not have any project files listed on your main window).
Figure Error! No text of specified style in document..2 HEC-RAS main window
HEC-RAS Main Window Menu Bar Structure At the top of the HEC-RAS main window is a Menu bar with the following options:
Summary;Import HEC-RAS data; Generate Report; Export GIS Data; Export to HEC-DSS; Restore Data; and Exit. In addition, the most recently opened projects will be listed at the bottom of the File menu, which allows the user to quickly open a project that was recently worked on.
Edit: This option is used for entering and editing data. Data are categorized. into four types: Geometric Data; Steady Flow Data; Unsteady Flow Data; and Sediment Data. In the current version, Sediment Data is not active.
Run: This option is used to perform the hydraulic calculations. The options under this menu item include: Steady Flow Analysis; Unsteady Flow Analysis; Sediment Analysis; and Hydraulic Design Functions. In the current version, Sediment Analysis is not available.
View: This option contains a set of tools that provide for graphical and tabular displays of the model output. The View menu item currently includes: Cross Sections; Water Surface Profiles; General Profile Plot; Rating Curves; X-Y-Z Perspective Plots; Stage and Flow Hydrographs; HydraulicProperties Plots; Detailed Output Tables; Profile Summary Tables; and Summary Err, Warn, Notes.
Options: This menu item allows the user to change Program Setup options; set Default Parameters; establish the Default Units System (U.S. Customary or Metric); and Convert Project Units (U.S. Customary to Metric, or Metric U.S. Customary).
Help: This option allows the user to get on-line help, as well as display the current version information about HEC-RAS. Also on the HEC-RAS main windows a Button bar . The Button bar provides quick access to the most frequently used options under the HEC-RAS menu bar.
A description of each button is shown in Figure.
Steps in Developing a Hydraulic Model with HEC-RAS
There are five main steps in creating a hydraulic model with HEC-RAS:
Starting a new project
Entering geometric data
Entering flow data and boundary conditions Performing the hydraulic calculations Viewing and printing results
VII Review of Flood Modelling Studies
Numerous flood modeling studies have been conducted using available modeling package.Snead (2000) presented the application of steady flow hydraulic model using HEC-RAS, for flood routing and visualization for mill creek watershed located in Cincinnati, Ohio.
Model used rainfall run-off data in time series format from existing HEC-HMS model.Zaseh et al. (2005) estimated the extent of flood zone and economic damage over an 8.2 km reach of the perennial LaeenaSoo in the northern Kharasan province, Iran using HEC-GEORAS,acombination of HEC-RAS and arc view GIS software .
A two dimensional model was used to design a rock dike just upstream of the new opening and to determine whether bank protection is needed after construction of project.
Flow direction information gathered from the two dimensional model was used with HEC-RAS to perform scour analysis.
Kester and Davis (2010) through the Maryland state highway administration, office of structure had adopted a proactive approach with respect to determination of hydraulic variables for computing scour at structure.
Peppenberger et al. (2005) found out that while choosing a routing method, the accuracy and availability of lateral inflow data, channel cross section and roughness coefficient and velocity discharge information may have a greater effects on the predictive accuracy of the routing algorithm than the choice of descriptive equations.
The author concluded that it would not be wise to choose a model based on full Saint-Venant equation if the quasi–uniform flow relationship used to quantify the friction slope is not appropriate in the channel under study, or if the discharge change between two sites is dominated by poorly estimated lateral or tributary inflows.
Klenzendorfet al.(2010) describe a method for incorporating the hydraulics of various bridge rail geometries on a bridge structure to determine the impacts on the surrounding flood plain during extreme flood events.
Paz et al.(2010) presents a one dimensional hydrodynamic model of a large scale river network and flood plains. The study size comprises the upper Paraguay river and its main tributaries in south America central areas, including a complex river network flowing along the pentanal wetland. The main issues were related to preparing input data for the hydraulic model in a consistent and geo-referenced database and to presenting different flow regimes.
Dai et al. (2010) presented the application of 3-D model. A grid scheme was constructed by using SMS software along the Detroit river. Modeling calibration results provided an average relative error of 10% between measured and calculated velocities.
Hammersmark (2002) used a one dimensional unsteady hydraulic model to evaluate the flood stage impact of seven management scenario for the Mac Cormac – Williamson tract located in the northern scramento-san Joaquin Delta.
The result of the modeling effort indicate that the restoration of tidal marsh habitat within the Mac-Cormack Williamson Track would have a minimal impact upon flood stage during the range of flooding condition, including rare large flooding event.
Tate and Maindment (1999) presented a straight forward approach for processing output of HEC-RAS hydraulic model to enable two and three dimensional flood plain mapping and analysis in the Arc view geographic information system.
The resulting surface model provides a good representation of the general landscape and contains additional details within the stream channel.
Villazon el al (2009) analysed the flow dynamic process and the quantification of the peak discharge by using HEC-RAS. Flooding in Pirai river responds entirely to flash floods and therefore unsteady flow had to be simulated it was done using derived hydrographs from measured hourly water level as boundaries condition.
Akaret al.(2009) studied the effect of land use features on flood occurrence by using GIS and remote sensing techniques.
Yang and Rystedt(2002) use geographic information system(GIS) and hydrodynamic modeling to obtain flood information for flood emergency planning.
The feasibility of simulating a flood event along a river channel is explored in areas near a residential development Eskilstuna community Sweden.
The results show that integration of GIS and hydrodynamic modeling is an efficient way to predict flood and obtain flood information for emergency response planning and evaluation of degree of risk posed to the local community.
McKay and Blain (2000) describe a hydrodynamic flow and inundation model for the lower pearl river in Mississippi and Louisiana.
Image analysis techniques were applied to high resolution aerial topography of the Pearl River to extract the channel boundaries and a synthetic bathymetry is generating by fitting an idealized cross section across the channel.
Chen (2008) applied a multi block model named less to effectively deal with the complex geometry of manatee and braden river estuaries.
Park et al (2002) developed a high resolution integrated hydrology and hydrodynamic model of Barataria basin to simulate the local hydrological cycle over the surrounding drainage basinand hydrodynamics within the basin.
Al-Fahdawi (2009) applied a numerical model to hydrodynamic modeling of the Euphrates river in its reach between Hathida dam and Hit city.The author used HEC-RAS model to determine different parameter from given flood caused by a hypothetical foundation failure of Hathidadam .
Yarakulla et al (2010) develop a flood forecasting model for subrnarekhgariver .
Saleh et al (2013) concluded that the accuracy of predicted water level and maximum water depth simulated by Saint -Venant model relies on an accurate representation of channel geometry and bed level slopes along the river reach.
VIII Hydrodynamic simulation software
Abdelbasset et al. (2015) applied HEC-RAS model to calculate water surface profiles corresponding to selected flood events downstream of AL Wahda Dam in Sebou basin in Northern Morocco.
magnitude of rainfall event caused more influences on river flood hazard map in comparison with the land use development condition for Sungai Kayu Ara river basin.
Cecile Ashwanden et al. (2010) compared water surface profiles for Tar River generated from steady and unsteady flow hydraulic models.
Brych et al. (2002) developed, flood hazard maps of urban areas in the Orlicevalley(Czech republic) using HEC-RAS software. Extreme floods were considered to calibrate the hydraulic model of the Orlice river system.
IX Flood Modelling Studies in India
Vijay et al. (2007) describes a hydrodynamic model called River Cad that provides the flood levels and land availability at various cross – sections in order to assess the limitation and evaluate the possibilities for riverbed development.
Mazumder (2009) describes the methodology for the determination of waterway for a bridge using detailed topographic, hydrologic and morphological investigation.
The study by Timbadiya (2011) aimed at determining values of Manning’s roughness coefficients for upper and lower reaches of the lower Tapi River for simulation of flood. The requirement of multiple channel roughness coefficients (Manning’s n values) along the river has been spelled out through simulation of flood, using HEC-RAS, for the years 1998 and 2003.
Sharma et al.(2012) focused on the mo0nitoring of the diffuse pollution characterstics of the agricultural land confining the River Yamuna in Delhi. Agricultral fields surrounding Yamuna river are the point source of pollution that directly impact the river quality.
Arunesh (2012) estimated the design flood at Hathnikund and Okhla barrages for different return levels. An analysis of the frequency of flood peaks for different threshold was also carried out at both the barrages. Two methods have been used for the estimation of design flood, namely Gumbel’s extreme value distribution and Log Pearson type 3 distribution. The result of frequency analysis clearly indicates that the frequency of extreme events has increased in the recent past. This result is significant as it clearly indicates that there is an urgent need to develop flood prevention and mitigation measures for Delhi and NCR region.
Pramanik et al. (2010) used extracted river cross sections to simulate the magnitude of flood in the deltaic reaches of Brahmani river basin located in the eastern India. Forty cross section along the reaches of the rivers were extracted from the DEM and were used in the MIKE 11 hydrodynamic (MIKE 11HD) model. Four available measured river cross sections were compared with the DEM extracted modified cross section to examine their geometric and hydraulic similarity.The model validation results showed a close agreement between the simulated and observed stage hydrographs.
Vijay et al. (2009) presented hydrodynamic simulation of the river Yamuna under different designated flood flows to delineate the land availability under existing and modified riverbed geometry including channel dredging and riverbed dressing.
Doiphode and Ravindra(2012) focused on the concepts of hydraulic flood routing model, with time-varying roughness updating to simulate flows through natural channels. The authors solved Saint Venant'sequationusing the quasi-steady dynamic wave and full dynamic wave theory. A case study of unsteady flood modelling through HEC-RAS was carried out for the Karad - Kurundwad reach of Krishna River.
Sankhua et al. (20 12.) focused on concepts of hydraulic flood routing model, with time-varying roughnessupdating to simulate flows through natural channels, based on the quasi–steady dynamic wave and full dynamic wave theory, emphasizing the solving of the intricate Saint Venant’s equations. Parhi et al. used HEC-RAS to calibrate the channel roughness coefficient (Manning’s n value) along the river Mahanadi, Odisha. The authors concluded thatmannnig’s "n” value of 0.032 gives best result for Khairrmal to Munduli reach of' the Mahanadi river. The calibrated model,in terms of channel roughness, was used to simulate the flood for year 2006 in the sam river reach. The performance of the calibrated and validated HEC-RAS based model is tested using Nash and Sutcliffe efficiency.
Timbadiya et al., (2012) developed an integrated hydrodynamic model of the lower Tapi River, India. Firstly the one-dimensionaI model hydrodynamic model was calibrated for Manning’s roughness of river channel and subsequently one-dimensional and two-one-dimensional integrated 11 hydrodynamic model was used to ascertain the sensitivityof Manning’s 'n' on coastal flood plain depth of the lower Tapi river.
Arabian Sea and the Tapi River in Surat City, Gujarat. The design of table channel was carried out using thecopeland method, which has been in included in the HEC-RAS model. A review of the application of remote sensing and GIS in flood management with particularfocus on the developing countries of Asia has been presented by Sanyal et al., (2004).
X CONCLUSIONS
Flood modelling system here presented copes with a basic need of standardization of the databases system. The main goal is to provide an flood control system in which all computations made by the different regional involved in river training, hydraulic works and similar activities can converge,. Application of hydraulic modelling in HEC-RAS environment provides the capability to simulate flood depth in different part of the floodplain. It is describes the application of HEC-RAS model for simulation of water surface profiles in the study reach. The output from the HEC-RAS model was utilized to determine the extent of overtopping of bridges/barrages in the study reach when subjected to flood of a given magnitude. With increased stream flows at different locations in the future, the vulnerability of the basin to high magnitude flooding events is likely to increase under future climatic change in the River basin system.
XI REFERENCES
[1] Djokic and Maidment 2012. Introduction to HEC-RAS and FloodplainMapping
http://www.ce.utexas.edu/prof/maidment/CE374KSpr12/Ex 4/Ex4.htm
[2] Ndolo Goy and Julien, 2014. CIVE 401 HEC-RAS Presentation.
http://www.engr.colostate.edu/~pierre/ce_old/classes/CIVE %20401/index.html
[3] US Army Corps of Engineers. HEC-RAS
[4] Mohammed Lateef Ahmed, 2015. Hydrodynamic Simulation of River Yamuna for various return level floods, thesis, Department of Civil Engineering, Faculty of Engineering and Technology, Jamia Millia Islamia, (Central University), New Delhi.
[5] HEC-RAS River Analysis System (2010), “Hydraulic Reference Manual”, Version 5.0.1, U.S. Army Corps of Engineers, Hydrologic Engineering Center, Davis, California.
[6] HEC-RAS River Analysis System (2010), “User Manual”, Version 5.0.1, U.S. Army Corps of Engineers, Hydrologic Engineering Center, Davis, California.
[7] Manning, R. “Flow of water in open channels and pipes.” Transactions of the Institutionof Civil Engineers (Ireland), 20, 1980.
[8] Mays, L.W. (2005) “Water Resources Engineering”, John Wiley and Sons Inc., New Delhi, India.
[9] Manning, R. “Flow of water in open channels and pipes.” Transactions of the Institution of Civil Engineers (Ireland), 20, 1890
[10] Parhi, P.K. (2013) HEC-RAS Model for Manning’s Roughness: A Case Study Open Journal of Modern Hydrology.
[11] Prasuhn. A.L. Fundamentals of Hydraulic Engineering. Oxford University Press, New York, NY, 1992
[12] Tate, E.C., and Maidment, D. (1999). Floodplain mapping using HEC-RAS, Center for Research in Water Resources, Bureau of Engineering Research, University of Texas, Austin, TX.
[13] Timbadiya, P.V., Patel, P.L., and Porey. P.D. (2012). Caliberation of HEC-RAS model on prediction of flood for lower Tapi river,India, J. of Wat. Reso. And Prot.,3:805-811 [14] Vijay, R., Sargoankar, A. and Gupta, A. (2007).
Hydrodynamic Simulation of river Yamuna for riverbed assessment: A case study of Delhi region, Environment Monitoring Access.
[15] Vijay, R., Sargoankar, A. and Gupta, A. (2009). A hydrodynamic Approach to address Yamuna riverbed development in Delhi. J. Civ. Eng. 36:1155-1163.
[16] Wurbs, R.A., and James, W.P. (2007). “Water Resources Engineering”, Prentice Hall of India, New Delhi, India. [17] Zadeh, A.H., Ahmadi, M.Z., Sharifi, M.B. and Masoudian,