Efficient Model for Intrusion Detection using
Enhanced Classification Technique
Elsayed A.Elhafeez
#1, Amr M. Gody
#2, Tamer M. Barakat
#3, Ayman. I. Madbouly
#41, 2, 3Electrical Engineering Department, Faculty of Engineering, Fayoum University
,
Egypt 4 Advisor for Vice President for Development, King Abdulaziz University, Jeddah, Saudi Arabia. 4 Building Physics and Environment Research Institute, Housing and Building National Research Center,Cairo, Egypt
Abstract — False alerts are the most major problem that disturbs network administrator. In spite of the intelligent methods and strategy used by intrusion detection system, elimination of false alerts is still a big challenge. Due to the huge amount of information transmitted through the network, the traffic contains a big amount of redundant and duplicated information. That leads to bias the classifier and decrease classification accuracy and increase false alerts. So, we proposed an enhanced model to eliminate false alerts whether it was false positive or false negative alerts and increase the accuracy of intrusion detection system.
Keywords—IDS, false positive alerts, false negative alerts.
I-Introduction
Currently, information technology plays a major rule in human life. Needs for networks and using of World Wide Web have increased to get information and use for business. But, the real challenge is the increase of attacks and intrusions to corrupt, steal the data, damage the network and prevent users from using the resources of the network. So, the needs for a defense system to protect information have increased and IDS system has become a major part of this defense system. This leads many researchers to analyze the IDS system and the data transmitted through the network to enhance the accuracy of the IDS and decrease the false alerts that may be false positive alerts or false negative alerts. Many data set benchmarks are used by researchers to analyze the traffic transmitted through the network. We will use KDD Cup99 data set benchmark and analyze the data set and choose classifier with the lowest false alert rate and the highest accuracy.
II-Intrusion Detection system
With increasing of attacks and unauthorized events on Networks Companies it is now a must for them to increase its defense system by IDS to detect individuals attempting attacks and unauthorized events or trying to compromise the confidentiality, integrity, availability against your network from inside or outside intruder, like the following: Reconnaissance, Access and Denial of Services or bypass security rules. [1], [2]
A. Types of intrusion detection system - Profile-Based Detection (anomaly)
Anomaly Behaviour departs from known profile of normal activity requires creation of statistical user profiles
This type of IDS creates a traffic pattern of normal network operation.
- IDS, analyse the traffic patterns that are statistically unusual. Like, ICMP abnormal load, abnormal increasing of port scans, etc.
- analysing any abnormal traffic pattern producing an alert.
- The challenge in this type of IDS deployment is the difficulty in distinguishing between normal and abnormal traffic.
- Signature-Based Detection
Misuse Behaviour matches known patterns of malicious activity requires the creation of misuse signatures. It needs a database of known attacks with their signatures.
Signature is defined by the type of packets and its sequence characterizing as an attack.
The disadvantage of signature IDS is that it only detects the known attacks previously. Signature based on IDS can have a false alert when a pattern of a normal packet matches the pattern or signature of an attack. [3].
III- KDDCUP99 data set description
KDD'99 is one of the most popular benchmark data sets used to choose proper intrusion detection metrics. About 5 million of TCP connection of raw data (4 gigabytes of compressed binary TCP dump) is used. Each connection is described with 41 Features.
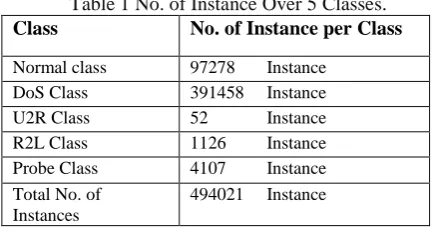
There are many versions of KDD cup 99 data sets available online. KDD'99 is actually composed of three data sets; a full training set (4,898,431 instances), a 10% version of this training set (494021 instances), and a tested set (311,029 instances).
features ) and 34 continuous (numeric features) . [4], [5], [6]
Table 1 No. of Instance Over 5 Classes. Class No. of Instance per Class
Normal class 97278 Instance
DoS Class 391458 Instance
U2R Class 52 Instance
R2L Class 1126 Instance
Probe Class 4107 Instance
Total No. of Instances
494021 Instance
A. KDD'99 Data set Attack Classes
.
Denial of Service (DOS).It is an attack to prevent services from the run or preventing users from using the network resources..
User to Root (U2R).It is an attack where a user tries to get root permissions..
Remote to Local (R2L).It is a type of attack that a nonuser that doesn't have an account can access the system as a user..
Probe. It is an attack that aims to collect information about the network to use its vulnerability.Table 2 Distribution of Attacks Over 4 Classes.
IV-Related work
Vivik K shirsagar , Dr.madhuri joshi introduce a model for enhancing a false positive rate using stacking algorithm with the random tree and part classifiers and get accuracy 92.7% [10].
Ghassan Ahmed Ali used honeybee concept and frame work to improve the detection rate of IDS with an overall rate 99.1% [11].
Pavan singhal, gajendra singh introduce a hybrid machine learning approach with accuracy 97.476 [12].
Azween Abdullah, cai long zheng improve detection rate using genetic linear discriminant analysis with a detection rate 99.3 % [13].
Dhakar, Mradul, and Akhilesh Tiwari achieve accuracy 99.96 using a hybrid intrusion detection framework using [14].
Golmah, Vahid, improve the accuracy to 99.96 using a hybrid model based on C5.0 and SVM algorithms [15].
Chen, Shi, et al present a graphical feature generation approach and achieve 98.54% accuracy [16].
Gholipour Goodarzi, Bahareh, Hamid Jazayeri, and Soheil Fateri have a hybrid algorithm (SVM and ABC) with accuracy 99.71 [17].
Rasha Thamer Shawe, Safana H. Abbas introduce a model to increase the accuracy by data reduction method using improved SVD and one classification algorithms are used which are the Back propagation Neural network (BPNN) with accuracy 94.344 [18]. Kyung-min Kim _ Jina Hong y Kwangjo Kim z Paul D. Yoo use a clustering algorithm with a supervised machine learning algorithm that detects the attacks with accuracy 99.6 %. [19]
V- Proposed Model
The false alerts in intrusion detection are the challenge that disturbs the network administrator and decreases the detection rate of IDS. Minimizing the rate of this alerts is the big goal of the network administrator. These false alerts are due to the bias of classification. Because of the redundant and duplicated instances and the differences in the distribution of attacks over classes in the data set. So, we introduce an enhanced model to improve the classification accuracy and minimize the false alerts rate using Meta learning (Multiclass classifier) and Random Forest algorithm [7].
Our model is divided into 5 stages. The first stage is the pre-processing phase in which we prepare the data values as numeric or nominal values. The second stage is cleaning the data from duplicated data. The third stage is classification stage which is used to apply and compare the performance of the most popular algorithms from the machine learning algorithms. This is followed by choosing the best one that has the best accuracy and lowest false alarms. From tree algorithms, we use c4.5 decision tree [20] and Random Forest [21], from rules algorithms we use Part and Jrip, from Bayes algorisms we used Naive Bayes [9], and function algorithms we used liblinear [8].
The fourth stage enhances the best classifier using Meta learning algorithms to improve the performance.
The fifth stage is the evaluation stage where we will apply the enhanced classifier from the 4th stage on the pre-processed data and clean data set and original 10% KDD Cup 99 .and discuss the results.
A. Methodology
We will use Weka machine learning tool to perform our experiment.
Input data set: 10%KDDcup99 data set 494021 instance – 23 class (normal and 22 attack).
Class Attack Type
DoS Back, Neptune, Pod, Teardrop, Smurf, Land
Probe Satan, Portsweep , Nmap, Ipsweep
R2L Guess_ Password, Ftp_write, Imap, Phf,
Warezmaster, Multihop, Warezclient, Spy
Pre-processing phase
- Apply unsupervised filter numeric to nominal attribute to the attributes with symbolic values to prepare the data. - Output: preprocessed data.
- Apply unsupervised rename nominal value filter to prepare the data.
- Apply unsupervised remove unused class value filter
- Output tested data with 5 classes.
Remove duplicate phase.
- Apply unsupervised remove duplicated instances filter to clean the data from redundant instances.
- The Output of this phase is a removed duplicated data set.
- Apply unsupervised rename nominal value filter to the removed duplicated data set. - Apply unsupervised remove unused class
value filter
- The output of this phase is the clean data set with 5 classes.
Classification phase
- Apply different learning algorithms by choosing the best-known classifier from each algorithm. From tree algorithm (j48 and random Forest), rule algorithm (Part and Jrip), function (Liblinear), Bayes algorithm (Naïve Bayes).
- All classification is done using stratified 10-fold cross-validation.
- Compare the accuracy of all classifiers and choose the best classifier with the highest accuracy and lowest false alerts.
Enhance the classifier phase
- Enhance the best classifier using Meta learning algorithm.
- The output of this phase is an enhanced classifier. That can use to classify the tested data.
Evaluation Phase
- Input data is the tested data from the preprocessing phase.
- Apply the enhanced classifier to the tested data.
- Evaluate the enhanced classifier performance on the tested data for false positive and false negative alerts for each class and overall accuracy and false alert rate.
VI- Performance and accuracy measurements The common criteria to evaluate the model efficiency are false positive rate, precision, recall (true positive rate), overall false alerts, and accuracy.
Evaluation parameter
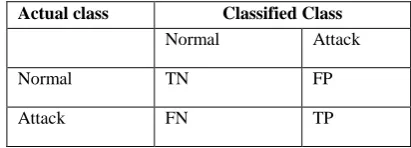
Table 3 Confusion Matrix for Evaluation.
Where
TN (True Negative): refers to the number of normal instances that classified as a normal.
FP (False positive): refers to the number of normal instances that classified as a type of attack.
FN (False Negative): refers to the number of attacks instances that classified as a normal.
TP (True Positive): refers to the number of attacks instances that classified to its class of attack. TPR (True Positive Rate) Number of correctly classified instances to its right class
Accuacy = TP + TN
TP + TN + FP + FN ( 1 )
TPR(true positive rate) = TP
TP + FP ( 2 )
FPR(false positive rate) = FP
TN + FP ( 3 )
VII- Results and discussion A. pre-processing phase
Input data is 10% KDD Cup 99 data set 494021 instances 23 class with 38 numeric features and 3 nominal feature. Outputs of this phase are two data sets with 34 numeric features and 7 nominal features. With 494021 instances. The first data set is the pre-processed data set with 23 classes. The second data set is the tested data with 5 classes. B. Remove duplication phase
The input data of this phase is the pre-processed data from pre-processing phase. We reduce the data set by 70.5% by removing all duplicated instances and obtaining a clean data set with 145586 instances distributed over 5 classes (table4).
Table 4 Distribution of Instances in the Clean Data set
Class No. of Instances per Class
Normal class 87832 instance
DOS Class 54572 instance
U2R Class 52 instance
R2L Class 999 instance
Probe Class 2131 instance
Total no. of instance 145586 instance
Classified Class Actual class
Attack Normal
FP TN
Normal
TP FN
99.89 99.94 99.91 99.92
97.12
89.66
89 90 91 92 93 94 95 96 97 98 99 100
Co
rr
ec
tl
y
Cl
a
ss
if
ied
%
0.11
0.06
0.08 0.09
0 0.1 0.2
In
co
rr
e
ctl
y C
lassi
fi
e
d
%
99.98
75
97.8 99.99 99.11
99.96
63
96.4 99.93 97.98
60 70 80 90 100
NORMAL U2R R2L DOS PROBE
D
e
te
ct
ion
R
at
e
%
Our Model
Dhakar Model C. Classification phase
We apply all classifiers to the clean data set. We obtained that the random Forest is the best classifier with the best accuracy and lowest false alarm. Where C4.5, Random Forest, Part, Jrip, Liblinear and Naïve Bayes achieve accuracy 99.89 %, 99.94%, 99.91%, 99.92%, 97.12% and 89.66% respectively (fig 1). And false alarm 0.11%, 0.06%, 0.09%, 0.08%, 2.88%. 10.44% respectively. See (fig 2)
Fig 1 accuracy for classifiers of classification phase.
Fig 2 percentage of false alerts.
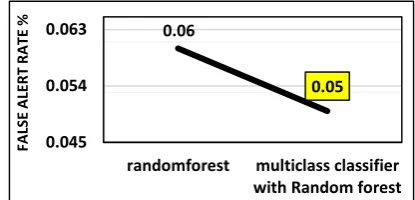
D. In 4th phase, we enhance random Forest using Meta learning algorithms by Multi Class classifier. We obtained accuracy 99.95% and false alarms rate 0.05% that better than random Forest see fig 3 and fig 4.
Fig 3 Comparison of accuracy for random forest and multiclass with random forest
Fig 4 Comparison of false alerts for random forest and multiclass with random forest
E. Evaluation Phase
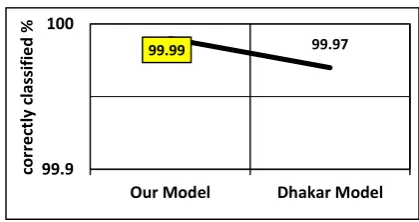
In the evaluation phase, we apply the enhanced classifier (Multi class classifier with random Forest) to the tested data set from the pre-processed phase, clean data set from remove duplication phase and origin 10% KDD Cup 99 with 23 class. We will use 10-fold cross-validation test mode because it gives results more accurate than splitting data mode where the tested data and number of false alerts changes with changing of splitting data ratio. Our model achieves the lowest false alarm rate 0.01% and highest accuracy 99.99% and improves detection rate for all 5 classes that is better than the other models discussed in section 4 (related work). Where we survey the different models used to improve IDS performance. Dhakar [14] and golmah [15] models achieve the best accuracy. Although golmah used a customized data set with a fewer number of instances. His model has high false positive alerts. Dhakar also used splitting mode for testing data and achieved the best accuracy. As we show that splitting mode result changes with splitting ratio. So, we will compare our model with Dhakar model using 10 fold cross validation to be more accurate. We will test the models on clean data from remove duplicated phase and test data from pre-processing phase. For clean data set test, our model achieves better accuracy and lower false alert for all classes see fig 5 and fig 6. And achieve overall accuracy 99.95 % and false alerts 0.05% and Dhakar 99.88% accuracy and 0.12% false alerts.
Fig 5 TPR for all classes on clean data 99.94
99.95
99.92 99.93 99.94 99.95 99.96 99.97 99.98 99.99
randomforest multiclass classifier with random forest
C
orr
e
ct
ly
C
lass
ifi
e
d %
0.06
0.05
0.045 0.054 0.063
randomforest multiclass classifier with Random forest
FA
LS
E
A
LE
R
T
R
A
TE
16 13
22
4 19 40
19
35 36 43
0 10 20 30 40 50
NORMAL U2R R2L DOS PROBE
No
.
o
f F
al
se
Al
e
rts our
model
DHAKA R MODEL
99.98
77
97.87 100 99.54
99.93
60
97.1 99.99 98.76
50 60 70 80 90 100
NORMAL U2R R2L DOS PROBE
D
e
te
cti
o
n
R
ate
%
Our Model
DHAKAR MODEL
16 12 24 3
19 71
21 33
26 51
0 10 20 30 40 50 60 70 80
NORMAL U2R R2L DOS PROBE
No.of
Fal
se
A
le
rt
s
Our Model
Dhakar Model
10099.910099.9999.96100100100100100100
86
0 10 20 30 40 50 60 70 80 90 100
D
ete
cti
o
n
R
at
e %
Our Model Dhakar Model Fig 6 false alerts for all classes on clean data
For test data from pre-processing phase, our model also achieves the best detection rate and lowest false alert for all classes see fig 7 and fig 8 .and overall accuracy 99.99% and false alerts 0.01%.
Fig 7 TPR for all class on test data.
Fig 8 false alerts for all class on test data. Fig 7 and Fig 8 show that our model improves detection rate and reduces the false alerts for normal class and Dos class. Also, it improves detection rate for the U2R class which has the lowest representation of the data set to 77% better than other models 60%. Also, it improves R2L class and probe class although the lower number of instances in each class.
For origin 10% KDD Cup 99 data set with 23 classes.
It is important to study the performance of our model on original data set with 5 categories and- 23 classes. For normal category see fig 9 and fig 10.
Fig 9 true negative rate for 10% KDD Cup
Fig 10 false alert 10% KDD Cup 99
Fig 9 and Fig 10 show that our model enhances the detection accuracy and reduces false alerts for the normal class.
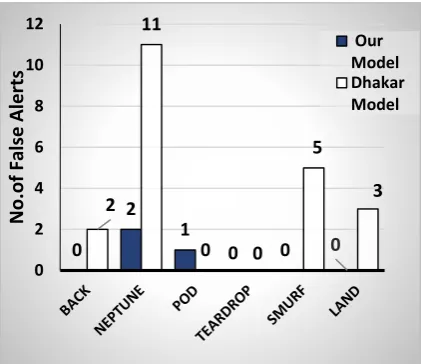
For DOS category that has 6 type of attack (back, Neptune, pod, teardrop, smurf, and land), See fig 11 and fig 12.
Fig 11 detection rate for attacks of DOS category.
99.99 99.97
99.9 100
Our Model Dhakar Model
co
rr
e
ctl
y c
lassi
fi
e
d
%
13
34
0 10 20 30 40
Our Model Dhakar Model
NO
. O
F FA
LS
E
A
LE
R
0 2
1
0 0 0
2 11
0 0
5
3
0 2 4 6 8 10 12
No
.o
f
Fa
lse
A
le
rts
Our Model Dhakar Model
99.2 99.52
97.4 99.4 98.3 98.8
92.2
98.7
90 91 92 93 94 95 96 97 98 99 100
SATAN PORTSWEEP NMAP IPSWEEP
Det
ect
io
n
Rat
e
%
Our Model
Dhakar Model
13
5 6 8
27
13 18 16
0 10 20 30
N
o
.
o
f F
al
se
al
e
rts Our
Model
Dhakar Model
96.2
37.5 66.67
75 75
14.3 99.1
0 92.5
0 58.3
0 60
0 99.3
0 0
10 20 30 40 50 60 70 80 90 100
D
e
te
ction
r
ate
%
Our Model
Dhakar Model
2 5
4
1
5 6
9
2 4
8
5 4
8
7 8
2
0 2 4 6 8 10
N
o
.
o
f F
al
se
A
le
rts
Our Model
Dhakar Model Fig 12 false alerts for attacks of DOS category.
DOS category has the highest representation in the data set. So, most classifiers achieve a good detection rate due to the good training for its attack. Fig 11 and Fig 12 show that our model completely enhances the accuracy for land attack with zero false alerts although it has the lowest number of instances. It completely detects 4 attack types (back, teardrop, smurf, land). That is better than Dhakar model who completely detects only two attacks (teardrop, pod). For probe category that have 4 types of attacks (Satan, Portsweep, Nmap, and Ipsweep), our mode enhances the accuracy total detection rate. For probe, see fig 13 and fig 14.
Fig 13 detection rate for attacks of probe category
Fig 14 false alerts for attacks of probe category.
Fig 13 and Fig 14 show that our model improves detection rate for all attacks although the lower representations of probe category. Especially for Nmap attack which has the lowest number of instances.
For the R2L category that has 8 types of attacks (guess_password, Ftp_write, Imap, Phf, Warezmaster, Multihop, Warezclient and spy).However, R2L category has a lower representation in the data set with a few number of instances for most of its attacks. Our model improves the detection rate for attacks and can detect 7 types of attacks where Dhakar can detect only 4 types see fig 15 and fig 16.
Fig 15 detection rate for attacks of R2L category.
Fig 16 false alerts for attacks of R2L category
80
22
0
67 83
0 0 0
0 20 40 60 80 100
D
e
te
ction
R
ate
%
Our Model
Dhakar Model
6 7
0 1
5 9
0
3
0 2 4 6 8 10
No
. o
f
F
al
se
Aler
ts Our Model
Dhakar Model percentage, Phf with 75% percentage and Multihop with 14.5 percentage) whereas Dhakar model fails to detect any of them.
For the U2R category, it has 4 types of attacks (Buffer_overflow, Loadmodule, rootkit, Perl). Our model improves the detection rate detecting new attacks that Dhakar model fails to detect see fig 17 and fig 18.
Fig 17 detection rate for attacks of U2R category.
Fig 18 False alerts for attacks of U2R category.
Fig 17 and 18 show that our model improves overall detection rate for U2R attack and can detect two new attacks (Loadmodule with 22% percentage and Perl with 67% percentage) whereas Dhakar model fails to detect them.
Experiment result shows that our proposed model achieves the best detection rate and lowest false alerts. Also, it detects 5 new attacks and completely detects 4 attacks. For a comparison with other models in related work section, see fig 19 and fig 20.
Fig 19 Comparison of accuracy for our model with other models.
Fig 20 Comparison between our model and other models false alert rate
99.1 99.3
99.6 99.71
99.96 99.96
99.99
99 99.1 99.2 99.3 99.4 99.5 99.6 99.7 99.8 99.9 100
Ac
cu
ar
cy
%
0.9
0.7
0.4
0.29
0.04 0.04 0.01 0
0.1 0.2 0.3 0.4 0.5 0.6 0.7 0.8 0.9
Fal
se
A
le
rts
R
ate
VIII- Conclusion
We proposed an enhanced model to improve the accuracy of IDS and eliminate the false alerts by choosing the best classifier. Our model improves detection rate for all classes especially for the U2R class which has the fewest representation in the data set. Also, it minimizes false positive alerts. Also, it completely prevents 4 types of attacks (back, teardrop, smurf, land) from DOS category. Moreover, it detects 3 new attacks (Ftp_write, Phf, and Multihop) from R2L attacks although the lower number of attacks instances. Furthermore, it detects 2 new attacks (Loadmodule and Perl) fromU2R category. Also, our model achieves the best overall accuracy 99.99% with lowest false alerts rate 0.01%.
References
[1] R. Bace, Intrusion detection. Sams Publishing, 2000. [2] R. Bace and P. Mell, “NIST special publication on
intrusion detection systems,” DTIC Document, 2001 [3] Wagh, SharmilaKishor, Vinod K. Pachghare, and Satish R.
Kolhe. "Survey on intrusion detection system using machine learning techniques." International Journal of Computer Applications 78.16 (2013).
[4] http://kdd.ics.uci.edu/databases/kddcup99/kddcup.names [5] KDD Cup 99 Data set:
http://kdd.ics.uci.edu/databases/kddcup99/kddcup99 [6] Mei-Ling Shyu, K. Sarinnapakorn, I.
Kuruppu-Appuhamilage, Shu-Ching Chen, LiWu Chang and T. Goldring, "Handling nominal features in anomaly intrusion detection problems," 15th International Workshop on Research Issues in Data Engineering: Stream Data Mining and Applications (RIDE-SDMA'05), 2005, pp.55-62. doi: 10.1109/RIDE.2005.10
[7] RausheenBal, Sangeeta Sharma "Review on Meta Classification Algorithms using WEKA". International Journal of Computer Trends and Technology (IJCTT) V35(1):38-47, May 2016. ISSN:2231-2803. www.ijcttjournal.org. Published by Seventh Sense Research Group.
[8] Fan, Rong-En, et al. "LIBLINEAR: A library for large linear classification." Journal of machine learning research 9.Aug (2008): 1871-1874.
[9] G. John and P. Langley, “Estimating continuous distributions in Bayesian classifiers,” Proc. Elev. Conf. …, pp. 338–345, 1995.
[10] Kshirsagar, Vivek, and Madhuri Joshi. "Enhancing Intrusion Detection System by Reducing the False Positives through Application of Various Data Mining Techniques." International Journal of Computer Science and Information Security 14.2 (2016): 76.
[11] Ali, Ghassan Ahmed. "Enhancing Intrusion Detection System (IDS) by Using Honeybee Concepts and Framework."
[12] Singhal, Pavan, and Gajendra Singh. "Enhanced Intrusion Detection System using Hybrid Machine Learning Approach." International Journal of Advanced Research in Computer Science and Electronics Engineering (IJARCSEE) 3.7 (2014): pp-384.
[13] Abdullah, Azween Bin, and Long Zheng Cai. "Improving Intrusion Detection using Genetic Linear Discriminant Analysis." International Journal of Intelligent Systems and Applications in Engineering 3.1 (2015): 34-39.
[14] Dhakar, Mradul, and Akhilesh Tiwari. "A novel data mining based hybrid intrusion detection framework." Journal of Information and Computing Science9.1 (2014): 037-048.
[15] Golmah, Vahid. "An efficient hybrid intrusion detection system based on C5. 0 and SVM." International Journal of Database Theory and Application 7.2 (2014): 59-70.
[16] Chen, Shi, et al. "A graphical feature generation approach for intrusion detection." MATEC Web of Conferences. Vol. 44. EDP Sciences, 2016.
[17] Gholipour Goodarzi, Bahareh, Hamid Jazayeri, and Soheil Fateri. "Intrusion Detection System in Computer Network Using Hybrid Algorithms (SVM and ABC)." Journal of Advances in Computer Research 5.4 (2014): 43-52. [18] Shawe, Rasha Thamer, and Safana H. Abbas. "Using An
Improved Data Reduction Method in Intrusion detection system." Using An Improved Data Reduction Method in Intrusion detection system 3.1 (2017).
[19] Kim, Kyung-min, et al. "Evaluation of ACA-based Intrusion Detection Systems for Unknown-attacks." Probe 41 (2016): 0-84.
[20] J. R. Quinlan, C4.5: Programs for Machine Learning, vol. 1. 1993, p. 302.