Pattern Recognition of IVF’s Early Embryo
Images Based on Support Vector Machines
and Texture Features
Li-Hui Wang#1, Zhi-Xiang Fu#1, Su-Zhe Ye#1, Da-Guan Ke*1 1
School of Biomedical Engineering & Wenzhou medical university & China Corresponding Author: Da-Guan Ke
Abstract
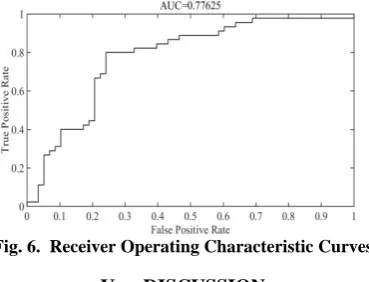
For the evaluation of the implantation potential of IVF early embryos, it is necessary to culture the in vitro cultured embryos to the cleavage stage with morphological characteristics. Shortening the culture time of embryos in vitro is important and difficult in IVF technology, because embryos with shorter developmental time do not have morphological features, and clinicians cannot evaluate embryo quality from embryonic images. The most basic feature that can be obtained from the embryo images is texture information. This study uses two features commonly used in texture features: Local Binary Pattern (LBP) and Gray Level Co-occurrence Matrix (GLCM) as indicators for evaluating the implantation potential of IVF early embryos. In this study, the early embryo images with a developmental duration of only 2 h are used. Support Vector Machines (SVM) are used for pattern recognition of embryo images. After finding the best feature combination by feature selection method, all data is divided into training set and test set. The training set is used to build the model, and the test set verifies the robustness of the model. The accuracy of the ten-fold cross-validation of all samples under the best feature combination is reaches 84.72%, the accuracy of the test set is reaches 77.67%, and the AUC value is 0.78.
Keywords — in vitro fertilization-embryo transfer, Pattern recognition, Neural Networks, SVM, Texture feature, LBP, GLCM.
I. INTRODUCTION
Research shows that infertility in recent years has shown a trend of increasing year by year, especially in Western countries, which has a huge impact on families and patients [1]. With the birth of in vitro fertilization-embryo transfer (IVF-ET), assisted reproductive technology (ART) has been widely used in the treatment of infertility, and has become the most effective method to treat infertility.
Embryo quality is an important factor in determining the success of IVF-ET. In order to improve the success rate of embryo implantation, it is necessary to evaluate the implantation potential of early embryos before transferring embryos into the
uterus. At present, the method of the evaluation is mainly through the morphological analysis of the D3-day cleavage embryo medical image [2], including cleavage rate, cell number of the cleavage embryo, degree of the embryo fragmentation, homogeneity of the cleavage embryos and whether it contains vacuoles, etc. [3] [4]. During the development of fertilized eggs into morphologically characterized cleavage embryo, many factors can influence the development of embryos. For example, there are differences between the environment of embryos cultured in vitro and the complex physiological environment of a human female uterus, and the influence of illumination brought by the micro-imaging instrument, etc. If the time of embryo cultured in vitro can be shortened, these adverse effects can be reduced.
However, embryos with short development time do not have morphological features and cannot assess their implantation potential. Therefore, it is possible to consider extracting texture features as a basis for their implantation. Texture feature is a visual feature that does not depend on color or brightness and reflects homogeneity in the image. It is an intrinsic property [5]. Texture analysis is an indispensable part of the field of computer vision and pattern recognition. Local Binary Pattern (LBP) and Gray Level Co-occurrence Matric (GLCM) are two common algorithms in the field of image pattern recognition [6] [7] [8], and both belong to statistical analysis methods in texture analysis. The advantage of GLCM algorithm is that it can reflect the spatial gray level of the image well. The LBP algorithm has a significant effect on classification, and has good application value in the field of medical image [9] and face recognition [10].
II. MATERIAL
of only 2h as experimental subjects. There are three types ofembryo images, which are implantation, non-implantation, and poor quality. Among them, the embryos with poor quality are often poorly developed or abnormal in morphology, and their development is not synchronized. It is considered that they are not transplantable from a clinical perspective. Therefore, all samples are divided into two categories: implantation (recorded as category 1) and non-implantation (recorded as category 0). The total number of samples is 206, of which 95 are in Category 1 and 111 are in category 0. The original size of images is 960*1280 pixels, as shown in fig. 1.
Fig. 1. Early embryonic images of IVF
III. METHOD
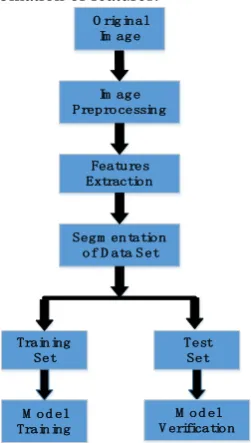
The main process of image pattern recognition is shown in fig. 2. All samples are randomly divided into training set and test set. The training set is used to build the model, and the test set is used to test the robustness of the model. When only the effective discrimination of the verification feature is considered, the means of all data cross-validation can also be employed. In this study, combined with feature selection method,all data are cross-validated to select the best combination of features.
O riginal Im age
Im age Preprocessing
Features Extraction
Segm entation of D ata Set
Training Set
Test Set
M od el Training
M od el V erification
Fig. 2. Flowchart of Image Pattern Recognition
A. Image Pre-processing
In the process of image pattern recognition, the images pre-processing step is important. The useless background generates redundant information, which
has an effect on the extraction of features. There is a large amount of useless background in the original image, it is necessary to remove the background and preserve the area of the embryo, even if part of the image information is lost. Removing the background will make the texture information more concentrated. The new format image pixel size is 511*511, as shown in fig. 3. Regarding whether the classification quality can be improved after removing the background, this study conducted a comparative experiment. In the process of experiment, we find that the classification effect of the new images is better than the original image. Therefore, we use the images without background as the input of the classification model.
background removal
Fig. 3. Original image cut out useless background
B. LBP feature extraction
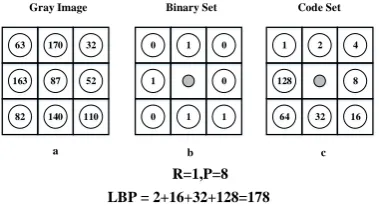
The LBP algorithm is originally proposed by T. Ojala et al. [11]. The core of the LBP algorithm is to set the gray value of the central pixel point as the threshold, and compare the gray value of the neighbourhood pixels point with this threshold: the pixel point whose gray value is greater than the threshold is set to 1, otherwise set to 0. After the thresholding operation, the LBP operator can be obtained:
1
( , ) 0
( ) 2
c c
P
p
L B P X Y p c
P
T S g g
(1)1( 0 ) ( )
0 ( 0 )
x S x
x
(2)
In the above formula, gc and gp respectively
represent the gray value of the central pixel point (Xc,Yc)and the neighbourhood pixel point P. Taking
63 170
87 32
163 52
140 110 82
0 1 0
1 0
1 1 0
1 2 4
128 8
32 16 64
Gray Image Binary Set Code Set
R=1,P=8 LBP = 2+16+32+128=178
a b c
Fig. 4. The calculation process of a square LBP operator with 8 neighbourhoods and 1 radius
The basic LBP operator has a fixed radius, so it can only cover a small range of pixel areas. What’s more, the basic LBP operator is powerless when faced with the textures of different sizes and frequencies.In order to meet the needs of more scales, T.Ojala improved the basic LBP algorithm [12], extended the 3*3 neighbourhood range to an arbitrary range, and replaced the square neighbourhood with a circular neighbourhood. The expanded algorithm can artificially set the radius and the neighbourhood properties
,
and can exist in multiple pixels point in the range of radius R.For example, when the radius R and the number of pixels point P take different values, the situation is shown in fig. 5 (a) - (d).R=1,P=4
a b
R=1.5,P=12
R=2,P=16 c
R=3,P=24 d
Fig. 5. The LBP operator under different values of R and P.
When the values of R and P are too small, the segmentation accuracy decreases, which affects the subsequent classification quality. However, when the values of R and P are too large, the number of binary modes increases sharply. For example, there are 2P binary modes for P pixels point in the neighbourhood with radius R, which will sparse the statistical histogram of LBP pattern. In order to solve this problem, T.Ojala et al. also proposed the LBP "equivalent mode". The equivalent mode can effectively reduce the dimension of the binary pattern. T.Ojala believes that most LBP operators contain up to two changes of 1→0 or 0→1. Therefore, the equivalent mode is defined as: when the cyclic binary number corresponding to a LBP operator jumps from 0 to 1 or from 1 to 0 at most twice, the corresponding binary pattern of the LBP operator can be considered
as an equivalent mode, such as “11111111”, “11111100”, “00111100”. The number of binary mode types is greatly reduced from the previous 2P to P* (P 1)2 under the equivalent mode.
When the image rotates, the value of LBP operator under the equivalent mode will change. Therefore, Pietikinen et al. extended the LBP operator and proposed an LBP operator with rotation invariance [13].That is, the circular neighbourhood is continuously rotated to obtain a series of initially defined LBP values, and the minimum value is taken as the LBP value of the neighbourhood. The rotation change not only makes the LBP operator have rotation invariance, but also plays a role in dimensionality reduction.
C. GLCM feature extraction
In 1973, Haralick et al. proposed the use of Gray Level Co-occurrence Matrices to describe texture features [14]. There is a grayscale relationship between two pixel points in an image at a certain distance, that is, spatial correlation characteristics. The basic idea of GLCM is to describe texture features by analysing the spatial correlation characteristics. The definition of GLCM is: if the size of an image is m*n, f( ,x y) represents the gray value at pixel point( ,x y), (x1,y1) and(x2,y2) are point pairs in the image with a distance d and an
angle , the gray values of two pixels are denoted respectively as f(x1,y1)i and f(x2,y2) j .
( , ; , )
P i j d is used to indicate the probability of the
similar pixels points appearing in the image. The mathematical expression is:
1 1 2 2 1 1
( , ; , ) # , , , , ( , ) ,
P i j d x y m n x y m n d f x y i
2 2
( , )
f x y j
Where # ( )x denotes the number of elements in
the setx. By changing d and , the pairs of pixels
point in different spatial positions can be counted. GLCM contains many kinds of texture features. In this study, four features are selected, namely Energy, Correlation, Contrast and Homogeneity. Their mathematical expressions are as follows:
2
, ( , )
i j
E n e r g y
P i j (3),
( ) ( ) ( , )
i j
i j
i i j j P i j
C o r r e la tio n
(4)2
, ( , )
i j
C o n tr a s t
i j P i j (5),
( , )
1
i j
P i j H o m o g e n e i t y
i j
(6)D. Support vector machine and K-fold cross validation
sample, nonlinear and high-dimensional classification problems [15]. Therefore, SVM plays an important role in machine learning and pattern recognition.This paper uses the LIBSVM toolbox [16] proposed by Lin et al. and the Radial Basis Function (RBF) is chosen for the kernel function type.
The K-fold Cross Validation (K-fold Cross Validation) method is used to find the appropriate SVM parameters, penalty parameter "c" and RBF width parameter "g". The sample data is divided into K subsets, each subset is used as training set to train the model, and the remaining subset is used as test set to test the recognition accuracy of the model. Continuously rotate the test set, and finally output the average of all test accuracy as the basis for selecting "c" and "g". The value of K is usually 10. In general,accuracy is not the only criterion, the smaller the "c" and "g", the more you can avoid the overfitting situation. Too small may also lead the problem of under fitting
,
which will also affect the generalization ability of the model.IV. RESULT
A. 10-fold cross validation results
In the process of using SVM for classification, in addition to selecting the appropriate SVM parameters, it is also important to screen out the valuable features. At the same time of 10-fold cross validation of feature data, the feature selection method can be used synchronously to find the best feature combination. In this paper, a sequential forward method with less computational complexity is used to select features. Sequential forward method is a bottom-up feature selection method.Its main idea is to select a feature from a feature set that has never been selected, so that when the chosen feature is combined with the selected feature, the classification accuracy can reach the maximum until the selected feature dimension reaches the pre-set value [17].
For the LBP features used in this study, we change the values of R and P, and extract rotationally invariant features separately under different values of R and P. The value of R ranges from 1 to 5, and the value of P ranges from 4 to 16. On the other hand, the GLCM features selected in this study are as follows:
1. Energy of GLCM feature with of 0, 45, 90, 135, d=1
2. Correlation of GLCM feature with of 0, 45, 90, 135, d =1
3. Contrast of GLCM feature with of 0, 45, 90, 135, d=1
4. Homogeneity of GLCM feature with of 0, 45, 90, 135, d=1
For the LBP features, we record several combinations of features and results with the high accuracy of 10-fold cross-validation in the case of different values of R and P. After the features screening, the accuracy of 10-fold cross-validation is up to 84.72%, the best features combination and SVM
parameters are shown in Table 1; Similarly, several best results under the GLCM features are also recorded, as shown in Table 2, the accuracy of 10-fold cross-validation is up to 65.05%. Finally, we combine the LBP features with the GLCM features for better results and record several best results as shown in Table 3, the best accuracy reaches 73.79%.
10-FOLD CROSS-VALIDATION RESULT of LBP FEATURES
Parameters of the
features Accuracy
R=4,P=12,rotationally
invariant features 84.72% R=4,P=19,rotationally
invariant features 76.69% R=4,P=16,rotationally
invariant features 75.73% R=4,P=9, no rotation
features 65.53%
Table 1
10-FOLD CROSS-VALIDATION RESULT of GLCM FEATURES
Parameters of the
features Accuracy
Contrast 64.07%
Correlation 63.21%
Energy 65.05%
Homogeneity 61.17%
Contrast+ Correlation
+ Energy+ Homogeneity 59.71%
Table 2
10-FOLD CROSS-VALIDATION RESULT of LBP FEATURES COMBINED WITH GLCM FEATURES
Parameters of
the features Accuracy
R=4,P=12,rotationally invariant
features with Contrast feature 72.64% R=4,P=12,rotationally invariant
features with Correlation feature 73.79% R=4,P=12,rotationally invariant
features with Energy feature 70.39% R=4,P=12,rotationally invariant
features with Homogeneity feature 72.82%
Table 3
B. Test set accuracy
Fig. 6. Receiver Operating Characteristic Curves
V. DISCUSSION
It can be seen from the Table 1 that the LBP features have a good classification effect, and the SVM parameters “c” and “g” do not make the model overfitting. Comparing the results of Table 1 and Table 2, it can be concluded that the classification quality of the LBP features is better than the GLCM features. From the results in Table 3, the classification effect of the model is worse after the combination of LBP and GLCM features, perhaps because the interaction between the two types of texture features is offset.
It can be concluded that the LBP feature and the GLCM feature can be used as indicators for evaluating the implantation potential of the embryo, and the evaluation model established by the texture feature also has a good effect in the prediction, which is incomparable by other features including the morphological feature.However, it is still too early to apply this method directly to the clinic because there is some contingency in dividing the test set and the training set. In future studies, texture features can also be applied to embryo images at different developmental stages. It is possible to establish a characteristics spectrum of implantation potential.By querying the features spectrum, we can learn which texture features the early embryo image should correspond to. If the implantation potential of the embryo can be assessed earlier, it can reduce the cost of the embryo cultivation and reduce the cultivation time, which has a positive significance for patients.
REFERENCES
[1] Lu X, Wu Z, Wang M, et al. Effects of vitamin C on the outcome of in vitro fertilization–embryo transfer in endometriosis: A randomized controlled study [J]. Journal of International Medical Research, 2018:030006051878691. [2] Kirstine K, Aishling A, Hans Jakob I, et al. Choosing the
best embryo by time lapse versus standard morphology [J]. Fertility & Sterility, 2015, 103(2):323-332.
[3] Guerif F, Le G A, Giraudeau B, et al. Limited value of morphological assessment at days 1 and 2 to predict blastocyst development potential: a prospective study based on 4042 embryos. [J]. Human Reproduction, 2007, 22(7):1973-81.
[4] Tesarik J, Greco E. The probability of abnormal preimplantation development can be predicted by a single static observation on pronuclear stage morphology. [J]. Human Reproduction, 1999, 14(5):1318-23.
[5] Hao L, Yongquan Y, Xiancao G, et al. Improved LBP used for texture feature extraction [J]. Computer Engineering & Applications, 2014.
[6] Ahonen T, Hadid A, Pietikainen M. Face Description with Local Binary Patterns: Application to Face Recognition [J]. IEEE Transactions on Pattern Analysis and Machine Intelligence, 2006, 28(12):2037-2041.
[7] Tan X, Triggs B. Enhanced Local Texture Feature Sets for Face Recognition Under Difficult Lighting Conditions [J]. Amfg, 2007, 4778(6):1635-1650.
[8] Leenkiat Soh C T. Texture Analysis of SAR Sea Ice Imagery using Gray Level Co-occurrence Matrices [J]. IEEE Transactions on Geoscience & Remote Sensing, 1999, 37(2):780-795.
[9] Çamlica Z, Tizhoosh H R, Khalvati F. Medical Image Classification via SVM Using LBP Features from Saliency-Based Folded Data [J]. 2015:128-132.
[10] Jung J Y, Kim S W, Yoo C H, et al. LBP-ferns-based feature extraction for robust facial recognition[J]. IEEE Transactions on Consumer Electronics, 2017, 62(4):446-453. [11] Ojala T, Pietik?Inen M , Harwood D . A comparative study
of texture measures with classification based on featured distributions [J]. Pattern Recognition: The Journal of the Pattern Recognition Society, 1996, 29(1):51-59.
[12] Ozdek S, Lonneville Y H, Onol M, et al. Assessment of nerve fiber layer in diabetic patients with scanning laser polarimetry. [J]. Eye, 2002, 16(6):761-765.
[13] Ojala T, Pietikäinen M, Mäenpää T. Multiresolution
Gray-Scale and Rotation Invariant Texture
Classification with Local Binary Patterns [J]. IEEE Transactions on Pattern Analysis & Machine Intelligence, 2000, 24(7):971-987.
[14] Haralick R, Shanmugam K, Dinstein I, et al. Texture features for image classification [J]. IEEE Trans Smc, 1973, 3(6):610-621.
[15] Hengnian Q I. Support Vector Machines and Application Research Overview [J]. Computer Engineering, 2004. [16] Chang C C, Lin C J. LIBSVM: A library for support vector
machines [J]. 2011, 2(3):1-27.