O R I G I N A L A R T I C L E
Y u t a k a I s h i m a r u 9 K a t s u h i t o O s h i m a 9 I k u h o I i d a
Changes in the mechanical properties of wood during a period of
moisture conditioning
Received: March 24, 2000 / Accepted: May 22, 2000
A b s t r a c t Changes in the modulus of elasticity (MOE), modulus of rupture (MOR), and stress relaxation in the radial direction of wood (hinoki:
Chamaecyparis obtusa)
moisture-conditioned by the adsorption process from a dry state and by the desorption process from a moisture content slightly below the fiber saturation point were investigated. The M O E and M O R of wood conditioned by the adsorp- tion process showed significant increases during the later stages of conditioning when the moisture content scarcely changed. However, with the desorption process they did not increase as much during later stages of conditioning, though they increased during early stages of conditioning when the moisture content greatly decreased. The stress relaxation of wood decreased with an increase in the conditioning period with both the adsorption and desorption processes. These results suggest that wood in an unstable state, caused by the existing state of moisture differed from that in a true equi- librium state shows lower elasticity and strength and higher fluidity than wood in a true equilibrium state. Furthermore, the present study demonstrates that the unstable states of wood induced during the course of drying, desorption, and possibly adsorption of moisture are slowly modified as wood approaches a true equilibrium state.Key words Moisture-conditioned wood 9 Modulus of elas- ticity - Modulus of rupture - Stress relaxation
uids showed higher elasticity and strength as the wood ap- proached the swelling equilibrium, and it showed lower fluidity than wood swollen in water to the same degree. However, if the wood was far from the swelling equilibrium, it showed lower elasticity and strength and a higher fluidity than wood swollen in water to the same degree)
These results are interpreted to suggest that the me- chanical properties of wood in an unstable state during the process of approaching a true equilibrium state differ from those of wood in an equilibrium state; in other words, such wood shows lower elasticity and strength and higher fluidity than that in a true swelling equilibrium. Furthermore, it was previously found that the moisture content of wood condi- tioned by adsorption and desorption changed continuously during a moisture-conditioning period of over 50 weeks) In light of this result, the sorption hysteresis of wood is thought to be a phenomenon that occurs during a transitional process as wood approaches the true sorption equilibrium.
There seem to be no systematic studies in which the mechanical properties of wood were investigated in terms of an unstable state of wood. Hence, this study aimed to clarify some of the mechanical properties of wood in un- stable states approaching the sorption equilibrium. It was achieved by examining the elastic, strength, and viscoelastic properties of wood during the moisture-conditioning pro- cess of adsorption and desorption of moisture.
Introduction
Recently, it has been observed that the dynamic modulus of elasticity of water-saturated wood with a drying history in- creased with increased time left in water for more than a month. 1 In addition, the wood swollen in some organic liq- Y. Ishimaru ( ~ ) 9 K. Oshima 9 I. Iida
Laboratory of Wood Technology, Faculty of Agriculture, Kyoto Prefectural University, Shimogamo Nakaragi-cho, Kyoto 606-8522, Japan
Tel. +81-75-703-5639; Fax +81-75-703-5639 e-mail: ishimaru@kpu.ac.jp
Materials and methods
Wood samples
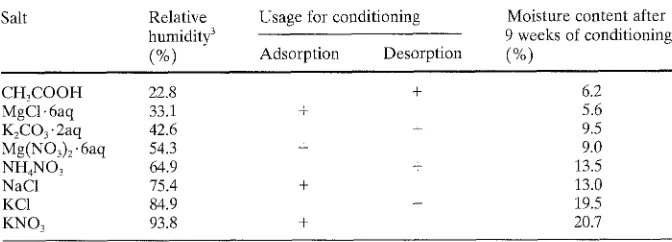
Table 1. Saturated salt solutions used for moisture conditioning Salt Relative Usage for conditioning
humidity 3
(%) Adsorption Desorption
Moisture content after 9 weeks of conditioning
(%)
CH3COOH 22.8 +
MgC1.6aq 33.1 +
K2CO ~ 9 2aq 42.6 +
M g ( N O 3 ) 2 9 6 a q 54.3 +
N H 4 N O 3 64.9 +
NaC1 75.4 +
KCI 84.9 +
KNO 3 93.8 +
6.2 5.6 9.5 9.0 13.5 13.0 19.5 20.7 aq, water
255
tral part in the radial direction, and then a loading point was placed on the marked position for measuring the mechani- cal properties of the samples during bending. Approxi- mately 100 cross-sectional wood samples with a thickness of 4ram in the longitudinal direction were successively cut from each wood stick. There were 280 wood samples in all obtained from each of the three wood sticks, and they were divided into 40 groups (moisture conditioning at eight rela- tive humidities and conditioning for five periods) of seven pieces each (Table 1).
Pretreatment of the wood samples
It has been observed that the mechanical properties of wood are affected by previous drying. 4 In this study, all wood samples were pretreated in the following manner to modify the effects of the previous drying. First, the samples were vacuum-dried for at least 1 week; they then were soaked in water under a vacuum and left for 1 week in water. After this period, the samples were dried for several days in a room at a constant temperature of 20~ and rela- tive humidity (RH) of 60%; they were then placed in a desiccator containing a saturated aqueous solution of cal- cium sulfate dihydrate (98% RHS). They were left in the desiccator for 1 week to modify the effect of liquid tension, which originates during the desorption of moisture from the water-saturated state 3 and which affects the mechanical properties of wood. Then the samples were vacuum-dried again in a desiccator containing diphosphorus pentaoxide for at least 1 week, followed by oven-drying at 105~ for 15 h. After these processes, each wood sample was placed in a polyethylene bag of known weight, and the bags were sealed with zippers. After cooling the samples in a desicca- tor containing dry calcium chloride, the samples were weighed with the bags.
Moisture conditioning
For moisture conditioning during the adsorption process from the dry state, each dried sample was placed separately in a different desiccator containing a saturated aqueous solution of one of the salts listed in Table 1. In regard to moisture conditioning during the desorption process, it was
observed that the wood samples that began in a water- saturated state showed lower elasticity and diminished strength due to liquid tension compared with those that began with a moisture content below the fiber saturation state, as described above. Therefore, in the present study moisture conditioning during the desorption process from a moisture content below the fiber saturation point was adopted. That is, the samples were conditioned once their moisture content was about 25% in a desiccator containing a saturated aqueous solution of calcium sulfate dihydrate. Each sample was then placed separately in a different des- iccator containing a saturated aqueous solution of one of the salts listed in Table 1. The desiccators were then placed in a room stabilized at 20~ for predetermined periods.
Grouping of the wood samples
Various properties of wood are judged to be most alike along the longitudinal direction, depending on the arrange- ment of wood tissues. The present study aimed to obtain some information about the dependence of mechanical properties of wood during moisture-conditioning periods and about the difference between wood moisture condi- tioned by the adsorption and desorption processes. Ac- cordingly, the successive wood samples were divided into moisture-conditioning groups as shown in Table 2. For ex- ample, seven pieces were selected, one by one, for 10 turns. Five samples from each moisture-conditioning group were used to measure the modulus of elasticity (MOE) and the modulus of rupture (MOR), and two samples were used to measure stress relaxation.
Measurement of mechanical properties
Table 2. Example of the division of successive wood samples for testing
Test Adsorption in 33.1% RH at 1 to 9 weeks
1 2 3 4 9
Desorption in 22.8% RH at 1 to 9 weeks
1 2 3 4 9
Static bending 102 103 104 105 106
112 113 114 115 116 122 123 124 125 126 132 133 134 135 136 142 143 144 145 146 Stress relaxation
2 hours 152 153 154 155 15 hours 162 163 164 165
107 108 109 110 111
117 118 119 120 121
127 128 129 130 131
137 138 139 140 141
147 148 149 150 151
156 157 158 159 160 161
166 167 168 169 170 171
See text for explanation of the table
The tests were discontinued when the samples had bro- ken down completely. Immediately after the test the wood samples were unsealed, and their width and thickness and the weight of the polyethylene films were measured. The M O E and M O R were calculated using the conventional method, which employs the obtained stress-strain diagrams and dimensional data. The moisture contents of the samples were also determined from the weights of the samples in a dried state and after moisture conditioning.
In the case of the stress relaxation test, movement of the cross-head stopped when the samples were deflected by 1.2mm. This deflection corresponded to one-third of the breaking load of the samples conditioned in the highest relative humidity. Stress relaxations were then measured for 2 or 15 h. After the test, the samples conditioned for 3 and 4 weeks were again placed in the same desiccator and left for 5-6 weeks in a sealed state to avoid changes in moisture content. After these periods, the samples were subjected to a second measurement of stress relaxation. After this stress relaxation test, all the wood samples were unsealed, and their widths and thicknesses and weights of the polyethylene films were measured. The relaxation moduli during various relaxation periods were calculated by the load recorded on a chart and the dimensional data. The moisture contents of the samples were also determined as described above.
Results and discussion
Modulus of elasticity and modulus of rupture
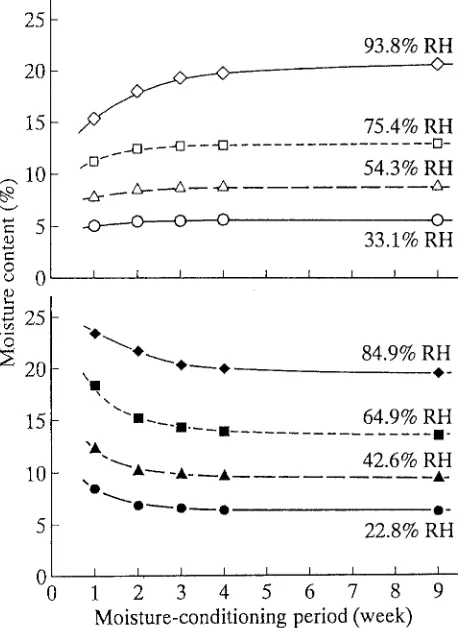
The changes in moisture content of the samples moisture conditioned by the adsorption and desorption processes during the conditioning period are shown in Fig. 1. The moisture content increased the longer the conditioning pe- riod lasted during the adsorption process, and it decreased during the desorption process. These moisture content changes were greater in the samples conditioned at a higher relative humidity during both processes for the conditioning period examined. Changes in the moisture content of the samples from 4 to 9 weeks of the conditioning period was 0.9% in the maximum case conditioned during the adsorp- tion process at 93.8% RH, 0.5% during the desorption pro-
25
20
15
10
5 9
0
25 9
20
15
10
5
0 0
93.8% RH O--
75.4% RH
. . C ] - - 4 J - - - E ] . . . D -
"rn~ 54.3% RH
_s ~ &._ _.-&-- -d- &-
_o---o
o
o
o--
33.1% RH
I I ! I I [ I P I
" * ~ * ~
84.9% RH
\l,
" ' s - _ 64.9% RH
" i - - - - - l " - . . . . l "
" " 42.6% RH
~ , L ~ - A - ~ A .A-
" 0 ~ 0 - ' - - 0 ~ 9 O - 22.8% RH
I I. I I I ~ I I 1
1 2 3 4 5 6 7 8 9
Moisture-conditioning period (week)
Fig. 1. Changes in the moisture content of wood moisture-conditioned at various relative humidities (RH) during the adsorption (top) and desorption (bottom) processes with conditioning
cess at 84.9% RH, and less than 0.2% for the other cases. As these results show, changes in the moisture content from 4 to 9 weeks were small.
1200
lOOO
9 8O0
600 18 16
8 ,%'14 ~ 1 2 O
10
6
33.1% R H 1400
[ ] 1week [ ] 3weeks [ ] 9weeks [ ] 2 weeks [ ] 4 weeks
54.3% R H Z x , ~ Z,x,N ~ x , N ~ x N ~ x , N 7, XN
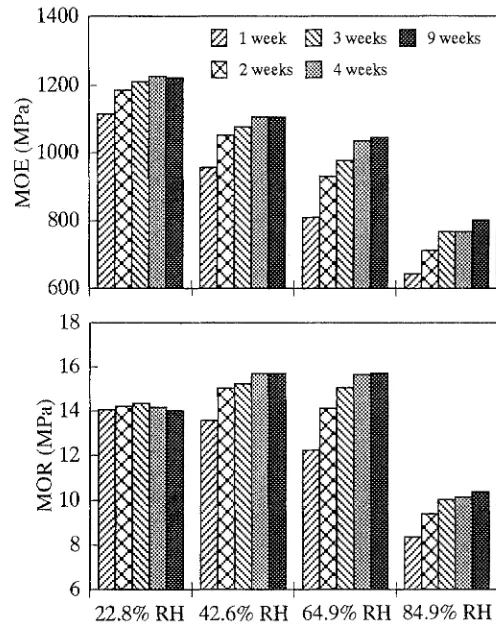
75.4% R H 93.8% R H Fig. 2. Change in the modulus of elasticity (MOE) and modulus of rupture (MOR) of the wood moisture-conditioned at various relative humidities during the adsorption process with conditioning
1400
257
1200
1000 0
8O0
600 18
[ ] 1week [ ] 3weeks [ ] 9weeks [ ] 2weeks [ ] 4weeks
16 2 1 4
g12
nr{lO
I I t
22.8% R H 42.6% R H 64.9% RH 84.9% R H Fig. 3. Change in MOE and MOR of the wood moisture-conditioned at various relative humidities during the desorption process with conditioning
It has previously been found that the M O E of wood moisture-conditioned by adsorption reached a plateau with a relatively low moisture content and then decreased almost linearly with an increase in moisture content; furthermore, the M O R of wood similarly conditioned reached a maxi- m u m at around 7 % - 8 % of the moisture content and then also decreased with increasing moisture content. 6 Similar trends are shown in Fig. 2; that is, the M O E decreased with an increase in RH, and the M O R reached a maximum at 54.3% R H ( 8 % - 9 % moisture content) and then decreased with an increase in RH. Therefore, considering the changes in moisture content during the conditioning period as shown in Fig. 1, the decreases in M O E and M O R during the early stages of moisture conditioning in relatively high R H can be mainly attributed to increases in the moisture con- tent. However, for the M O R of wood conditioned at 33.1% R H ( 5 % - 6 % moisture content) and 54.3% RH, this expla- nation cannot apply because the M O R would be expected to increase at 33.1% R H and not to change so much at 54.3% R H during conditioning, considering the depen- dence of the M O R on moisture content as described above. Therefore, the fact that the M O R reached a minimum dur- ing the early stages of conditioning at relatively low R H suggest that the wood distant from a true adsorption equi- librium results in a lower MOR; this result is similar to the well-known phenomenon that wood in a state of nonequilibrium with respect to moisture shows a higher
degree of fluidity than wood in the equilibrium state] In any event, it is notable that the M O E and M O R increased de- spite slight increases in the moisture content during the later stage of conditioning.
Figure 3 shows the changes in the M O E and M O R dur- ing the conditioning period for wood moisture-conditioned during the desorption process. Both M O E and M O R showed extensive increases during the early stages of moisture-conditioning, and then the increases diminished throughout the duration of the conditioning period, except in the case of wood conditioned in 22.8% RH, where the M O R reached a maximum and then decreased. However, both the M O E and M O R of wood conditioned at 84.9% R H showed significant increases between 4 and 9 weeks.
ity and strength and more fluidity than wood swollen in water to the same degree. These findings suggest that wood in an unstable state approaching a true equilibrium state has less elasticity and strength and greater fluidity than wood in a swelling equilibrium state]
From the above-mentioned viewpoint, the results shown in Fig. 2 (that is, the significant increases in M O E and M O R during the later stage of the adsorption process where the moisture content scarcely increased) can be interpreted as a phenomenon that occurs during a stabilizing process, such as the reorientation of molecular chains of wood constitu- ents toward a true swelling equilibrium by adsorption of moisture. On the other hand, the results of the desorption process shown in Fig. 3 (that is, only a slight increase or even a slight decrease in M O E and M O R during the later
stage of conditioning, except conditioning at the highest RH) is notable, because they suggest that the stabilization caused by reorientation of molecular chains, for instance, is more difficult during the desorption process than during the adsorption process or that in an unstable state such disorder of the molecular chains is also induced during the latest stage of the desorption of moisture.
Changes in stress relaxation during the moisture- conditioning period
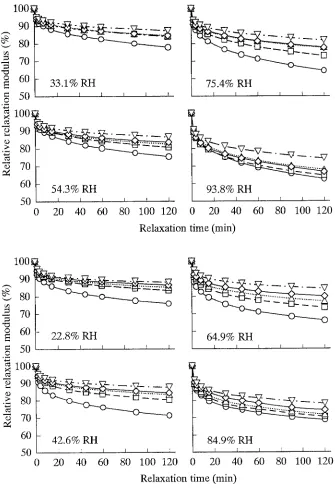
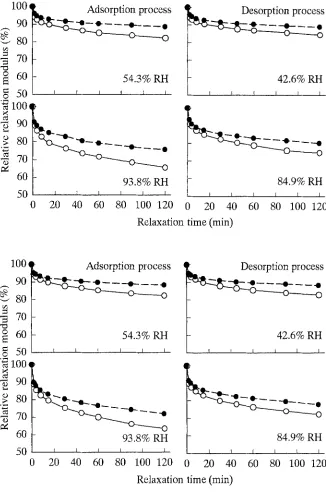
Figures 4 and 5 show changes in the relative relaxation modulus (relative to the modulus at the beginning of the test) as a function of the relaxation period of the wood
Fig. 4. Stress relaxation behavior of wood moisture-conditioned at various relative hu- midities for various periods during the ad- sorption process. Circles, conditioned 1 week;
squares, 2 weeks; triangles, 3 weeks; dia- monds, 4 weeks; inverted triangles, 9 weeks
1 0 0 9O ~" 80 --, 70 o 60 : 50 o
100] 90
O > 80 -~ 70 60 50
0
33.1% R H
I 1 I I [ I
54.3% RH
I I I I
20 40 60 80
75.4% RH
I I I I t
" • " ' "
"V"~..V.. ~ ' V ~ " ---V - - .93.8% RH
I I 1 t I I I
100 120 0 20 40 60 80 100 120 Relaxation time (min)
Fig. 5. Stress relaxation behavior of wood moisture-conditioned at various relative hu- midities for various periods during the des- orption process. See Fig. 4 for explanation of symbols
100I 90 80 70 o 60 : 50 9
100 9o O .~ 80 -d 7O 60 50 0
22.8% R H I I I
[
64.9% RH
I 1 I I I I I !
!
84.9% RH
I I r F I [ I [
100 120 0 20 40 60 80 100 120 Relaxation time (min)
42.6% R H
r [ I I
901
80
70 9
o 60 .,.-~
90 9 >
80
70
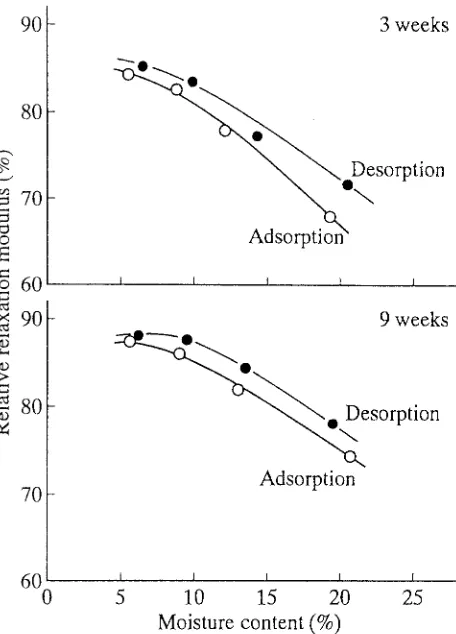
3 w e e k s
:
sorption
Adsorpiion"
i I I I I
9 weeks
Desorption
Adsorption
I
~ q f ] l I I I I I
0 5 10 15 20 25
Moisture content (%)
Fig. 6. Relation between the relaxation modulus 120rain after begin- ning the test and the moisture content. Wood samples were moisture- conditioned for 3 weeks (top) and 9 weeks (bottom)
moisture-conditioned by adsorption and desorption. The relaxation moduli of wood in both processes at all R H s tended to increase throughout the conditioning period de- spite increases in the moisture content of the wood during the adsorption process and decreases during the desorp- tion process. This means that the fluidity of moisture- conditioned wood decreases throughout the conditioning period of both the adsorption and desorption processes.
Incidentally, it has previously been observed that the creep compliance of wood reaches a minimum at 10%-14% of the moisture content and then decreases with increasing moisture content) However, that study reported that, at most, a 3 % change in moisture content occurred; therefore, this result cannot be used when discussing the present results.
The moisture content dependence of the relative relax- ation modulus at 120min after the beginning of the test of wood conditioned for 3 and 9 weeks by the adsorption and desorption processes is shown in Fig. 6. At any point during the moisture conditioning, decreases in the relative relax- ation moduli were observed with an increase in moisture content, though the increases were smaller in the lower moisture content range. Accordingly, it is clear that the fluidity of wood increases with an increase in the moisture content within the limits of the moisture contents examined. This result accounts for the decreases in the fluidity of wood
259 during the early stages of conditioning at any R H in the desorption process shown in Fig, 5 because the moisture contents decreased as the conditioning period progressed in these cases. It is not clear why the relative relaxation modu- lus increased between 4 and 9 weeks in the desorption process despite minimal decreases in moisture contents, or why the relaxation modulus during the adsorption process also increased despite increases in moisture content.
Comparison between stress relaxation for first and second measurements in the same wood sample
The results shown in Figs. 4 and 5 were obtained as averages from two wood samples conditioned separately; therefore, they may have been affected by variations among samples caused by their sampling positions. Moreover, because the results obtained from different samples conditioned for dif- ferent periods were compared, they were also affected by the difference in moisture content based on the difference in conditioning periods. Hence, the stress relaxations were again measured 5-6 weeks after the first measurement using the same samples that had been conditioned for 3 and 4 weeks at the time of the first measurement. The moisture contents of these samples did not change, except in the case of the experimental error, because the samples were main- tained in a sealed state and placed in the same desiccator in which the samples had been conditioned before the first measurement.
Figure 7 shows a comparison between the first and second measurements of the relative relaxation modulus of the samples conditioned for 4 weeks in 54.3% R H and 93.8% R H by the adsorption process and in 42.6% R H and 84.9% R H by the desorption process. The samples were loaded on the same side for the first and second measure- ments. The relaxation moduli obtained at the second mea- surement were distinctly larger than those for the first measurement in all cases. This means that fluidity of the wood conditioned by both adsorption and desorption de- creases with the passage of time, even if the moisture con- tent does not change.
This result may have been affected by loading history or memory effect 9 based on the first measurement, though the samples were left in the desiccator 5-6 weeks after the first measurement. To examine this effect, the relaxation moduli of the samples that had been measured after 3 weeks of moisture conditioning were measured again by loading in the side opposite to that used for the first measurement. The results are shown in Fig. 8. The relaxations at the second measurements were also distinctly less than those at the first measurements. These results indicate that the memory ef- fects can be disregarded when the samples are left for 5-6 weeks after the first measurement. Accordingly, these re- sults confirm that the fluidity of wood decreases with time, even if the moisture content does not change.
Fig. 7. Comparison of the first and second 1001 measurements of stress relaxation of wood
moisture-conditioned by adsorption (left) and 90
desorption (right). The first measurement was
of a wood sample conditioned for 4 weeks, ~ 80
and the second measurement was of the same
sample about 5 weeks after the first measure- ~ 70
ment. The sample was loaded in the same di- "~
rection for the first and second measurements. ~ 60
Open symbols, first measurement; solid sym- = 50
bols, second measurement O
'~ 100,
"-~ 90
80
70
60
50
A d s o r p t i o n p r o c e s s
5 4 . 3 % R H
I I I I 1 i
k . _ _ D e s o r p t i o n p r o c e s s
- ~ , , O . ~ ~ ~ ~ O
4 2 . 6 % R H
I t I I F I
9 3 . 8 % R H 8 4 . 9 % R H
I l I I I I I I I i I i
20 40 60 80 100 120 0 20 40 60 80 100 120
R e l a x a t i o n t i m e ( m i n )
Fig. 8. Comparison of the first and second measurements of stress relaxation of wood moisture-conditioned by adsorption (left) and desorption (right). The first measurement was of a wood sample conditioned for 3 weeks, and the second measurement was of the same sample about 6 weeks after the first measure- ment. The sample was loaded in opposite directions for the first and second measure-
ments. Open symbols, first measurement; solid
symbols, second measurement
lOOq
90
--- 80
70
z 60
= 50
9
100 I
90
~. 80
"70
60
50
A d s o r p t i o n p r o c e s s
i I I
5 4 . 3 % R H
I .I I
D e s o r p t i o n p r o c e s s
4 2 . 6 % R H
9 3 . 8 % R H
I I I I I B
0 20 40 60 80 100 120
8 4 . 9 % R H
I I I I I I
0 20 40 60 80 100 120
Relaxation time (min)
t r a n s i t i o n a l state a p p r o a c h i n g true e q u i l i b r i u m ) F u r t h e r - more, as d e s c r i b e d above, it has also b e e n f o u n d that the elasticity o f w o o d in a w a t e r - s a t u r a t e d state increases with i n c r e a s e d t i m e left in w a t e r ) T h e a u t h o r s i n t e r p r e t e d these results as a p h e n o m e n o n that occurs during the course of modifications of an u n s t a b l e state distant f r o m a true equi- librium s t a t e ]
F r o m this p o i n t of view, d e c r e a s e s in fluidity with in- creases in the m o i s t u r e - c o n d i t i o n i n g p e r i o d during the ad- s o r p t i o n and d e s o r p t i o n processes o b s e r v e d in the p r e s e n t study can also b e i n t e r p r e t e d as a p h e n o m e n o n t h a t occurs during modification of an u n s t a b l e state caused by the exist- ing state of m o i s t u r e , differing f r o m that in t r u e equilibrium. T h e results o b t a i n e d in the p r e s e n t study suggest that such an u n s t a b l e state affects fluidity m o r e extensively t h a n the
elasticity and strength of wood, considering the M O E , M O R , and stress r e l a x a t i o n results.
Incidentally, it has long b e e n e s t a b l i s h e d that fluidity of w o o d increases extensively in a n o n e q u i l i b r i u m state of m o i s t u r e , and that such increases in the fluidity occur during the course of changes in m o i s t u r e c o n t e n t or swelling. 1~ T h e p r e s e n t study clearly indicates t h a t a similar increase in fluidity occurs during m o i s t u r e - c o n d i t i o n i n g stages, even if the m o i s t u r e c o n t e n t of the w o o d d o e s not change. T h e n o n e q u i l i b r i u m state of m o i s t u r e can b e r e g a r d e d as a highly u n s t a b l e state for wood. A c c o r - dingly, the results in the p r e s e n t study s h o u l d b e con- s i d e r e d for b e t t e r u n d e r s t a n d i n g the a b n o r m a l m e c h a n i c a l
b e h a v i o r of w o o d in a n o n e q u i l i b r i u m state of
Difference in fluidity of w o o d moisture-conditioned by adsorption and desorption processes
The stress relaxations of w o o d moisture-conditioned by the adsorption and desorption processes can be c o m p a r e d in Fig. 6. W o o d conditioned by adsorption showed greater relaxation (i.e., greater fluidity) than w o o d conditioned by desorption regardless of the conditioning period and R H . Considering the characteristics of the unstable state as de- scribed above, this result can be interpreted to m e a n that w o o d moisture-conditioned by adsorption is m o r e unstable than that conditioned by desorption. This interpretation is reasonable and can be explained as follows: because trees live in a state swollen by water, the swollen state is the most stable state for wood. During the process of drying, a highly unstable state is induced. Such an unstable state is not easily modified by adsorption of moisture. Accordingly, wood moisture-conditioned by the adsorption process remains in a m o r e unstable state than w o o d conditioned by the desorp- tion process to the same moisture content.
Conclusions
The elasticity and strength of w o o d moisture-conditioned by the adsorption process increase significantly during the later stages of conditioning, though the moisture content of the w o o d scarcely changes. During the desorption process these properties did not increase as m u c h in the later stages of conditioning, though they increased during the early stages of conditioning when the moisture content markedly decreased. The stress relaxation of w o o d decreased with an increase in the conditioning period, regardless of the ad- sorption and desorption processes. T h e stress relaxations of w o o d with a similar moisture content were greater with the adsorption process than with the desorption process. These
behaviors were interpreted to be the result of an unstable state caused by the existing state of moisture different from that in a true equilibrium state or by modifications of such an unstable state. T h e present study demonstrates that the unstable states of w o o d induced during the course of drying, desorption, and possibly adsorption of moisture are slowly modified as w o o d approaches a true equilibrium state, and that such an unstable state affects the fluidity m o r e exten- sively than the elasticity and strength of wood.
References
1. Furuta Y, Norimoto M, Yano H (1998) Thermal-softening proper- ties of water-swollen wood. V. The effect of drying and heating histories (in Japanese). Mokuzai Gakkaishi 44:82-88
2. Ishimaru Y, Narimoto S, lida I (2001) Mechanical properties of wood swollen in organic liquids with two or more functional groupes for hydrogen bonding in a molecule. J Wood Sci 47:171- 177
3. Ishimaru Y, Arai K, Mizutani M, Oshima K, Iida I (2001) Physical and mechanical properties of wood after moisture conditioning. J Wood Sci 47:185-19I
4. Furuta Y, Yano H, Kajita H (1995) Thermal-softening properties of water-swollen wood. I. The effect of drying history (in Japa- nese). Mokuzai Gakkaishi 41:718-721
5. Miyabe H (ed) (1968) In: Japan Society of Polymer Science: hand book of material and moisture [Zairyo to Mizu Handbook]* (in Japanese). Kyoritu Shuppan, Tokyo, pp 240-262
6. Ishimaru Y, Minase T (1992) Mechanical properties of wood in various stages of swelling. I. Mechanical and swelling behavior of wood swollen in various organic liquids (in Japanese). Mokuzai
Gakkaishi 38:550-555
7. Tokumoto M (1994) Creep and set of wood in the non-equilibrium states of moisture (in Japanese). Mokuzai Gakkaishi 40:1157-1164 8. Suzuki M, Nakato K, Aikawa K (1965) Frequency dependence of dynamic Young's modulus of wood and its retation to creep (in Japanese). Mokuzai Oakkaishi 11:76-82
9. Onogi S (1973) Principles of rheology ( in Japanese), 3rd edn. Maki Shoten, Tokyo, pp 97-102