RESEARCH
Impact of chloride and strong ion
difference on ICU and hospital mortality
in a mixed intensive care population
Niels Van Regenmortel
1,2*, Walter Verbrugghe
1, Tim Van den Wyngaert
3,4and Philippe G. Jorens
1,4Abstract
Background: Abnormal chloride levels are commonly observed in critically ill patients, but their clinical relevance remains a matter of debate. We examined the association between abnormal chloremia and ICU and hospital mortal-ity. To further refine findings and integrate them into the ongoing discussion on the detrimental effects of chloride-rich solutions, the impact of strong ion difference (SID) on the same end points was assessed.
Methods: Retrospective cohort study in an academic tertiary intensive care unit on 8830 adult patients who stayed at least 24 h in the ICU was carried out. Patients admitted after elective cardiac surgery were treated as a separate subgroup (n= 2350). Analyses were performed using multivariable logistic regression. All statistical models were extensively adjusted for confounders, including comorbidity, admission diagnosis, other electrolytes and acid–base parameters.
Results: Severe hyperchloremia (>110 mmol/L), but not low (SID) was significantly associated with increased mortal-ity in the ICU (odds ratio vs. normochloremia 1.81; 95 % CI 1.32–2.50; p < 0.001) and the hospital (odds ratio 1.49; 95 % CI 1.14–1.96; p= 0.003). Hyperchloremia and low (SID) were encountered in the majority of patients admitted after cardiac surgery (in 86.9 and 47.2 %, respectively), but were not negatively associated with mortality.
Conclusions: In the ICU, hyperchloremia at admission was associated with negative outcome. On the other hand, decreased strong ion difference did not have an impact on mortality, precluding a simple extrapolation of these findings to the ongoing discussion on the detrimental effects of chloride-rich solutions. This notion is fueled by the finding that hyperchloremia after cardiac surgery, frequently encountered and probably fluid-induced, did not seem to be deleterious.
Keywords: Chloride, Hyperchloremia, Strong ion difference, Balanced solutions, Saline, NaCl 0.9 %, Mortality
© 2016 The Author(s). This article is distributed under the terms of the Creative Commons Attribution 4.0 International License (http://creativecommons.org/licenses/by/4.0/), which permits unrestricted use, distribution, and reproduction in any medium, provided you give appropriate credit to the original author(s) and the source, provide a link to the Creative Commons license, and indicate if changes were made.
Background
Chloride is the electrolyte with the highest concentration in human plasma after sodium, yet its clinical importance is a subject of debate. Despite the high prevalence of abnormal chloride levels in the intensive care unit (ICU), research on the possible detrimental effects is scarce. Hyperchloremia has been shown to be negatively associ-ated with mortality or kidney failure in certain subgroups of patients [1–3], although it is difficult to prove that it
is an independent factor contributing to outcome rather than a mere marker of specific conditions or severity of illness [4, 5]. The fact that also hypochloremia has been linked to adverse outcomes in postoperative patients in a number of small-scale studies may point in this direction [6, 7]. Ignoring other electrolytes and acid–base param-eters by considering chloride in isolation could be part of the problem.
Much of the interest is fueled by the fact that hyper-chloremia can be induced by the intravenous (IV) admin-istration of the widely used and economically attractive NaCl 0.9 % that contains chloride in a non-physio-logically high amount [8–11]. There is a possibility to
Open Access
*Correspondence: [email protected]
1 Department of Intensive Care Medicine, Antwerp University Hospital,
Wilrijkstraat 10, 2650 Edegem, Antwerp, Belgium
discern hyperchloremia caused by intravenous fluid use from many other causes by considering the relationship between sodium and chloride rather than treating the lat-ter as a separate entity. The physicochemical approach introduced by the late Peter Stewart argues that the dif-ference between strong cations and anions, by definition fully dissociated in human plasma, is one of the three independent determinants of pH [12]. This entity, termed strong ion difference or (SID), is reduced when hyper-chloremia exists without an equal increase in sodium, e.g., after the intravenous administration of NaCl 0.9 %. Knowledge of the clinical impact of (SID) could contrib-ute to the complex debate on the use of balanced solu-tions whose purpose is to prevent hyperchloremia and/or metabolic acidosis caused by a reduction in (SID). At this moment, despite being a well-known and independent cause of metabolic acidosis, the relevance of a decreased (SID) is doubted [13, 14].
The goal of our study was to analyze the clinical impact of abnormal chloremia and (SID) on the first day of admission in patients who stayed on a tertiary ICU for at least 24 h while taking other influential parameters into consideration. We assessed the link with mortality both on the ICU and in the hospital. Since this type of research could play a role in the ongoing debate on intra-venous fluid therapy, we purposefully chose to include all patients regardless of the reason for their admission instead of preselecting subgroups of patients or diseases. The main aim of the study was to test the hypothesis that hyperchloremia, but also low (SID) are associated with negative outcomes.
Methods
Study design, study population and exclusion criteria We conducted a large-scale retrospective cohort study in the 45-bed tertiary ICU at the Antwerp University Hos-pital, Belgium. The study was reviewed and approved by the hospital’s institutional review board (Number 14/9/88). Since all data were fully de-identified, the necessity of obtaining informed consent was waived. We collected data on every adult patient (over 16 years of age) staying on our ICU for at least 24 h between Octo-ber 2007 and DecemOcto-ber 2014. Patients referred from another ICU and those receiving renal replacement ther-apy on their first day of admission were excluded. 10,165 patients were found eligible for the study (Additional file 1: Figure S1). We decided to divide the study popu-lation into two subgroups, one general ICU popupopu-lation, excluding those that underwent elective cardiac surgery, and a second including only the latter, as hyperchlo-remia after this type of surgery is common and probably fluid-induced.
Data collection
All data were retrieved from the patient data man-agement system (Metavision, iMDsoft, Düsseldorf, Germany). Demographic data included age, gender, Simplified Acute Physiology Score as marker of disease severity (SAPS-3) [15], admission type (medical, elec-tive surgery, emergency surgery including trauma), an extensive comorbidity profile and the reason for admis-sion, divided into 8 medical and 8 surgical categories (Additional file 2: Table S2). We also collected data on renal function by assessing the RIFLE score based on cre-atinine level [16]. Because this score can be troubled by methodological difficulties, e.g., the incomplete availabil-ity of baseline creatinine, we also calculated the RIFLE score based on urine production using an automated search for the 6- and 12-h time frame during which the smallest amount of urine was produced on the first day of admission [16]. Both scores were used separately in the models due to the much higher sensitivity of the urine-based score.
As regards laboratory data, we used only data from each patient’s first day of admission for statistical analy-sis. Since we were interested in chloride level, at least one measurement had to be taken during the first day. If multiple measurements were available, the highest value was used. Other variables included plasma biochemistry data (sodium, potassium, albumin, phosphate, calcium, magnesium) and arterial blood gas analysis (pH, pCO2, lactate). We only included laboratory data that had been taken within a certain time from the referenced chloride value: 1 h for sodium, potassium and blood gas param-eters, and 24 h for albumin, phosphate, calcium and magnesium, although in the majority of cases all meas-urements were performed on the same sample.
sum of routinely unmeasured anions, was defined as SIG = SIDa − lactate − SIDe.
Arterial blood gases were analyzed on a point-of-care Rapidlab 1265 (Siemens Laboratory Diagnostics, Beersel, Belgium). Biochemistry analyses were performed using direct potentiometry (Vitros 950, Johnson & Johnson, Ortho Clinical Diagnostics, Beerse, Belgium) until April 2010, after which the central laboratory changed to indi-rect potentiometry (Dimension Vista 1500, Siemens Lab-oratory Diagnostics, Beersel, Belgium). To match samples taken before and after this transition, Passing-Bablok regression equations were applied to the measurements taken before April 2010. To exclude residual confounding [20, 21] due to this transition, we also added the poten-tiometry type as a covariate in the statistical models and double-checked all conclusions using analyses with point-of-care data that were not influenced by a change in measurement technique (Additional file 3: Table S3, Additional file 4: Table S4).
Statistical analysis and end points
Statistical analyses were performed using STATA 14 (StataCorp LP, Texas, USA). End points were mortality in the ICU within 30 days of admission and hospital mortal-ity. In the latter case, if a patient was admitted more than once, we kept only the last admission for analysis. Means were reported ± standard deviations (SD) and confidence intervals (CI) at the 95 % level. Patients missing any of the covariates were excluded from analysis (Additional file 1: Figure S1).
Before constructing each of the statistical models, we performed a visual inspection of the predictor– response relationship between the covariates of interest and the outcome variable using locally weighted scatter plot smoothing (lowess) [22]. If the shape of the curve suggested a nonlinear relationship and thus a detrimen-tal effect on the end point for both low and high val-ues, covariates were categorized. We decided to divide chloride levels into four categories based on the normal range for chloride in our institution: normochloremia (98–107 mmol/L), hypochloremia (<98 mmol/L), mod-erate hyperchloremia (107–110 mmol/L) and severe hyperchloremia (>110 mmol/L). We divided hyper-chloremia into two categories because we observed that the mean chloride level in our population (107.3 ± 5.5 mmol/L) was at the high end of our nor-mal range for chloride. In addition, a chloride level of >110 mmol/L is accepted in the literature as clinically relevant [1, 2]. Because a commonly accepted range of (SID) is lacking in the literature and SIDa was normally distributed in our population, we opted for cutoff points based on the range of one standard deviation around the mean value (42.9 ± 3.6): “low SIDa” < 41.1 mEq/L,
“intermediate SIDa” 41.1–44.7 mEq/L and “high SIDa” > 44.7 mEq/L. We avoided the term “normal SIDa” as a decreased (SID) can be the result of an ade-quate metabolic compensation process.
Since the outcome variables were binary, we used multivariable logistic regression. We first constructed multivariable models with chloride and SIDa alone, to separate osmolality effects (where both sodium and chlo-ride change in the same direction) from chlochlo-ride load/ acid–base effects and then tested covariates that are known to be associated with the outcome parameter. We only kept covariates that considerably improved model fit, as assessed by the −2 log likelihood and formal tests of equality of the area under the receiver operating char-acteristic curves (ROC). Covariates that are known to potentially influence the covariates of interest (e.g., heart failure treated with diuretics, renal failure, albumin level, chronic obstructive pulmonary disease and other chronic changes in pCO2 can affect chloride level and SIDa) were forced into the models regardless of their statisti-cal impact. For each variable, the odds ratio (OR) was calculated with its 95 % CI. To ensure a correct model specification, we assessed the quadratic form of the lin-ear predictor. All models passed the Hosmer–Lemeshow goodness-of-fit test. Because of the close relationship between some variables, variance inflation factors were used to identify collinear independent variables and reported with every model. Statistical significance was set at a p value of less than 0.05 (two-sided) for all tests.
Results
hospital mortality as the outcome parameter showed similar results (odds ratio of severe hyperchloremia ver-sus normochloremia 1.46; 95 % CI 1.14–1.96; p = 0.003), although also hypochloremia and high SIDa showed a negative association. We also constructed a model in patients with hyperchloremia (>107 mmol/L), treating chloride level as a continuous variable, resulting in an OR of death of 1.06 per 1 mmol/L rise in chloride (95 % CI 1.01–1.11; p = 0.02). Finally, the possibility exists that not every fluid-related dyschloremia is reflected by assessing only the highest chloride level of the first day of admission, as this could neglect an additional resusci-tation effort after the assessment. Therefore, we also per-formed an additional sensitivity analysis by constructing a statistical model using the highest chloride level and lowest SIDa of the first 2 days of admission. The results
are presented in Additional file 5: Table S5 and confirm the main analysis.
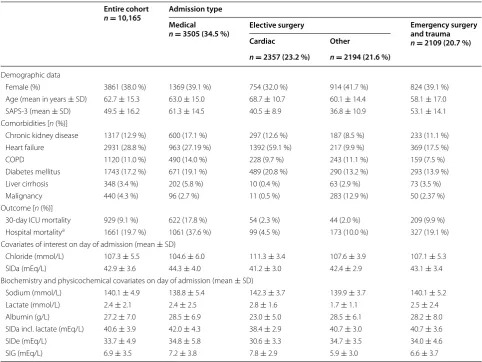
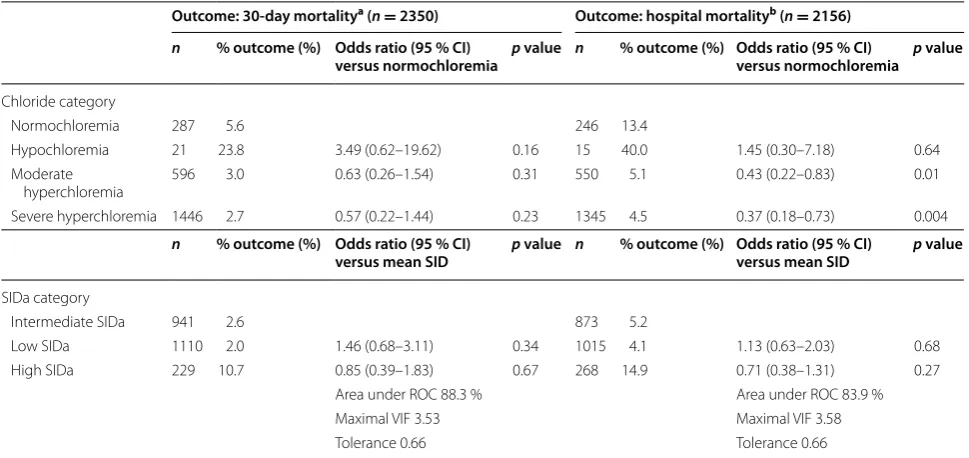
The subgroup of patients that underwent elective car-diac surgery consisted of 2350 patients. Of note, the majority of patients experienced some form of hyper-chloremia (n = 2042, 86.9 %) and chloride level was significantly higher than in the general study popula-tion (111.3 ± 3.4 vs. 106.1 ± 5.5 mmol/L; p < 0.001), while SIDa was lower (41.2 ± 3.0 vs. 43.4 ± 3.6 mmol/L; p < 0.001) (Table 1). Table 4 presents the results of the regression models. Neither hyperchloremia nor SIDa was significantly associated with 30-day mortal-ity. With regard to hospital mortality, moderate (OR 0.43; p = 0.01) and severe hyperchloremia (OR 0.37; p = 0.004) were significantly associated with a decreased odds of death.
Table 1 Clinical characteristics, outcome data and biochemistry values on day 1 of admission
SAPS Simplified Acute Physiology Score, COPD chronic obstructive pulmonary disease, SIDa apparent strong ion difference, SIDe effective strong ion difference, SIG strong ion gap
a If more than one ICU admission, only data on the last admission were used
Entire cohort
n = 10,165 Admission type Medical
n = 3505 (34.5 %) Elective surgery Emergency surgery and trauma
n = 2109 (20.7 %)
Cardiac Other
n = 2357 (23.2 %) n = 2194 (21.6 %)
Demographic data
Female (%) 3861 (38.0 %) 1369 (39.1 %) 754 (32.0 %) 914 (41.7 %) 824 (39.1 %) Age (mean in years ± SD) 62.7 ± 15.3 63.0 ± 15.0 68.7 ± 10.7 60.1 ± 14.4 58.1 ± 17.0 SAPS-3 (mean ± SD) 49.5 ± 16.2 61.3 ± 14.5 40.5 ± 8.9 36.8 ± 10.9 53.1 ± 14.1 Comorbidities [n (%)]
Chronic kidney disease 1317 (12.9 %) 600 (17.1 %) 297 (12.6 %) 187 (8.5 %) 233 (11.1 %) Heart failure 2931 (28.8 %) 963 (27.19 %) 1392 (59.1 %) 217 (9.9 %) 369 (17.5 %) COPD 1120 (11.0 %) 490 (14.0 %) 228 (9.7 %) 243 (11.1 %) 159 (7.5 %) Diabetes mellitus 1743 (17.2 %) 671 (19.1 %) 489 (20.8 %) 290 (13.2 %) 293 (13.9 %) Liver cirrhosis 348 (3.4 %) 202 (5.8 %) 10 (0.4 %) 63 (2.9 %) 73 (3.5 %) Malignancy 440 (4.3 %) 96 (2.7 %) 11 (0.5 %) 283 (12.9 %) 50 (2.37 %) Outcome [n (%)]
30-day ICU mortality 929 (9.1 %) 622 (17.8 %) 54 (2.3 %) 44 (2.0 %) 209 (9.9 %) Hospital mortalitya 1661 (19.7 %) 1061 (37.6 %) 99 (4.5 %) 173 (10.0 %) 327 (19.1 %)
Covariates of interest on day of admission (mean ± SD)
Chloride (mmol/L) 107.3 ± 5.5 104.6 ± 6.0 111.3 ± 3.4 107.6 ± 3.9 107.1 ± 5.3 SIDa (mEq/L) 42.9 ± 3.6 44.3 ± 4.0 41.2 ± 3.0 42.4 ± 2.9 43.1 ± 3.4 Biochemistry and physicochemical covariates on day of admission (mean ± SD)
Discussion
We found a significant and consistent association between severe hyperchloremia and mortality in a large ICU population, confirming on a broader scale previ-ous findings after non-cardiac surgery and sepsis [1, 2]. The inclusion of every patient staying at least 24 h in the ICU and thus the widest possible range of diagno-ses and patient profiles extends the scope of the conclu-sions to include critically ill patients in general. As far as we know, this is the first study in a broad ICU population
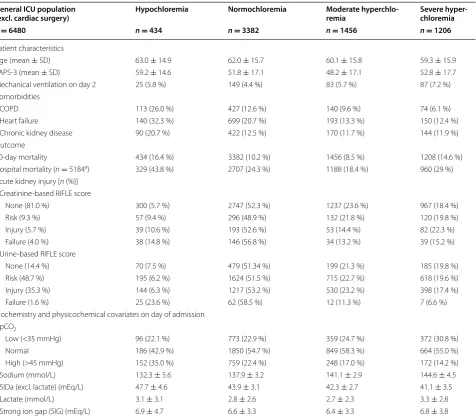
including the largest number of patients ever analyzed in this regard. The challenging question whether hyper-chloremia has a causal role or is merely a consequence of certain conditions remains an issue that cannot be fully elucidated using our study design. The most obvi-ous example of this chicken and egg situation can be found in kidney injury. While hyperchloremia could be a consequence of renal failure, it was also found to induce vasoconstriction of the afferent arteriole leading to the renal glomerulus and to reduce renal blood flow Table 2 Patients’ characteristics according to chloride category
COPD chronic obstructive pulmonary disease, SIDa apparent strong ion difference (excl. lactate)
a If more than one ICU admission, only data on the last admission were used
General ICU population
(excl. cardiac surgery) Hypochloremia Normochloremia Moderate hyperchlo-remia Severe hyper-chloremia
n = 6480 n = 434 n = 3382 n = 1456 n = 1206
Patient characteristics
Age (mean ± SD) 63.0 ± 14.9 62.0 ± 15.7 60.1 ± 15.8 59.3 ± 15.9 SAPS-3 (mean ± SD) 59.2 ± 14.6 51.8 ± 17.1 48.2 ± 17.1 52.8 ± 17.7 Mechanical ventilation on day 2 25 (5.8 %) 149 (4.4 %) 83 (5.7 %) 87 (7.2 %) Comorbidities
COPD 113 (26.0 %) 427 (12.6 %) 140 (9.6 %) 74 (6.1 %) Heart failure 140 (32.3 %) 699 (20.7 %) 193 (13.3 %) 150 (12.4 %) Chronic kidney disease 90 (20.7 %) 422 (12.5 %) 170 (11.7 %) 144 (11.9 %) Outcome
30-day mortality 434 (16.4 %) 3382 (10.2 %) 1456 (8.5 %) 1208 (14.6 %) Hospital mortality (n= 5184a) 329 (43.8 %) 2707 (24.3 %) 1188 (18.4 %) 960 (29 %)
Acute kidney injury [n (%)] Creatinine-based RIFLE score
None (81.0 %) 300 (5.7 %) 2747 (52.3 %) 1237 (23.6 %) 967 (18.4 %) Risk (9.3 %) 57 (9.4 %) 296 (48.9 %) 132 (21.8 %) 120 (19.8 %) Injury (5.7 %) 39 (10.6 %) 193 (52.6 %) 53 (14.4 %) 82 (22.3 %) Failure (4.0 %) 38 (14.8 %) 146 (56.8 %) 34 (13.2 %) 39 (15.2 %) Urine-based RIFLE score
None (14.4 %) 70 (7.5 %) 479 (51.34 %) 199 (21.3 %) 185 (19.8 %) Risk (48.7 %) 195 (6.2 %) 1624 (51.5 %) 715 (22.7 %) 618 (19.6 %) Injury (35.3 %) 144 (6.3 %) 1217 (53.2 %) 530 (23.2 %) 398 (17.4 %) Failure (1.6 %) 25 (23.6 %) 62 (58.5 %) 12 (11.3 %) 7 (6.6 %) Biochemistry and physicochemical covariates on day of admission
pCO2
Table 3 Logistic regression models in the total ICU population excluding patients admitted after elective cardiac surgery
SIDa apparent strong ion difference (excl. lactate), ROC receiver under operating characteristics curve, VIF variance inflation factor
a Confounders adjusted for in the model: sodium (high vs. normal*, low vs. normal*), SAPS-3, admission reason, RIFLEcrea*, RIFLEurine, lactate, heart failure*, COPD*,
pCO2* (low, normal, high), albumin, SIG, potentiometry type* (*p > 0.05)
b Confounders adjusted for in the model: sodium (high vs. normal*, low vs. normal*), SAPS-3, admission reason, RIFLEcrea, RIFLEurine, lactate, heart failure, COPD,
pCO2* (low, normal, high), albumin, SIG*, potentiometry type (*p > 0.05) Outcome: 30-day mortalitya (n
= 6480) Outcome: hospital mortalityb (n
= 5184) n % outcome (%) Odds ratio (95 % CI)
versus normochlo-remia
p value n % outcome (%) Odds ratio (95 % CI) versus normochlo-remia
p value
Chloride category
Normochloremia 3382 10.2 2707 24.3
Hypochloremia 434 16.4 1.02 (0.71–1.48) 0.91 329 43.8 1.55 (1.13–2.13) 0.007 Moderate
hyperchloremia 1456 8.5 1.16 (0.88–1.51) 0.30 1188 18.4 0.96 (0.77–1.20) 0.72 Severe hyperchloremia 1208 14.6 1.81 (1.32–2.50) <0.001 960 29.0 1.49 (1.14–1.96) 0.003
n % outcome (%) Odds ratio (95 % CI) versus intermediate SIDa
p value n % outcome (%) Odds ratio (95 % CI) versus intermediate SIDa
p value
SIDa category
Intermediate SIDa 2982 9.6 2382 20.5
Low SIDa 1598 9.4 0.89 (0.68–1.16) 0.40 1260 21.5 0.94 (0.70–1.15) 0.60 High SIDa 1900 14.6 1.05 (0.83–1.32) 0.71 1542 34.9 1.35 (1.11–1.65) 0.002
Area under ROC 86.7 % Area under ROC 83.5 % Maximal VIF 2.26 Maximal VIF 2.39 Tolerance 0.68 Tolerance 0.68
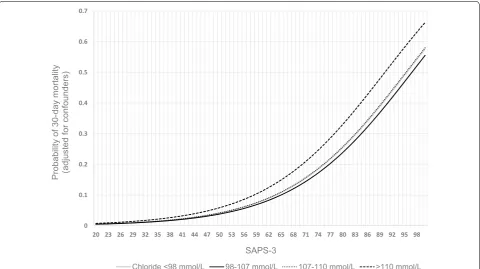
0 0.1 0.2 0.3 0.4 0.5 0.6 0.7
20 23 26 29 32 35 38 41 44 47 50 53 56 59 62 65 68 71 74 77 80 83 86 89 92 95 98
Probability of 30-day mortality (adjusted for confounders)
SAPS-3
Chloride <98 mmol/L 98-107 mmol/L 107-110 mmol/L >110 mmol/L
velocity and cortical perfusion [23, 24]. Our extensive dataset allowed for a precise and granular profiling of the included patients and their illness, and we also adjusted all statistical models for sodium level and kidney injury at admission, using two separate calculations of the RIFLE score (creatinine and diuresis). Also, the lack of a clearly increased prevalence of hyperchloremia in patients with acute kidney injury (Table 2) could be a step toward the answer to this question.
It could be tempting to add these findings to the grow-ing evidence of the deleterious effect of chloride-rich solu-tions. However, a unilateral view on hyperchloremia, with its broad causal range, could lead to premature conclu-sions. We addressed this issue twofold. First, we assessed SIDa in conjunction with chloremia as it is unaltered by the change of sodium and chloride in the same direction and thus a more selective indicator of hyperchloremia induced by intravenous fluid use. SIDa is a difficult parameter to handle, as it can itself be the result of a physiological or compensatory process [25–27]. We therefore constructed statistical models that included relevant parameters (SIG, lactate, albumin, pCO2) and comorbidities. Second, we performed all analyses on a large subgroup of patients admitted after elective cardiac surgery of which we could assume most of the postoperative electrolyte disturbances
were caused by intraoperative fluid manipulations. None of our statistical models showed a significant relation-ship between low SIDa and outcome. Additionally, in the cardiac surgery subgroup, hyperchloremia was not harm-ful and was even associated with a significant reduction of hospital mortality, although it is possible that hypoal-buminemia/hypernatremia-induced alkalosis in this subgroup mitigates hyperchloremia-induced metabolic acidosis. We believe this finding should urge clinicians to adopt a cautious approach in drawing conclusions in the debate on chloride-rich solutions based on findings con-sidering only hyperchloremia. In different experiments, detrimental renal effects could be observed after a fast-administered, highly dosed amount of chloride-rich flu-ids [24, 28, 29]. Our data, reflecting real-life use and thus a broad range of fluid strategies for different clinical rea-sons, do not disprove the existence of this phenomenon, as we lacked a detailed fluid profile in our dataset. Also, our approach principally took fluid-induced metabolic acido-sis into account, whereas the total amount of administered chloride could be an equally relevant culprit, as was shown in certain studies [30, 31], although one could expect a major chloride load to be reflected in chloride level.
Apart from the retrospective design, the possibility of still unmeasured confounding and the rather arbitrary Table 4 Logistic regression models on the subgroup admitted after elective cardiac surgery
SIDa apparent strong ion difference (excl. lactate), ROC Receiver under Operating Characteristics Curve, VIF variance inflation factor
a Confounders adjusted for in the model: sodium (high vs. normal, low vs. normal*), SAPS-3, RIFLEcrea, lactate, heart failure*, COPD*, pCO2* (low, normal, high),
albumin*, SIG, potentiometry type (*p > 0.05). RIFLEurine omitted because of collinearity
b Confounders adjusted for in the model: sodium (high vs. normal, low vs. normal*), SAPS-3, RIFLEcrea, lactate, heart failure*, COPD, pCO2* (low, normal, high),
albumin*, SIG, potentiometry type (*p > 0.05). RIFLEurine omitted because of collinearity Outcome: 30-day mortalitya (n
= 2350) Outcome: hospital mortalityb (n
= 2156) n % outcome (%) Odds ratio (95 % CI)
versus normochloremia p value n % outcome (%) Odds ratio (95 % CI) versus normochloremia p value
Chloride category
Normochloremia 287 5.6 246 13.4
Hypochloremia 21 23.8 3.49 (0.62–19.62) 0.16 15 40.0 1.45 (0.30–7.18) 0.64 Moderate
hyperchloremia 596 3.0 0.63 (0.26–1.54) 0.31 550 5.1 0.43 (0.22–0.83) 0.01 Severe hyperchloremia 1446 2.7 0.57 (0.22–1.44) 0.23 1345 4.5 0.37 (0.18–0.73) 0.004
n % outcome (%) Odds ratio (95 % CI)
versus mean SID p value n % outcome (%) Odds ratio (95 % CI) versus mean SID p value
SIDa category
Intermediate SIDa 941 2.6 873 5.2
Low SIDa 1110 2.0 1.46 (0.68–3.11) 0.34 1015 4.1 1.13 (0.63–2.03) 0.68 High SIDa 229 10.7 0.85 (0.39–1.83) 0.67 268 14.9 0.71 (0.38–1.31) 0.27
cutoff for low SIDa, we regard our inability to decou-ple chloride level from pre-admission fluid therapy as the most important limitation of our study. It is plausible that a patient who develops hyperchloremia in the ICU after large volume resuscitation in the operating theater or emergency room will have a higher chance of mortal-ity than a patient that is normochloremic without the need for a comparable resuscitation effort. Hyperchloremia could be a mere reflection of the amount of resuscitation fluids, itself being a marker of severity of shock and/or fluid overload and thus mortality. This limitation applies in the same way to the other recently published studies on the detrimental effects of hyperchloremia. In a retrospec-tive cohort study, hyperchloremia at 72 h of ICU stay in septic patients was found to be associated with hospital mortality [2]. The lack of data on intravenous fluid admin-istration during ICU stay could reduce the conclusion to the message that the amount of these fluids, rather than their chloride content, was associated with mortality. Like-wise, in the abovementioned cohort study in postoperative patients, even careful propensity matching could prob-ably not resolve the question whether the amount or the chloride content of intraoperative fluid was responsible for the observed mortality increase [1]. Even research on the effect of chloride load itself is unable to fully decouple chloride level from the administered fluid volume [30–32].
Conclusions
In a general intensive care population, after careful con-trolling for confounders, hyperchloremia was signifi-cantly associated with increased 30-day ICU and hospital mortality. A low strong ion difference on the other hand, was not found to be linked with negative outcome, pre-cluding a simplistic extrapolation of our and other find-ings on hyperchloremia to the ongoing discussion on the detrimental effects of chloride-rich solutions.
Additional files
Additional file 1: Figure S1. Cohort derivation, exclusion criteria and missing values. ICU = intensive care unit.
Additional file 2: Table S2. Admission type and admission reason categories.
Additional file 3: Table S3. Logistic regression models in the general ICU population excluding patients admitted after elective cardiac surgery. Point-of-care data for chloride and sodium were used as covariates and for the calculation of SIDa.
Additional file 4: Table S4. Logistic regression models on the subgroup admitted after elective cardiac surgery. Point-of-care data for chloride and sodium were used as covariates and for the calculation of SIDa.
Additional file 5: Table S5. Logistic regression models in the total ICU population excluding patients admitted after elective cardiac surgery. The highest chloride and the lowest SIDa encountered during the first two days of admission were used for analysis.
Author details
1 Department of Intensive Care Medicine, Antwerp University Hospital,
Wilrijkstraat 10, 2650 Edegem, Antwerp, Belgium. 2 Department of Intensive
Care Medicine, Ziekenhuis Netwerk Antwerpen Campus Stuivenberg, Lange Beeldekensstraat 267, 2060 Antwerp, Belgium. 3 Department of Nuclear
Medi-cine, Antwerp University Hospital, Wilrijkstraat 10, 2650 Edegem, Antwerp, Belgium. 4 Faculty of Medicine and Health Sciences, University of Antwerp,
Universiteitsplein 1, 2610 Antwerp, Belgium.
Acknowledgements
We express our gratitude to Kristien Wouters for expert statistical advice. This study was performed at the Antwerp University Hospital, Wilrijkstraat 10, B-2650, Edegem (Antwerp), Belgium. No financial support was used.
Authors’ contribution
NVR designed the study and wrote the first draft of the manuscript. PJ and WV provided scientific and clinical advice on the study design. WV set up and extracted the raw data from the patient data management system. NVR and TVdW performed all statistical analyses and communicated with the institu-tion’s statistician. All authors read and approved the final manuscript.
Competing interests
Dr. Van Regenmortel has received speaker’s fees from Baxter and is co-chair of the International Fluid Academy, a nonprofit organization promoting education on fluid management and hemodynamic monitoring that received sponsoring from the industry (www.fluid-academy.org). The other authors disclose that they do not have any potential competing interests.
Received: 26 May 2016 Accepted: 6 September 2016
References
1. McCluskey SA, Karkouti K, Wijeysundera D, et al. Hyperchloremia after noncar-diac surgery is independently associated with increased morbidity and mor-tality: a propensity-matched cohort study. Anesth Analg. 2013;117:412–21. 2. Neyra JA, Canepa-Escaro F, Li X, et al. Association of hyperchloremia
with hospital mortality in critically ill septic patients. Crit Care Med. 2015;43:1938–44.
3. Zhang Z, Xu X, Fan H, et al. Higher serum chloride concentrations are associated with acute kidney injury in unselected critically ill patients. BMC Nephrol. 2013;14:235.
4. Ioannou N, Terblanche M. Surrogate end points in critical illness research: some way to go yet. Crit Care Med. 2011;39(11):2561–2.
5. Bucher HC, Guyatt GH, Cook DJ, et al. Users’ guides to the medical litera-ture: XIX. Applying clinical trial results. A. How to use an article measuring the effect of an intervention on surrogate end points. Evidence-Based Medicine Working Group. JAMA. 1999;282(8):771–8.
6. Kimura S, Matsumoto S, Muto N, et al. Association of serum chloride concentration with outcomes in postoperative critically ill patients: a retrospective observational study. J Intensive Care. 2014;2:39. 7. Tani M, Morimatsu H, Takatsu F, et al. The incidence and prognostic
value of hypochloremia in critically ill patients. ScientificWorldJournal. 2012;2012:474185.
8. Langer T, Santini A, Scotti E, et al. Intravenous balanced solutions: from physiology to clinical evidence. Anaesthesiology Intensive Therapy. 2015;47 Spec No.: 78–88.
9. Shaw AD, Bagshaw SM, Goldstein SL, et al. Major complications, mortal-ity, and resource utilization after open abdominal surgery: 0.9% saline compared to Plasma-Lyte. Ann Surg. 2012;255:821–9.
10. Young P, Bailey M, Beasley R, et al. Effect of a buffered crystalloid solution vs saline on acute kidney injury among patients in the intensive care unit: the SPLIT randomized clinical trial. JAMA. 2015;314:1701–10.
john-a-kellum-and-paul-wgelbers/stewarts-textbook-of-acid-base/paper-back/product-4239943.html.
13. Gunnerson KJ, Saul M, He S, et al. Lactate versus non-lactate metabolic acidosis: a retrospective outcome evaluation of critically ill patients. Crit Care. 2006;10:R22.
14. Handy JM, Soni N. Physiological effects of hyperchloraemia and acidosis. Br J Anaesth. 2008;101:141–50.
15. Moreno RP, Metnitz PG, Almeida E, et al. SAPS 3—From evaluation of the patient to evaluation of the intensive care unit. Part 2: development of a prognostic model for hospital mortality at ICU admission. Intensive Care Med. 2005;31(10):1345–55.
16. Bellomo R, Ronco C, Kellum JA, Mehta RL, Palevsky P. Acute renal failure—definition, outcome measures, animal models, fluid therapy and information technology needs: the Second International Consensus Conference of the Acute Dialysis Quality Initiative (ADQI) Group. Crit Care. 2004;8:R204–12.
17. Broder G, Weil MH. Excess lactate: an index of reversibility of shock in human patients. Science. 1964;143:1457–9.
18. Figge J, Rossing TH, Fencl V. The role of serum proteins in acid-base equi-libria. J Lab Clin Med. 1991;117:453–67.
19. Fencl V, Jabor A, Kazda A, et al. Diagnosis of metabolic acid-base disturbances in critically ill patients. Am J Respir Crit Care Med. 2000;162:2246–51.
20. Story DA, Morimatsu H, Egi M, et al. The effect of albumin concentration on plasma sodium and chloride measurements in critically ill patients. Anesth Analg. 2007;104:893–7.
21. Dimeski G, Morgan TJ, Presneill JJ, et al. Disagreement between ion selec-tive electrode direct and indirect sodium measurements: estimation of the problem in a tertiary referral hospital. J Crit Care. 2012;27(326):e9–16.
22. Cleveland WS. Robust locally weighted regression and smoothing scat-terplots. J Am Stat Assoc. 1979;74:829–36.
23. Hansen PB, Jensen BL, Skott O. Chloride regulates afferent arteriolar con-traction in response to depolarization. Hypertension. 1998;32:1066–70. 24. Chowdhury AH, Cox EF, Francis ST, et al. A randomized, controlled,
double-blind crossover study on the effects of 2-L infusions of 0.9% saline and plasma-lyte(R) 148 on renal blood flow velocity and renal cortical tissue perfusion in healthy volunteers. Ann Surg. 2012;256:18–24. 25. Masevicius FD, Dubin A. Has Stewart approach improved our ability to
diagnose acid–base disorders in critically ill patients? World J Crit Care Med. 2015;4(1):62–70.
26. Gattinoni L, Carlesso E, Maiocchi G, et al. Dilutional acidosis: where do the protons come from? Intensive Care Med. 2009;35(12):2033–43.
27. Langer T, Carlesso E, Gattinoni L. The Hamburger effect: beyond chloride shift. Am J Respir Crit Care Med. 2012;185:A3168.
28. Bullivant EM, Wilcox CS, Welch WJ. Intrarenal vasoconstriction dur-ing hyperchloremia: role of thromboxane. Am J Physiol. 1989;256(1 Pt 2):F152–7.
29. Wilcox CS. Regulation of renal blood flow by plasma chloride. J Clin Invest. 1983;71(3):726–35.
30. Yunos NM, Bellomo R, Hegarty C, et al. Association between a chloride-liberal vs chloride-restrictive intravenous fluid administration strategy and kidney injury in critically ill adults. JAMA. 2012;308(15):1566–72. 31. Shaw AD, Raghunathan K, Peyerl FW, et al. Association between
intrave-nous chloride load during resuscitation and in-hospital mortality among patients with SIRS. Intensive Care Med. 2014;40(12):1897–905.