R E S E A R C H
Open Access
Milk yield and composition, body condition,
rumen characteristics, and blood metabolites of
dairy cows fed diet supplemented with palm oil
Danijela Kirovski
1*, Bojan Blond
2, Marko Kati
ć
2, Radmila Markovi
ć
3and Dragan
Š
efer
3Abstract
Background:An addition of rumen-protected fat to the diet of cows may limit negative energy balance and/or shorten its duration, leading to increased milk production with reduced risk of metabolic disorders in dairy cows. The aim of the study was to test the effect of rumen-inert fat supplement of palm oil on milk production, milk composition, rumen characteristics, and metabolic variables of early lactating dairy cows. For this purpose, 24 Holstein-Friesian cows were divided into two equal groups and fed a corn silage-based diet, without palm oil supplementation (control) or with 300 g palm oil (Palm Fat 99, Noack & Co. GmbH, Vienna, Austria) per cow for 8 weeks starting from day 30 after parturition. Milk, rumen, and blood samples were taken three times during experiment at days 30, 58, and 86 of lactation. Body condition scores of cows were determined in the same time periods. Milk yields were measured at the morning and evening milking (600and 1800). Milk samples were analyzed for milk fat and milk protein content. Rumen content was tested for electrochemical reaction. A native slide was prepared for microscopical examination of the rumen protozoa motility that was numerically estimated. Protozoa were counted in whole rumen contents by light microscopy. Blood samples were tested for total protein, albumin, urea, tryglicerides, cholesterol, total bilirubin, beta-hydroxybutyrate, Ca, and P.
Results:Compared with the control, palm oil supplementation resulted in an increase of the average milk yield and milk fat content. The loss in body condition was significantly lower in the group fed palm oil than in the control group. Rumen pH, total number, and motility of protozoa in the group fed palm oil were significantly higher than those in the control group. Palm oil supplementation did not influence blood metabolite
concentrations except for urea and glucose which were significantly lower and Ca and cholesterol which were significantly higher in the palm oil-supplemented group.
Conclusions:Our results indicate that supplementation with palm oil in weeks 4 to 12 postpartum spared postpartum body weight loss, increased milk yield and milk fat content, and had positive effects on rumen characteristics.
Keywords:Palm oil; Rumen-protected fat; Dairy cows
Background
Management and nutrition during the transition period influence milk production, the incidence of peripartum metabolic disorders, and reproductive performance. Namely, energy deficiency due to reduced dry matter intake during the transition period leads to increased lipolysis of deposited fat and release of non-esterifed
fatty acids (NEFA) to the blood [1]. Although dry mat-ter intake increases gradually at the beginning of lacta-tion, the rapid increase in milk production after calving causes negative energy balance (NEB) [2]. Lipolysis is sustained during early lactation as long as energy intake cannot compensate for the increased energy demand of lactation [2,3]. Aside from being utilized by the mam-mary gland, parts of the circulatory NEFA are taken by the liver, where they can be metabolized through one to three major pathways: (1) direct production of energy via oxidation of NEFA in mitochondria or peroxisomes, * Correspondence:dani@vet.bg.ac.rs
1
Department of Physiology and Biochemistry, Faculty of Veterinary Medicine, University of Belgrade, Bulevar oslobodjenja 18, 11000 Belgrade, Serbia Full list of author information is available at the end of the article
(2) production of ketone bodies through oxidation, or (3) reesterification into triacylglycerol (TAG), which can then either be sequestered in internal stores or be released into the circulation as very-low-density lipo-protein (VLDL) [4]. In cows, however, VLDL secretion is relatively low, which predisposes the animals to fatty liver [5]. As TAG accumulates in the hepatocytes, there is apparent reduction in liver function [6]. Many disor-ders such as mastitis, ketosis, retained placenta, various degrees of depressed immune competence, and repro-ductive performance result from liver dysfunction at the early stage of lactation [7]. Cows may compensate lower feed intake if a large energy concentration is added in meals. An addition of dietary fat, which in-creases the energy density of the cows' diet, may limit and/or shorten NEB in early lactated dairy cows. Data in the literature on the relationship between the addition of dietary fat and the performance of lactating dairy cows are inconsistent because the impact of diet-ary fat is influenced by the source of fat, method of processing, amount of fat included in the diet, and stage of lactation [8]. Additionally, the mechanism by which different fat supplementations may have an impact on lipid metabolism in ruminants is not fully understood. Although most researchers indicate that added dietary fat had a positive effect on energy metab-olism by decreasing hepatic lipid and increasing liver glycogen content in transition dairy cows [9,10], others have suggested that supplemental fat might increase the risk of peripartal lipid accumulation in the liver of dairy cows [11]. The aim of the study was to test the ef-fect of rumen-inert fat supplement of palm oil on milk production, milk composition, rumen characteristics, and metabolic variables of early lactating dairy cows.
Methods
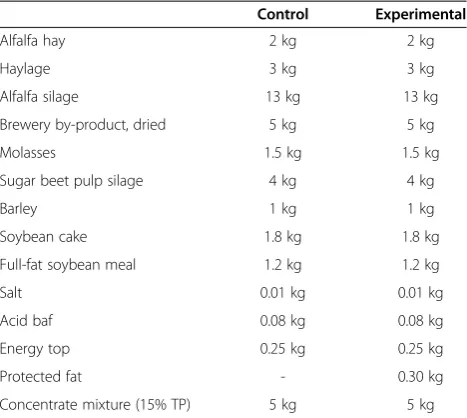
The experiment was carried out on a commercial dairy farm. Twenty-four Holstein-Friesian cows were divided into two equal groups and fed a corn silage-based diet, without palm oil supplementation (control) or with 300 g palm oil (Palm Fat 99, Noack & Co. GmbH, Vienna, Austria) per cow (experimental) for 8 weeks starting from day 30 after parturition. Composition of the daily ration of cows and nutrient concentration of the daily ration are presented in Tables 1 and 2, respectively.
Milk, rumen, and blood samples were taken three times during experiment at days 30, 58, and 86 of lacta-tion. Body condition scores of cows were determined in the same time periods. Body condition scoring (using a five-point scale with quarter-point divisions) was per-formed on all cows by the same investigator using the
system provided by Elanco Animal Health Bulletin Al
8478 and described in detail byŠamanc et al. [12]. Milk
yields were measured at the morning and evening milking (600 and 1800) using Milk Master equipment (DeLaval, Tullamarine, Victoria, Australia). Milk samples were ana-lyzed for composition (milk fat and milk protein content) using LactiCheck P&P Milk Analyzer (Page & Pedersen International Ltd., Hopkinton, MA, USA). From all the cows induced in trial, at the age of 30, 58, and 86 days of lactation, samples of rumen content were taken with the aid of a specifically designed probe. Rumen content was taken 4 to 6 h after administration of the morning meal. Immediately after the samples were taken, testing for elec-trochemical reaction on a pH meter (HI 9321, HANNA instruments, Woonsocket, RI, USA) was done, and a na-tive slide was prepared for microscopical examination of the rumen protozoa motility. The motility was numerically estimated (1 - immobile, 2 - poor motility, 3 - optimal mo-tility). Samples were mixed with equal volume of 2% for-malin in phosphate-buffered saline for microscopic counts. Protozoa were counted in whole rumen contents
Table 1 Composition of the daily ration of cows
Control Experimental
Alfalfa hay 2 kg 2 kg
Haylage 3 kg 3 kg
Alfalfa silage 13 kg 13 kg
Brewery by-product, dried 5 kg 5 kg
Molasses 1.5 kg 1.5 kg
Sugar beet pulp silage 4 kg 4 kg
Barley 1 kg 1 kg
Soybean cake 1.8 kg 1.8 kg
Full-fat soybean meal 1.2 kg 1.2 kg
Salt 0.01 kg 0.01 kg
Acid baf 0.08 kg 0.08 kg
Energy top 0.25 kg 0.25 kg
Protected fat - 0.30 kg
Concentrate mixture (15% TP) 5 kg 5 kg
Table 2 Nutrient concentration of the daily ration (g/kg DM)
Control Experimental
Dry matter 57.07 −57.99
Total ash −7.83 −7.25
Crude protein −20.64 −19.51
Fat −2.37 −2.96
Cellulose −18.21 −13.30
Nitrogen-free extract −50.95 −56.98
Calcium −0.92 −0.95
Phosphorus −0.48 −0.46
by light microscopy as previously described [13]. Counts of total protozoa were recorded. Twenty fields of view were counted, and the highest and lowest counts were dis-carded. Blood samples were taken from cows, at the age of 30, 58, and 86 days of lactation by v. jugularispuncture 30 min before rumen content sampling. In such a way, the effects of stress on the obtained results were eliminated. Blood samples were taken into test tubes with no added anticoagulant, with the exception of the samples taken for glucose determination as these contained the anticoagu-lant Na fluoride. After 15 min on room temperature, all samples were centrifuged at 1,000g for 20 min and the blood serum and blood plasma separated and stored at−18°C until analyses. Blood samples were tested by pho-tometry for total protein, albumin, urea, tryglicerides, cholesterol, total bilirubin, beta-hydroxybutyrate, Ca, and P concentrations with commercial test kits (BioMedica, Zemun, Serbia). The results obtained were analyzed statistically using Statistica v. 6. (StatSoft, Inc., Tulsa, OK, USA). Experimental data are presented as means ± stand-ard error (SE). For testing and determination of statisti-cally significant differences, two tests were applied. The first test was the completely random plan (ANOVA) which determines the presence of significant differences for all values. The second was thet-test, which determines the statistically significant differences between treatments. Differences were considered statistically significant at
p< 0.05,p< 0.01, andp< 0.001.
Results and discussion
The mean body condition scores of examined cows (n= 24) at days 30, 58, and 86 of lactation are presented at Table 3.
From Table 3, it can be seen that mean body condition scores at day 58 of control cows were significantly lower than those at days 30 and 86 of lactation (p< 0.05, re-spectively) and were significantly lower than the value obtained at the same time period in the experimental group (p< 0.01). Several researchers [14,15] have shown that dry matter intake (DMI) is unaffected by fat supple-mentation. Although DMI was not measured in this study, on-field observation of daily cow feeding indicated that there was no difference in appetite between the two examined groups of cows. Ashes et al. [16] showed that fatty acids, which are protected from rumen biohydrogenation because of heat or chemical
treatment, may be included at higher concentrations in the diet without influencing intake. Since added fat did not depress appetite and milk yield did not differ between groups, higher BCS in the experimental cows at day 56 of lactation may be a consequence of better utilization of energetic precursors in peripheral tissue.
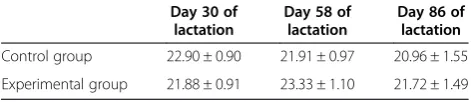
The average daily milk yields of the examined cows (n= 24) at days 30, 58, and 86 of lactation are pre-sented in Table 4.
From Table 4, it can be seen that mean daily milk yields at days 58 and 86 of lactation were higher than those in the control calves but the difference was not significant. Average milk fat contents at day 58 were 2.93% ± 0.22% (control cows) and 2.46% ± 0.20% (experi-mental cows), while at day 86, average milk fat contents were 2.59% ± 0.19% in the control cows and 3.25% ± 0.22% in the experimental one. At day 86, fat contents in the experimental cows were significantly higher than those at day 56 in the same group (p< 0.01) as well as than those at day 86 in the control group (p< 0.05). Average milk protein contents at day 56 were 3.05% ± 0.03% and 3.01% ± 0.03% in the control and the experimental cows, respectively. At day 86 of lactation, average milk protein contents were 3.00% ± 0.04% (control group) and 3.07% ± 0.03% (experimental group). Daily yield of total milk and milk protein percentages were not influenced significantly by diet. This finding is consistent with other studies [8,14]. Milk fat percentage was influ-enced by fat supplementation. Namely, it is known that marked changes in energy balance, as the cow progresses through lactation, can influence the extent to which added dietary lipid is partitioned between adipose tissue and milk. Several studies examined the effects of palmitic acid on milk fat yield. The supplementation of 517 g/day of palm oil containing 62% palmitic acid resulted in a 20% increased milk fat percentage with no adverse effects on milk protein [17]. These results are similar to those in the current study.
Results presented in Table 5 show that at day 86 of lactation, urea and glucose concentrations were signifi-cantly lower in the palm oil-supplemented compared to the control group (p< 0.05 and p< 0.001, respectively); at day 58, Ca concentration was significantly higher in the palm oil-supplemented compared to the control group (p< 0.05); and at day 86, cholesterol concentration was significantly higher in the experimental compared to the control group (p< 0.01). Results related to the
Table 3 The mean body condition scores of examined cows
Day 30 of lactation
Day 58 of lactation
Day 86 of lactation
Control group 2.75 ± 0.03 B 2.62 ± 0.04 A 2.77 ± 0.06 B
Experimental group 2.73 ± 0.04 A 2.79 ± 0.04 A** 2.81 ± 0.06 A
Means within a row with different letters differ (p< 0.05). *p< 0.05; **p< 0.01; ***p< 0.001 compared to the value of the control group.
Table 4 The average daily milk yields of examined cows
Day 30 of lactation
Day 58 of lactation
Day 86 of lactation
Control group 22.90 ± 0.90 21.91 ± 0.97 20.96 ± 1.55
influence of palm oil on glucose concentration are in-consistent. Namely, some studies, like Khorasani et al. [18] and Kronfeld et al. [19], observed a tendency for an increased response of blood glucose concentration while the others have indicated that plasma glucose concentra-tions do not change when fat is fed [20] or when long-chain fatty acids are infused into the abomasum [21]. Our results showed that glucose concentration decreased in the experimental group, although milk production did not significantly increase in this group. The possible ex-planation is that in the case of slower passage of food through the rumen, ruminal amino acid deamination increases, leading to the decrease of gluconeogenesis pre-cursor concentrations. The effect of added dietary fat on serum cholesterol is similar to the findings from an earlier study [18]. This finding is also in agreement with other studies [22,23] that demonstrated a positive relationship between serum cholesterol concentration and dietary fat. Nestel et al. [23] proposed that an increase in dietary fat stimulates intestinal cholesterol synthesis to meet the in-creased demand for absorption and transport of fat.
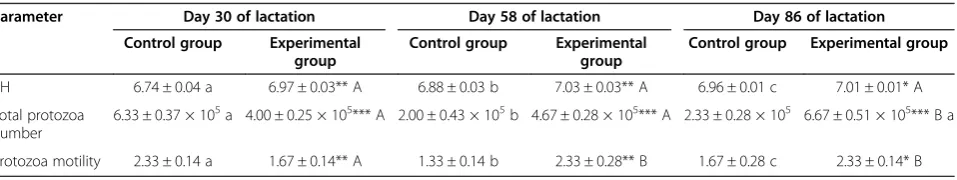
Rumen content analysis (Table 6) showed that the pH value was significantly higher in the experimental group at 30, 58, and 86 days of lactation. Studies on the pres-ence of protozoa in native rumen content preparations
have shown significant differences between the results obtained for the treated and control groups at all three tested periods. In the control group, there were a signifi-cantly smaller number of total protozoa which had lower motility at days 58 and 86 of lactation. Results related to rumen characteristics are unexpected since there was a significant positive impact of fat supplementation on protozoa number and motility. Namely, some authors, including Abubakr et al. [24] and Machmuller and Kreuzer [25], reported a decreased number of rumen protozoa in animals receiving oil supplements in their diet. Nevertheless, they showed that this effect depends on the levels of dietary oil concentration, indicating that lower concentrations are not enough to negatively affect the rumen number of protozoa. The possible explan-ation of our results related to rumen content analysis is longer exposure of protozoa to energy precursors in the rumen due to the supposed depressed ruminal passage of food particles.
Conclusions
Our results indicate that supplementation with palm oil in weeks 4 to 12 postpartum spared postpartum body weight loss, increased milk yield and milk fat content, and had positive effects on rumen characteristics.
Table 5 Values (mean ± SE) of the measured blood parameters
Parameter Day 30 of lactation Day 58 of lactation Day 86 of lactation Control group Experimental group Control group Experimental group Control group Experimental group
Total protein (g/L) 78.82 ± 1.42 a 76.81 ± 1.55 B 81.96 ± 1.82 a 83.78 ± 2.14 A 79.74 ± 1.43 a 77.54 ± 1.13 AB
Albumin (g/L) 36.87 ± 1.29 a 37.88 ± 1.93 A 36.82 ± 1.44 a 33.51 ± 1.37 A 34.91 ± 1.59 a 34.49 ± 1.49 A
Urea (mmol/L) 9.01 ± 0.53 a 7.74 ± 0.53 A 8.71 ± 0.58 a 8.40 ± 0.29 A 6.58 ± 0.38 b 5.46 ± 0.32* B
Total bilirubin (mmol/L) 7.05 ± 0.47 a 7.44 ± 0.72 A 6.96 ± 0.52 a 6.43 ± 0.50 A 6.65 ± 0.32 a 6.56 ± 0.30 A
Triglycerides (mmol/L) 0.13 ± 0.01 a 0.14 ± 0.01 A 0.19 ± 0.01 b 0.21 ± 0.02 B 0.32 ± 0.13 b 0.37 ± 0.10 B
Cholesterol (mmol/L) 3.74 ± 0.24 3.44 ± 0.21 A 4.31 ± 0.21 4.67 ± 0.23 B 4.45 ± 0.31 5.93 ± 0.39** C
BHBA (mmol/L) 1.18 ± 0.36 a 0.62 ± 0.02 A 0.49 ± 0.09 ab 0.57 ± 0.04 AB 0.39 ± 0.03 b 0.49 ± 0.04 B
Glucose (mmol/L) 3.09 ± 0.16 a 3.77 ± 0.13** A 3.39 ± 0.11 a 3.76 ± 0.07* A 3.76 ± 0.06 b 3.26 ± 0.09*** B
Ca (mmol/L) 2.97 ± 0.06 a 2.83 ± 0.05 A 3.07 ± 0.06 b 3.25 ± 0.04* B 3.23 ± 0.07 b 3.11 ± 0.07 B
P (mmol/L) 2.11 ± 0.11 a 1.99 ± 0.08 A 2.36 ± 0.09 a 2.14 ± 0.11 A 2.14 ± 0.07 a 2.06 ± 0.09 A
Means within a row with different uppercase letters differ within the experimental group (p< 0.05). Means within a row with different lowercase letters differ within the control group (p< 0.05). *p< 0.05; **p< 0.01; ***p< 0.001 compared to the value of the blood of control cows.
Table 6 Values (mean ± SE) of the measured rumen content parameters
Parameter Day 30 of lactation Day 58 of lactation Day 86 of lactation Control group Experimental
group
Control group Experimental group
Control group Experimental group
pH 6.74 ± 0.04 a 6.97 ± 0.03** A 6.88 ± 0.03 b 7.03 ± 0.03** A 6.96 ± 0.01 c 7.01 ± 0.01* A
Total protozoa number
6.33 ± 0.37 × 10⁵a 4.00 ± 0.25 × 10⁵*** A 2.00 ± 0.43 × 10⁵b 4.67 ± 0.28 × 10⁵*** A 2.33 ± 0.28 × 10⁵ 6.67 ± 0.51 × 10⁵*** B a
Protozoa motility 2.33 ± 0.14 a 1.67 ± 0.14** A 1.33 ± 0.14 b 2.33 ± 0.28** B 1.67 ± 0.28 c 2.33 ± 0.14* B
Competing interests
The authors declare that they have no competing interests.
Authors' contributions
DK participated in the design of the study, carried out the blood analyses, and drafted the manuscript. BB carried out the experimental part of the work. MK carried out the statistical analyses. RM carried out the analyses of food. DŠparticipated in the design of the study and coordinated and helped to draft the manuscript. All authors read and approved the final manuscript.
Author details
1Department of Physiology and Biochemistry, Faculty of Veterinary Medicine,
University of Belgrade, Bulevar oslobodjenja 18, 11000 Belgrade, Serbia.
2Veterinary Station, Agriculture Cooperation Belgrade, Industrijsko naselje bb,
11213 Belgrade, Serbia.3Department of Animal Nutrition and Botany, Faculty
of Veterinary Medicine, University of Belgrade, Bulevar oslobodjenja 18, 11000 Belgrade, Serbia.
Received: 11 October 2014 Accepted: 17 December 2014
References
1. Gonzales FD, Muino R, Pereira V, Campos R, Benedito JL (2011) Relationship among blood indicators of lipomobilization and hepatic function during early lactation in high-yielding dairy cows. J Vet Sci 12:213–218 2. Grummer RR (2008) Nutritional and management strategies for the
prevention of fatty liver in dairy cattle. Vet J 176:10–20
3. McNamara JP (1991) Regulation of adipose tissue metabolism in support of lactation. J Dairy Sci 74:706–719
4. Drackley JK, Donkin SS, Reynolds CK (2006) Major advances in fundamental dairy cattle nutrition. J Dairy Sci 89:1324–1336
5. Kleppe BB, Aiello RJ, Grummer RR, Armentano LE (1988) Triglyceride accumulation and very low density lipoprotein secretion by rat and goat hepatocytes in vitro. J Dairy Sci 71:1813–1822
6. Bobe G, Young JW, Beitz DC (2004) Invited review: pathology, etiology, prevention, and treatment of fatty liver in dairy cows. J Dairy Sci 87:3105–3124
7. Bertoni G, Trevisi E (2013) Use of liver activity index and other metabolic variables in the assessment of metabolic health in dairy herds. Vet Clin North Am Food Anim Pract 29:413–431
8. Palmquist DL, Jenkins TC (1980) Fat in lactation rations: review. J Dairy Sci: 63:1–14
9. Patton RS, Sorenson CE, Hippen AR (2004) Effects of dietary glucogenic precursors and fat on feed intake and carbohydrate status of transition dairy cows. J Dairy Sci 87:2122–2129
10. Steele W, Moore JH (1968) The digestibility coefficients of myristic, palmitic and stearic acids in the diet of sheep. J Dairy Res 35:371–381
11. Vazquez-Anon M, Bertics S, Luck M, Grummer RR, Pinheiro J (1994) Peripartum liver triglyceride and plasma metabolites in dairy cows. J Dairy Sci 77:1521–1528
12. Šamanc H, Kirovski D, JovanovićM, Vujanac I, Bojković-KovačevićS, Jakić-DimićD, ProdanovićR, StajkovićS (2010) New insights into body condition score and its association with fatty liver in Holstein dairy cows. Acta Vet (Beograd) 60:525–540
13. Dehority BA (1984) Evaluation of subsampling and fixation procedures used for counting rumen protozoa. Appl Environ Microbiol 48:182–185 14. Schingoethe DJ, Casper DP (1991) Total lactational response to added fat
during early lactation. J Dairy Sci 74:2617–2622
15. Wu ZJ, Huber T, Chan SC, Simas JM, Chen KH, Varela JG, Santos F, Fontes C, Yu P (1994) Effect of source and amount of supplemental fat on lactation and digestion in cows. J Dairy Sci 77:1644–1651
16. Ashes JR, Welch PV, Gulati SK, Scott TW, Brown GH (1992) Manipulation of the fatty acid composition of milk by feeding protected canola seeds. J Dairy Sci 75:1090–1096
17. Banks W, Clapperton JL, Ferrie ME, Wilson AG (1976) Effects of feeding fat to dairy cows receiving a fat-deficient basal diet. I. Milk yield and composition. J Dairy Res 43:213–218
18. Khorasani GR, de Boer G, Robinson PH, Kennelly JJ (1992) Effect of canola fat on ruminal and total tract digestion, plasma hormones, and metabolites in lactating dairy cows. J Dairy Sci 75:492–501
19. Kronfeld DS, Donoghue S, Naylor JM, Johnson K, Bradley CA (1980) Metabolic effects of feeding protected tallow to dairy cows. J Dairy Sci 63:542–552
20. Johnson JC, Utley PR, Mullinix BG, Merrill A (1988) Effects of adding fat and lasalocid to diets of dairy cows. J Dairy Sci 71:2151–2165
21. Christensen RA, Drackley JK, LaCount DW, Clark JH (1994) Influence of four long-chain fatty acid mixtures into the abomasum of lactating dairy cows. J Dairy Sci 77:1052–1069
22. Choi B, Palmquist DL (1996) High fat diets increased plasma cholecystokinin and pancreatic polypeptide, and decrease plasma insulin and feed intake in lactating cows. J Nutr 126:2913–2919
23. Nestel PJ, Poyser A, Hood RL, Mills SC, Willis MR, Cook LJ, Scott TW (1978) The effect of dietary fat supplements on cholesterol metabolism in ruminants. J Lipid Res 19:899–909
24. Abubakr AR, Alimon AR, Yaakub H, Abudllah N, Ivan M (2013) Digestibility, rumen protozoa, and ruminal fermentation in goats receiving dietary palm oil by-products. J Saudy Soc Agric Sci 12:147–154
25. Machmuller A, Kreuzer M (1999) Methane suppression by coconut oil and associated effects on nutrient and energy balance in sheep. Can J Anim Sci 79:65–72
Submit your manuscript to a
journal and benefi t from:
7Convenient online submission
7Rigorous peer review
7Immediate publication on acceptance
7Open access: articles freely available online
7High visibility within the fi eld
7Retaining the copyright to your article