Yoon et al. Micro and Nano Syst Lett (2017) 5:9
DOI 10.1186/s40486-017-0043-0
LETTER
Simple refractometry using optical path
separation via multiple pinholes
Sang Youl Yoon
1,3†, Ji‑chul Hyun
2†and Sung Yang
1,2*Abstract
We herein report on a simple and novel method of refractometry that uses a micro image defocusing technique. This simple method makes use of a three‑pinhole aperture attached to a microscopic optical system. In order to develop our proposed method, an analytical formula was derived from the principles of optical modelling, taking into consid‑ eration imaging optics, and was verified experimentally. In order to verify and demonstrate the method, the refractive index (RI) of several materials with known and certified RIs were measured. The results demonstrate a good level of accuracy, with a difference between the certification and the measurements of the order of 10−4 RIU (refractive index unit).
Keywords: Refractometry, Refractive index, Multiple pinholes
© The Author(s) 2017. This article is distributed under the terms of the Creative Commons Attribution 4.0 International License (http://creativecommons.org/licenses/by/4.0/), which permits unrestricted use, distribution, and reproduction in any medium, provided you give appropriate credit to the original author(s) and the source, provide a link to the Creative Commons license, and indicate if changes were made.
Background
Refractive index (RI) of the fluid is one of the optical properties that can be used to infer various biological and chemical properties of a material, and that refrac-tometry therefore has great potential for use in biological and chemical applications as a highly sensitive, label-free, optical sensor [1–4]. The significant advantages of such an optical sensor have led to the development of various kinds of refractometries in order to meet the require-ments of different applications over the last half-century. New concepts of refractometry continue to be proposed widely, as the importance of label-free sensing in bio-chemical, bio-medical, ecological, and food applications increases.
An image defocusing technique has been used in Defo-cusing Digital Particle Image Velocimetry (DDPIV) for 3D particle tracking and 3D flow measurement [5, 6]. This imaging technique has been extended to microflow applications such as the micro image defocusing tech-nique [7.8.9.10]. Within this field, several authors have described the effects of fluid RI in the image defocusing
for the purpose of z-compensation for fluid RIs when using (μ−) DDPIV [6, 9, 10]. It is therefore plausible that the image defocusing technique might be applied to the measurement of RI using a simple optical layout. A micro-refractometer that used micro image defocusing and a microfluidic device was reported previously [11] but the authors gave no details of its optical configura-tion; however, they demonstrated the use of the image defocusing technique for RI measurement.
We herein propose a new RI measurement method that utilizes the image defocusing technique in conjunction with a three-pinhole aperture, but in a different way from the aforementioned micro-refractometer [11]. While the previous study used the direct comparison of the image separation, we suggest a method that utilizes the change rate of the image separation. This method might have a wider range of applications due to its insensitivity to uncertainties in the environment, such as the working distance, sample thickness, and substrate material.
Methods
Micro image defocusing & working principle for the measurement of RI
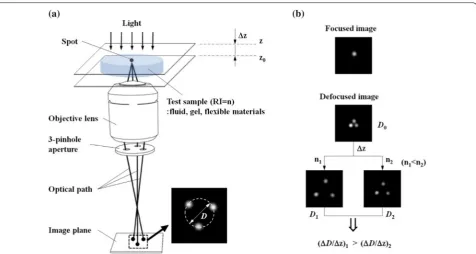
A schematic of the micro image defocusing technique with a 3-pinhole aperture, and the principle of RI meas-urement, is shown in Fig. 1. The key optical element is
Open Access
*Correspondence: [email protected]
†Sang Youl Yoon and Ji‑chul Hyun contributed equally to this work 1 Department of Biomedical Science & Engineering, Gwangju Institute
the multiple-pinhole aperture, which is attached directly behind an objective lens, and which divides the optical ray into three different optical paths via the pinholes. As shown in Fig. 1a, when a spot is not placed on the focal plane, three duplicated and separated spot images are produced on the image plane due to the optical path sep-aration, while a single image of the spot is formed on the image plane when the spot is located on the focal plane.
The image separation, D, which is defined to be the diam-eter of the circle circumscribed around the three defocused spot images [7, 10, 11], is mainly determined by the working distance, the thickness of the sample, the pinhole separation, and the RI of the sample. Once all of the parameters, with the exception of the sample RI, have been fixed, the image separation becomes a function of the RI alone. Thus, RI measurement using the image defocusing technique is pos-sible by calibration across different values of RI and D. There are, however, a few practical difficulties associated with maintaining consistency of the working distance and the sample thickness between the calibration procedure and RI measurements. In light of these difficulties, we use the rela-tionship between the RI of the sample and ΔD/Δz. This is possible because ΔD/Δz is almost constant due to the linear nature of the z–D relationship, and is independent of both the working distance and thickness of the sample [7, 9].
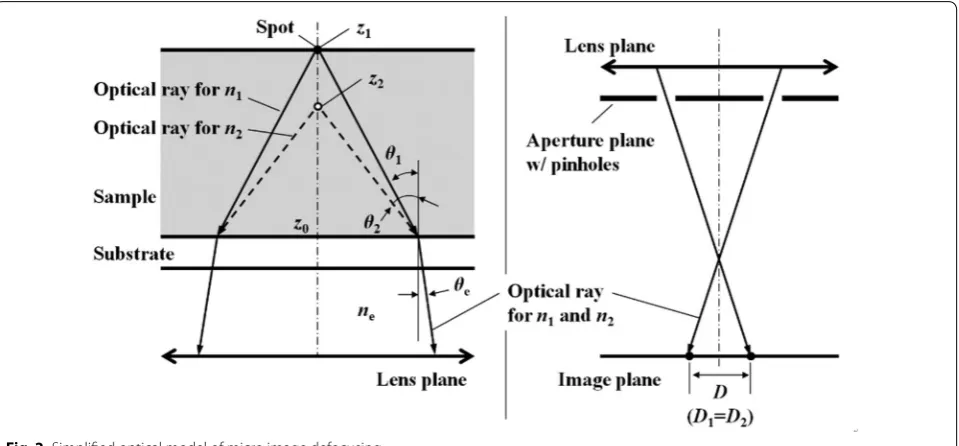
Figure 2 shows a simplified optical system for micro image defocusing applied to the sample with RI values n1 or n2. The collective RI values for the substrate, lens, and
air, etc., can be considered to be an equivalent RI, ne, which results in an equivalent angle of refraction, θe. As shown in Fig. 2, the tracing of an optical ray for an identical image separation (D1 = D2) is used to derive the optical correla-tion of RI-(∂D/∂z). The optical rays from z1 for n1, and z2 for n2, are refracted through an angle θe, and finally construct two identical spot images (D1 = D2) on the image plane.
As a result of the linear relationship between D and z [7–10], D is simply calculated as D=(∂D/∂z)(z−z0) [7,
10]. For the identical image separation, D1 = D2:
Snell’s law for the optical paths in Fig. 2 is expressed as follows:
The relationship between z1 and z2 can therefore be determined from the tracing of the optical rays and Eq. 2:
It is valid to assume that cos(θ1)/cos(θ2)∼1.0 because
cos(θ) does not change significantly due to the very small value of θ in the microscopic test volume. Equations 1
and 3 can therefore be simplified as follows:
(1) (∂D/∂z)1(z1−z0)=(∂D/∂z)2(z2−z0)
(2) nesin(θe)=n1sin(θ1)=n2sin(θ2)
(3) (z1−z0)
(z1−z0) = tan(θ2)
tan(θ1) = n1 n2
cos(θ1)
cos(θ2)
(4)
∂D
∂z
2
∂D
∂z
1
=
(z1−z0) (z2−z0)
∼ =
n1
n2
Page 3 of 6 Yoon et al. Micro and Nano Syst Lett (2017) 5:9
Furthermore, Eq. 4 can be rewritten as:
where C is a constant and can be obtained from a calibra-tion of RI-(∂D/∂z). Finally, the RI can be expressed simply as a function of ∂D/∂z:
Experimental setup
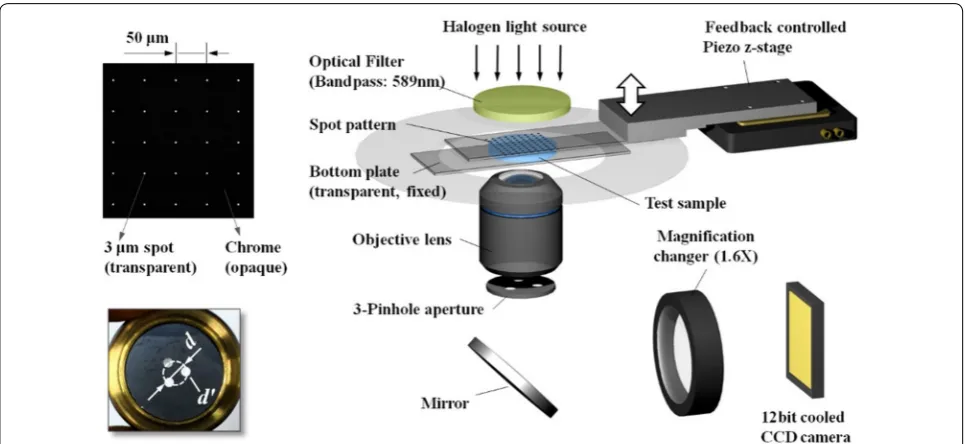
In order to investigate the performance of our proposed method of refractometry, we developed an experimental system based on the schematic diagram shown in Fig. 3. The system for the measurement of RI via micro image defocusing consists of a microscope, a 3-pinhole aper-ture, a spot-patterned plate, a Piezo z-stage, and a CCD camera. The 3-pinhole aperture was attached directly on top of a 20× objective lens (UMPlanFL N, Olympus), and a 1.6× magnification changer was used. Thus, the total magnification was 32×. For accurate z position-ing of the spot-patterned plate, a feedback-controlled Piezo z-stage (Thorlabs Inc.) with a resolution of 10 nm was mounted on an inverted microscope (IX71, Olym-pus). The defocused images were captured using a 12-bit cooled CCD camera (DP72, Olympus) with a resolution of 1360 × 1024 pixels. The halogen light was filtered through a 589 nm (sodium D-line) band-pass optical fil-ter (10 nm bandwidth), and illuminated on to the spot plate.
The aperture with the three pinholes was fabricated by means of a Si-DRIE (Deep Reactive-Ion Etching) process.
(5)
n1(∂D/∂z)1=n2(∂D/∂z)2=C
(6) n=f∂D∂z=
C
∂D∂z
The three pinholes each had a diameter of 1.5 mm and were aligned equilaterally. The diameter (d) of the circle circumscribed around the three pinholes was defined to be the pinhole separation, and was limited by the open-ing diameter of the objective lens. The pinhole separa-tion was 4.0 mm in the present study. The spot-patterned glass plate was prepared by chrome sputtering and wet etching. The transparent spots each had a diameter of 3 μm and were evenly distributed in a pattern with 50 μm lateral and longitudinal spaces on the opaque chrome surface. For accurate analysis, the intensity peaks of the spot images were determined using the Gaussian sub-pixel searching method. Certified liquids (Cargille Labs Inc., USA) with known RIs (nD) of 1.300, 1.400, 1.500, 1.600, and 1.700 at 25 °C were used for calibration; these values had a variation of 0.0002 RIU. Room temperature was controlled at 25 °C.
Result and discussion
A full-field defocused image of the transparent spots is shown in Fig. 4a, in which the whole field-of-view con-sists of 5 × 3 spot grid patterns. As shown, micro image defocusing was successfully achieved by dividing the optical path through the simple attachment of the three pinholes behind the objective lens. In Fig. 4b, the defo-cused spot images that were captured for the sample RIs have been categorized according to changes in z position of a spot. This summary shows, qualitatively, that the image separation (D) increases as the spots move away from the focal plane, and that the rate of change in the image separation (ΔD/Δz) decreases with increasing RI.
The intensity peaks of the spot images were found using sub-pixel resolution following their extraction from the digital images using a Gaussian sub-pixel peak fitting technique. The image separations (D–D0) were calculated with the spot locations (z–z0), and the result-ing relationship is shown in Fig. 5a. The uncertainties of the image separations were estimated to be less than 0.008 pixels for all the data points. This range of uncer-tainties falls well within the data symbols in Fig. 5a. For all values of RI, the image separation increased linearly with increasing z location, and the R-squared values for the best-fit lines are estimated to be greater than 0.99995. The rate of change of image separation with z location (the slopes of the curves, ∂D/∂z) decreases
with RI, and ranges from 1.683 pixel/μm for 1.300 RIU to 1.286 pixel/μm for 1.700 RIU. Figure 5b represents the experimentally determined correlation between RI and (∂D/∂z). The values of (∂D/∂z) have been obtained from the fits of the linear curves through the data points in Fig. 5a. The data points of (∂D/∂z) with change in RI were substituted in Eq. 6, and the R-squared value was found to be 0.99952. We therefore propose that the formula derived in Eq. 6 is sufficient to be considered as a calibration. The constant C was determined to be 2.183 RIU (pixel/μm) by means of a least square curve fit. Equation 6 was then used, with the determined value for C, as a calibration formula for the subsequent RI measurements.
Fig. 3 Experimental setup; the 3‑pinhole aperture has 1.5 mm diameter pinholes (d) and 4 mm of the pinhole space (d’). The 10 nm resolution z‑stage with the 3 μm‑spot patterned plate is mounted on the microscope
Page 5 of 6 Yoon et al. Micro and Nano Syst Lett (2017) 5:9
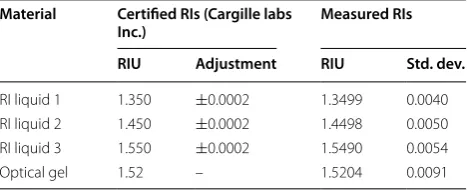
In order to evaluate the proposed method of refrac-tometry with the experimentally determined calibration curve, RI measurements of three liquids and an optical gel (Cargille Labs Inc., USA) with certified RI values, were performed. The RI values of the three certified liquids were 1.35, 1.45, and 1.55 RIU; the value for the optical gel was 1.52 RIU. Table 1 summarizes all the certified and measured RI values with their deviations between the cer-tifications and measurements. For the certified RI liquids and the optical gel, the deviations between certifications and measurements ranged from 0.0001 to 0.001 RIU.
Conclusion
A simple method for refractometry that utilizes an image defocusing technique with a 3-pinhole aperture has herein been proposed. For the proposed method, ana-lytical formulae were derived by considering the imag-ing optics, and these were verified experimentally. The resultant formula, which can be further used in calibra-tion, is given as n=C/(∂D/∂z) where the constant, C,
was determined to be 2.183 RIU (pixel/μm) for the opti-cal layout used in the present study. Using this opti- calibra-tion funccalibra-tion, the image defocusing technique was used to measure the RI of a range of materials with certified RI values. The demonstration showed a good accuracy with a difference of the order of about 10−4 RIU between
the certified and measured values. The proposed refrac-tometry therefore has the potential to be used as a simple method for the measurement of RI values in both liquid and gel materials. Due to its simple optical layout, the proposed refractometry could be reasonably accessible to most laboratories, and would be a good option for many RI-based sensing applications.
Authors’ contributions
SYY and JCH has fabricated the device, also carried out the experimental study and drafted the manuscript. SY supervised the project and completed the manuscript. All authors read and approved the final manuscript.
Author details
1 Department of Biomedical Science & Engineering, Gwangju Institute of Sci‑
ence and Technology (GIST), Gwangju 61005, Republic of Korea. 2 School
of Mechanical Engineering, Gwangju Institute of Science and Technology (GIST), Gwangju 500‑712, Republic of Korea. 3 Present Address: Pusan National
University, Busan, Korea.
Competing interests
The authors declare that they have no competing interests.
Funding
This material is based upon work supported by the National Research Founda‑ tion of Korea (NRF) grant funded by the Korea government (MSIP) (NRF‑ 2016M3A7B4910556) and the Industrial Technology R&D program of MOTIE/ KEIT. [2016 (No.10062533)].
Received: 15 November 2016 Accepted: 13 January 2017
References
1. Brice BA, Halwer M (1951) A differential refractometer. J Opt Soc Am 41:1033–1037
2. Zamora V, Diez A, Andres MV, Gimeno B (2011) Refractometric sensor based on whispering‑gallery modes of thin capillaries. Opt Express 15:12011–12016
3. Bernardi A, Kiravittaya S, Rastelli A, Songmuang R, Thurmer DJ, Benyoucef M, Schmidt OG (2008) On‑chip Si/SiOx microtube refractometer. Appl Phys Lett 88:094106
4. Wang P, Brambilla G, Ding M, Semenova Y, Wu Q, Farrell G (2011) High‑ sensitivity, evanescent field refractometric sensor based on a tapered, multimode fiber interference. Opt Lett 36:2233–2235
Fig. 5 a Image separation (D–D0) vs (z–z0) according to the RIs and b the RI vs ∂D/∂z; the calibration curve
Table 1 Results of RI measurements
Material Certified RIs (Cargille labs
Inc.) Measured RIs
RIU Adjustment RIU Std. dev.