https://doi.org/10.5194/ms-8-337-2017
© Author(s) 2017. This work is distributed under the Creative Commons Attribution 3.0 License.
A new methodology to identify minimum strain
anatomical lines based on 3-D digital image correlation
Jorge Barrios-Muriel, Francisco Javier Alonso Sánchez, David Rodríguez Salgado, and Francisco Romero-Sánchez
Department of Mechanical Engineering, Energy and Materials, University of Extremadura, Avda. de Elvas s/n, 06006, Badajoz, Spain
Correspondence to:Jorge Barrios-Muriel ([email protected])
Received: 14 April 2017 – Revised: 5 October 2017 – Accepted: 19 October 2017 – Published: 16 November 2017
Abstract. Today there is continuous development of wearable devices in various fields such as sportswear, or-thotics and personal gadgets, among others. The design of these devices involves the human body as a support environment. Based on this premise, the development of wearable devices requires an improved understanding of the skin strain field of the body segment during human motion. This paper presents a methodology based on a three dimensional digital image correlation (3D-DIC) system to measure the skin strain field and to estimate anatomical lines with minimum deformation as design criteria for the aforementioned wearable devices. The errors of displacement and strain measurement related to 3-D reconstruction and out-of-plane motion are inves-tigated and the results are acceptable in the case of large deformation. This approach can be an effective tool to improve the design of wearable devices in the clinical orthopaedics and ergonomics fields, where comfort plays a key role in supporting the rehabilitation process.
1 Introduction
Understanding of the skin’s properties during human motion is critical in the design of any device that is in contact with the human body. Muscle contractions cause displacements in the soft tissues and deformations of the skin that even-tually cause chafing or bedsores and general discomfort at the human-device interface. Thus, skin strain analysis may provide an insight into the design of devices where the me-chanical loads on the skin must result in comfort and safety. These loads produce tangential and normal strain that can cause skin injuries. Normal strain to the skin is related to ul-cers and bedsores and tangential strain to wounds and chaf-ing (Vilhena and Ramalho, 2016; Kwiatkowska et al., 2009). The latter are the most common cases. Thus, only tangential strain related to these injuries is analysed here. A new design trend has emerged around the idea that the products in con-tact the human body should be on minimum strain anatomi-cal lines, namely Lines of Non-Extension (LoNEs). This ap-proach based on skin strain analysis was first proposed in the work of Iberall (1964) and was continued by Newman et al. (2005) to improve the mobility of astronauts. Today,
this methodology is used in a variety of applications, includ-ing the design of a prosthetic socket (Lin et al., 2016), or-thoses (Domingues et al., 2011), exoskeletons for gait assis-tance (Wehner et al., 2013) and functional clothes (Seo et al., 2013), among others.
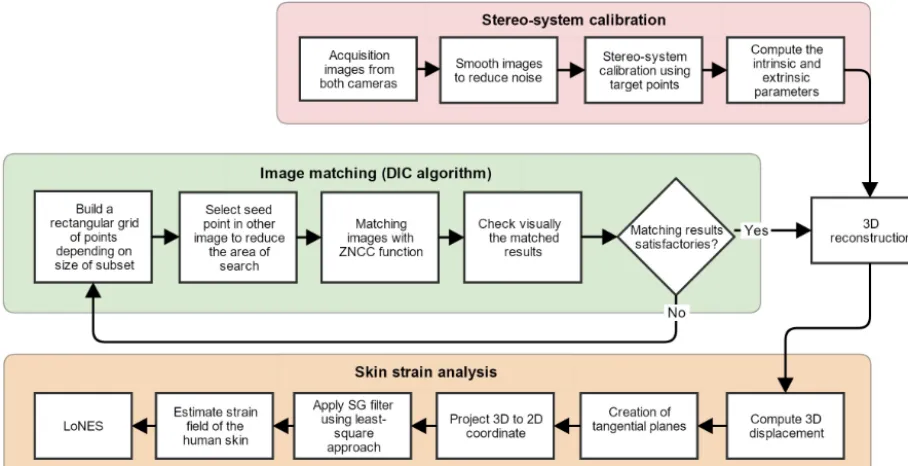
Figure 1.Flowchart of the methodology of 3D-DIC algorithm and skin strain analysis.
At present, there is no standard procedure for skin strain analysis. Different techniques and technologies have been used to this end: magnetic resonance imaging (Tran et al., 2007), optical coherence tomography (Hendriks et al., 2006), ultrasound (Hendriks et al., 2003), 3-D scanning (Van den Herrewegen et al., 2014), multiple-view stereo matching (Thabet et al., 2014; Kimura et al., 2008), motion capture systems (Mahmud et al., 2010) and digital image corre-lation (DIC) (Staloff et al., 2008; Evans and Holt, 2009; Miura et al., 2012; Yoneyama, 2010; Obropta and Newman, 2016). At the same time, the procedure to calculate skin strain depends on the technology used. The most commonly used procedures for this purpose combine optical techniques with finite strain theory and the strain gauge rosette method (Obropta Jr., 2015; Evans and Holt, 2009; Miura et al., 2012; Staloff et al., 2008). The finite strain theory combined with 3-D digital image correlation (3D-DIC) has been shown to be the most accurate method as it provides the highest spatial resolution to measure the skin strain field during movement (Miura et al., 2012; Obropta Jr., 2015; Staloff et al., 2008). Commercial DIC systems have been used successfully to an-alyze 3-D skin strain (Moerman et al., 2009; Obropta and Newman, 2016). However, DIC systems are expensive and unaffordable in many cases. The objective of this work is to present a low-cost methodology to perform skin strain analy-sis using the 3D-DIC approach. In the following sections we present the proposed methodology and a series of validation tests performed on different objects. Then the methodology is applied to the human body, specifically to the ankle joint complex. To this end, speckle patterns were applied to the skin, and the principles of image correlation and stereo
trian-gulation were used to measure 3-D deformation of the body segment. The skin strain field was then calculated to obtain the anatomical lines with minimum strain (LoNEs) using the finite strain theory. Based on these LoNEs, the basic structure of the wearable device was optimized in order to improve comfort and usability.
2 Methodology
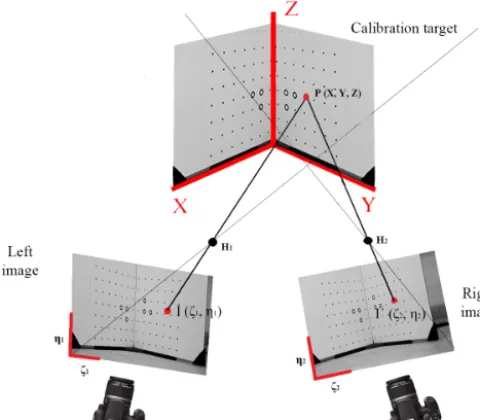
Figure 2.Scheme of the calibration process using an object with know control points.
2.1 Stereo-system calibration
Camera calibration is a necessary step in order to create a metric relation between the captured 2-D images and the 3-D surface. The main goal of this process consists in determin-ing the intrinsic and extrinsic parameters of each camera. On the one hand, the geometric properties of the camera such as focal length, principal axis and sensor size are related to the intrinsic parameters and on the other hand, the relative positions or/and orientation of the camera with respect to a world coordinate system are related to the extrinsic parame-ters. Different methods to calibrate stereo systems have been presented in the literature, but the Direct Linear Transforma-tion (DLT) is the basis of most of the reported calibraTransforma-tion techniques. Its principle is to calculate the intrinsic and ex-trinsic parameters from a known object with control points (calibration target).
In this work we adopt the DLT algorithm (Abdel-Aziz and Karara, 1971) modified by Hatze (1988) and implemented in MatLab®by Genovese et al. (2011). This method is based on the pinhole model camera assumption, where the cam-era aperture is described as a point and no lenses are used to focus light. To make the transformation from sensor coordi-nates to world coordicoordi-nates we apply a rigid body transforma-tion where the vector of interest is multiplied by a rotatransforma-tion matrix (intrinsic parameters) and added a translation vector (extrinsic parameters) as follows:
ζ1−ζ2=l·sζ
(MxxX+MxyY+MxzZ+δx) (MzxX+MzyY+MzzZ+δz)
(1)
η1−η2=l·sη
(MyxX+MyyY+MyzZ+δy) (MzxX+MzyY+MzzZ+δz)
(2)
whereζ andηare the 2-D coordinate point onto camera sen-sor,lthe focal length andsζ,sη, the scale factors that repre-sent ratios between lengths of sensor and the world coordi-nate systems.Mabandδa(a, b=x, y, z) are the three inde-pendent components of the matrix rotation and the translation vectors, respectively.X,Y,Zare the point coordinates in the global coordinate system.
In the DLT method the goal is to simplify the solution of both Eqs. (1) and (2) by substituting the unknown parame-ters with a series of constants calledLn. The basic method uses 11 parameters, and depends on how many corrections are to be done to the optical system (such as spherical dis-tortion, astigmatism, etc). For more details see Abdel-Aziz and Karara (1971), Genovese et al. (2011). This constants are functions of the extrinsic and intrinsic parameters of each camera (Abdel-Aziz and Karara, 1971), thus the Eqs. (1) and (2) can be rearranged as:
ζ= L1X+L2Y+L3Z+L4
L9X+L10Y+L11Z+1
(3)
η= L5X+L6Y+L7Z+L8
L9X+L10Y+L11Z+1
(4)
Each control point provides two equations, so a minimum of n = 6 control points is necessary to extract the entire set of 11 DLT parameters. However, more control points are used to reduce the experimental errors. In this work 98 control points were used (Fig. 2)
The result of the camera calibration step is a transforma-tion that assigns a 3-D world point P(X, Y, Z) into a 2-D sen-sor image point I(ζ, η) assuming that the points P, I and I0and the pinhole H are collinear (collinearity condition of the DLT method).
2.2 Image matching
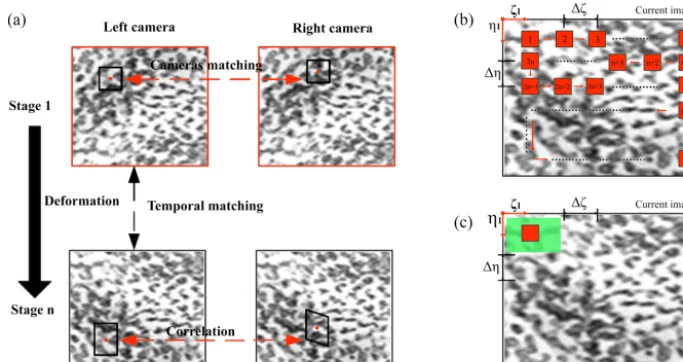
Figure 3.(a)Temporal and cameras match process.(b)Typical path performed by each reference subset during the search of matched area. Red squares are the positions of a reference subset by all current image during typical path.(c)seed-point approach to correlate subsets. Green squared is the reduced area of search.1ζand1ηare the distance between centre of subsets andζ1,η1the sensor coordinate system.
similarity between subsets is used. The zero-mean normal-ized correlation criterion (ZNCC) has been strongly recom-mended for practical use since it is robust against changes in image’s scale and intensity offset (Pan et al., 2007, 2010). ZNCC is optimized using a Newton-Raphson (NR) method to calculate the displacement at each point.
9=
Pb a
Pb a
f(ζ, η)− ¯f g(ζ0, η0)− ¯g q
Pb a
Pb a
f(ζ, η)− ¯f2 q
Pb a
Pb a
g(ζ0, η0)− ¯g2 (5)
where9is the ZNCC,f(ζ, η) andg(ζ0, η0) are the greyscale values at the pixel (ζ,η) in the reference and shift window, respectively.f¯is the mean value off(ζ, η) over the reference subset of dimension a×b pixels andg¯ is the mean value ofg(ζ0, η0) over the subset of current image. The maximum value of9 is the best match between two images.
In this work, to optimize the computation time of the cor-relation function, a similar seed-point approach was used (Pan and Li, 2011) which allowed for the eliminating of the repeating redundant calculations involved in the correlation process. An initial value for the centre of the first subset ref-erence is chosen manually in the current image in order to reduce the search area of reference subset in all images. The displacement obtained is added to the next search area (green squared in Fig. 3c) of the next reference subset and thus it moves together with the next reference subsets. The size of square subset in our analysis was 40 pixels. Moreover, an unsharp masking was applied to each image to eliminate the blur and improve the functioning of the correlation function.
2.3 3-D reconstruction
After the matching process for each stage is carried out, the 2-D matched points in each image can be converted into 3-D coordinates by applying the DLT method. Thus, the calibra-tion parameters of the stereo cameras and the corresponding 2-D matched points in the left and right images are substi-tuted on Eqs. (3) and (4). By solving both equations using a linear least-squares approach, one can obtain the unknown position of each point with respect to the global coordinate system. By repeating this operation for each stereo matched point, the 3-D shape of the surface can be obtained.
2.4 Skin strain computation
compared to NR process (Tang et al., 2010; Quan et al., 2008; Yoneyama, 2011; Begonia et al., 2017). For this reason, an approach proposed by Tang et al. (2010) based a 2-D SG fil-ter differentiator is used in this work in order to obtain the strain field. The main idea of this process is to use the 3-D coordinates of eight neighbour points to calculate the strain of pointai,j and to assume that the underlying displacement field can be fitted with a polynomial representation. With this process the noise in the computed displacement field can be easily removed as the SG filter generally preserves features of the distribution such as relative maxima, minima and width. The derivatives of the displacement field obtained from the SG are computed using the coefficients of the fitted polynomial. The process requires the following steps:
1. Calculate in each stage a tangential plane using the neighbour points of pointai,j. Then, the 3-D coordinate of the points are projected onto new tangential plane (Ap) to obtain 2-D points (χi,j).Apis an arbitrary 2-D coordinate system whose axes (px,py) coincide with tangential directions of the human skin.
2. Apply the SG filter and compute the unknown polyno-mial coefficients using the least-squares method. The SG filter method is based on a polynomial fit to the data and the derivatives from the polynomial. To esti-mate the strain using 2-D SG filter we use a polyno-mial regression (of degreen) on a distribution of 2M+1 by 2M+1 points (of widthM) around the each point O(0,0) to determine the derivatives (dx,dy) of the dis-placements with respect to the new 2-D coordinate sys-tem (Ap) calculated in the above step. Thus, for M = 1, 9 grid points are obtained (the current point O and eight neighbor points). Mathematically, strains can be repre-sented as:
εxx(i, j)= ∂u ∂x =F
1,0
nx,ny(i, j) (6)
εyy(i, j)= ∂v ∂y =F
0,1
nx,ny(i, j) (7)
γxy(i, j)= ∂u ∂y+
∂v ∂x=F
0,1
nx,ny(i, j)+F 1,0
nx,ny(i, j) (8)
whereu,vare the displacement,F is the digital differ-entiator,nx andny are the polynomial orders and i, j the evaluated points. When applying the 2-D SG filter to the px-direction the dx=1 and dy=0 and in py -direction,dx=0 anddy=1. The 2-D SG digital differ-entiator can be expressed as:
Fndxx,n,dyy(i, j)= M X i=−M M X j=−M
hdix,dyhdjx,dygi,j
1xdx1ydy (9)
wheregi,j represents the displacements,h dx,dy
i,j the con-volution weights for data points (ai,j)=(−mi,−mj) to (mi, mj), beingM the width of the local subregion of the displacement centered at the current point (i, j)=
(0,0).1x and1y are the distances between each data points.
To avoid large errors at the boundary when the SG digi-tal differentiator is employed, the outliers of the data are excluded. These outliers are produced by the SG digital differentiator in the boundary of the cloud points, pro-viding erroneous information (for a more detailed ex-planation see Pan et al., 2007). In this work the parame-tersnx, ny, mi, mj=2 are used (2nd polynomial order of 5×5 grid of data points).
2.5 Calculation of LoNES
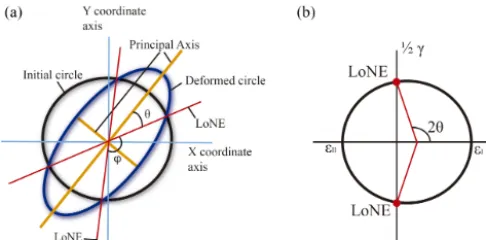
Based on the previous skin strain analysis, we can identify the LoNEs applying the strain ellipse theory. To help under-stand the concept of LoNEs, we shall refer to the finite strain ellipse and Mohr’s circle. In Fig. 4 the concept of the direc-tion of non-extension is presented. In the ellipse, there are two lines with no extensional strain (LoNEs). These LoNEs only exist if the principal strains have opposite signs, and the physical meaning is that the material is undergoing defor-mation in one direction and compression in the orthogonal direction. LoNEs can be conceptualized as directions where there is no extensional strain along the two lines formed by the intersection of the unit circle and deformed state. In this case, there are two directions where there is only distor-tion (change of direcdistor-tion) and no deformadistor-tion (ε=0). In the present work, when referring to the directions of LoNES, we shall assume that the skin is a two-dimensional material, and the strain field correspond to tangential component of strain as previously mentioned.
The method used to obtain the directions of the LoNEs be-gins with the calculation of the principal direction of strain using the polar decomposition theorem. An eigenvector anal-ysis of the local strain field at each data point is performed to obtain the eigenvectors (v) and eigenvalues (λ) of the strain tensor. The LoNES’s directions can be calculated by the fol-lowing expression:
θij=arctan s
−λ1ij
λ2ij !
(10)
Figure 4. Conceptual representation of LoNES with finite strain ellipse (a)and Mohr’s circle(b). The black circle represents the initial (undeformed) shape, the blue ellipse the deformed shape, and the orange lines the principal strain directions.
φij=arccos w1
ij w2ij
(11)
wherew1ij andw2ij are the directions of non-extension and φij the angle between the vectors of these directions. To se-lect the most favourable areas we use the root mean square (RMS) of the whole angle,φ, defined as:
RMS=
v u u t
1
N N X
i=1
φij (12)
as a criteria (µ) to determine if the areas is favourable or not. This “filtered” factor is based on the condition that the most favourable areas must have a valueφ−90◦lower to RMS.
µ=
if φij−90◦<= RMS→Area favorable
if φij−90◦ > RMS→Area unfavorable (13)
By using this factor, we ensure the selection of areas with minimal distorsion.
3 Experimental test to validate methodology
DIC measurements and skin strain analysis described herein have not been reported previously. Hence, a series of valida-tion tests were performed to assess overall accuracy of the measurement using this methodology. The system can offer many advantages in biomechanics and rehabilitation engi-neering fields as it allows to gather information over surface of human skin in 3-D in large or small region of interests. Using this system the spatial resolution of measurements is acceptable to large deformation, on the order of 0.5−1 mm2. This is a merit due to the hardware system used in this work consist on two basic DSLR cameras and not uses a high-speed or high resolution camera systems.
Table 1.Errors (mm), mean and SD of 5 samples in each horizontal position (range of displacement) of Test B.
10 mm 20 mm 30 mm 40 mm 50 mm 60 mm
Sample 1 0.1213 0.0865 0.2839 0.4207 0.3077 0.2396 Sample 2 0.1932 0.1370 0.2063 0.0535 0.1535 0.0623 Sample 3 0.1121 0.1910 0.0531 0.0531 0.0931 0.1131 Sample 4 0.0957 0.0362 0.0392 0.0962 0.0162 0.1032 Sample 5 0.0832 0.0490 0.1420 0.0790 0.0990 0.1290
Mean 0.1211 0.0999 0.1449 0.1405 0.1339 0.1295 SD 0.0429 0.0642 0.1033 0.1577 0.1088 0.0663
3.1 Test A: error in 3-D reconstruction
To verify the effectiveness of the 3-D reconstruction of the proposed method, a cylinder with a white and black speckle pattern was used (Fig. 5a). The sample was measured with a caliber and the measured diameter was 73 mm (±0.05 mm). The roll was then captured by both cameras and 3D-DIC process was performed using a grid of 441 points spaced 12 pixel×12 pixels between points (3.35 mm×3.35 mm) over a surface of 261 pixel×372 pixel. The 3-D coordi-nate of points obtained in 3-D reconstruction are shown in Fig. 5b. The first row of these 3-D points was imported to a CAD/CAE environment to compare with an ideal circle of same dimensions. To do so, a circle of diameter 73 mm using both end imported points of the first row was created (Fig. 5c). The resulting reconstructed 3-D shape of the cylin-der differs by an average of 0.11 mm (standard deviation 0.13 mm) in diameter relative to the theorical cylinder. The maximum deviation between curve of 3-D points and ideal circle was 0.23 mm (Fig. 5c). The estimated errors are less than 1 % over real measure diameter.
3.2 Test B: related to rigid-body translating
To determine the error related to the displacement field, a rigid body motion of the above sample was performed. To estimate this error, the cylinder was placed over caliber (po-sitioned horizontally on plane surface). The test consists in translating the cylinder along the horizontal axes of caliber 10 mm and take 5 pairs of images (5 samples) in each posi-tion. The displacement ranges from 10 to 60 mm. The 3D-DIC parameters were the same as above test. Table 1 shows the errors, mean and SD of the errors in displacements for 5 different samples. The value of each sample corresponds to mean of variation of displacement of all 3-D points recon-structed. The estimated errors are less than 2 % over the real measure (10 mm).
3.3 Test C: related to out-of-plane displacement
Figure 5. (a)Image of cylindrical sample with black and white speckle pattern. (b) 3-D cloud point reconstructed using 3-D stereo-system proposed.(c)Curvature check of 3-D cloud points with respect to real measured diameter of cylindrical sample in SolidWorks.
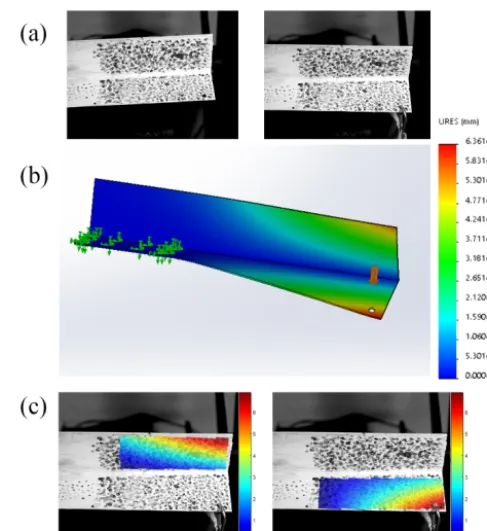
CAE tool. The piece was anchored to a structure with a ex-ternal load in the other end and the images were acquired in both reference and when the external load was applied (Fig. 6a). The same situation was reconstructed in CAE tool to perform a static simulation. The results of test C are shown on Fig. 6. The displacements out of the plane are also cal-culated correctly and have approximately the same distribu-tion and magnitude than the simuladistribu-tion in CAE. The max-imum value of displacement was 6.361 mm and in the pro-posed method 6.5342 mm, which represents a relative error of 2–3 %. Although the difference of these measures is rel-atively large ('2×10⁻²mm), the accuracy of the method can be considered sufficient for measure large deformations suffered by human skin under muscle contractions and body segment motions which reach values of 8–10 mm in the foot during human gait (Blenkinsopp et al., 2012; Schmeltzpfen-ning et al., 2011) and even 10–15 mm in other anatomical areas such as shoulder and knee (Mahmud et al., 2010).
Figure 6. (a) Images of reference and deformed stage of the test piece of aluminum with the white and black speckle pattern. (b)Simulation of test in CAE enviroment.(c)Results of displace-ment using 3D-DIC methodology proposed.
3.4 Test D: error in map strain
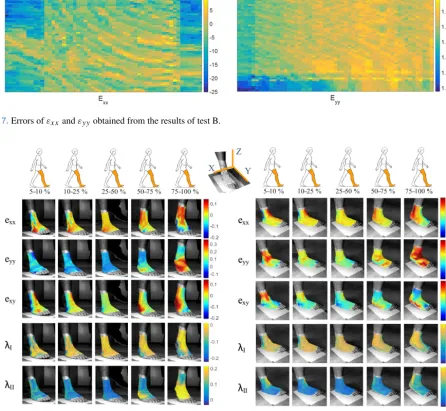
To assess errors in strain field, a “null strain analysis” from previous test B was performed. Because the sample was sub-jected to a rigid body motion, any non-zero component of the tangential strain reflects an error resulting from the mea-surement (Fig. 7). Mean values and SD values of εxx=
−4.3878×10⁻⁴(±1.2145×10⁻⁴) andεyy= −1.7799× 10⁻⁴ (±4.951×10⁻⁷) were found from unfiltered strain measures. Errors inεyyare three time is less thanεxxbecause the displacement in test B were inx-direction. Although the SD is aproximatelly lower that 2×10⁻⁴ and 5×10⁻⁷ for
εxx andεyyrespectively, the accuracy in strain field analysis can be considered sufficient for large strain fields.
4 Results
4.1 Ankle-foot skin stain analysis
Figure 7.Errors ofεxxandεyyobtained from the results of test B.
Figure 8.Skin strain field and principal strain on the dorso-lateral and lateral surface of the ankle-foot complex during walking.
to dorsiflexion of the joint. At the same time, the surface around the cuboid was contracted until the last phase stretch-ing cycle. The principal strains in anterior and posterior sur-face of ankle in the early and late phases (5–25 % and 75– 100 %) are dominant. In these phases of the cycle the poste-rior surface of ankle was contracted and stretched gradually respectively as the extension and contraction of Soleus and Gastrocnemius muscles causes traction of the Achilles ten-don. By contrast, the strain magnitudes around forefoot are lower in some phases due to ausence of muscle contractions and soft tissue. This does not occur in the last phase where there is a great stretching on this area.
Mapped LoNES and directions of principal strain of the dorsi-lateral and lateral surfaces of the foot are illustrated in Fig. 9. The principal strain lines across perpendicularly areas
Figure 9. (a)Principal strain lines (red and blue) and LoNES (green and pink) on the dorso-lateral and lateral surface of the ankle-foot complex during walking.(b)Zoom of LoNES in middle phase (25–50 %) for a better visualization.
because LoNEs condition are not met (see Sect. 2.5), i.e., the conditionφ−90◦>=is not applied. This may be due to the excessive distorsion in the skin during motion in the flexion and extension phases of the ankle joint.
Figure 9b shows the LoNES in middle phase when the joint ankle is similar to anatomical position. In this phase, the LoNES are directed by the outside of the foot. In the lateral view, it is shown that LoNES avoided the malleolus area in the vertical direction. Moreover, in the calf, the LoNES are perpendicular and surround the ankle joint similar to com-pression bandages.
Comparison of strain results of this work with literature is challenging since methodologies, acquisition data and calcu-lation of strain field may differ significatively between stud-ies. However, our results are within a similar range of values and directions of LoNES reported in other works (Marreiros, 2010; Ito et al., 2016). Our methodology present a significant cost reduction compared with motion capture and 3D-DIC commecial systems used in the others studies. In this work, two different views (lateral and dorso-lateral) of ankle-foot complex to analysis the skin strain has been used.
Measuring the dynamic surface of skin using stationary camera is difficult. When a large number of camera is not available, significant effort goes into determining camera placement to best image the regions of interest. With this in mid, it is difficult to capture the entire surface of the ankle-foot complex. For this reason, we choose the lateral and dorso-lateral surface to cover major area of study.
To optimize the comfort of wearable device, its properties at the interface with the skin can be modified to accommo-date the natural skin deformation pattern. The skin-device interface can be reinforced along LoNES to increase the mo-bility and usamo-bility while providing targeted support. More-over, an optimized interface (in terms of resisting tension or compression) can be designed using the the direction of prin-cipal strain to reduce the relative motion of body segment and decrease the shear forces between the skin and the device.
5 Conclusions
be-cause depends on configuration parameters which may intro-duce errors in the measurements. In this paper, it has proven its application to human skin strain analysis during gait using a non-commercial system developed for this purpose. The methodology is versatile and can be used for a large scale of experimental mechanics problems using conventional or high-speed cameras. The errors of displacement and strain measurement related to 3-D reconstruction and out-of-plane motion were investigated. The magnitude of these errors are acceptable in the case of large deformation (Genovese et al., 2011). The methodology presented in this work offers many advantages into area of biomechanics. Understanding the skin strain may be critical to the design of wearable devices and to optimize the comfort and usability. The data of LoNES could potentially be used for design orthosis and prosthetic liners. Thus, we expect that this low-cost methodology may serve to design the human-device interface in different appli-cations such as exoskeletons and ortheses/prostheses. In this sense, it is necessary to continue optimizing and including different set-ups and filtering techniques for a more robust data processing procedure. Finally, to validate and check the results present in this work, more analysis in other people with and without motor pathologies it is necessary to evalu-ated the variability and to know the behaviour of the LoNES among these subjects.
Data availability. All the data used in this manuscript can be ob-tained upon request from the corresponding author.
Competing interests. The authors declare that they have no con-flict of interest.
Acknowledgements. This work was supported by the Spanish Ministry of Economy and Competitiveness under project DPI2015-65959-C3-3R, co-financed by the European Union through EFRD funds and Gobierno of Extremadura under project TPR010.
Edited by: Andreas Müller
Reviewed by: Petar Stupar and one anonymous referee
References
Abdel-Aziz, Y. and Karara, H. M.: Direct linear transformation into object space coordinates in close-range photogrammetry, in: Pro-ceedings of the Symposium on Close-Range Photogrammetry, University of Illionois, Urbana-Champaign, Illionois, USA, 1– 18, 1971.
Annaidh, A. N., Bruyère, K., Destrade, M., Gilchrist, M. D., Mau-rini, C., Otténio, M., and Saccomandi, G.: Automated estimation of collagen fibre dispersion in the dermis and its contribution to the anisotropic behaviour of skin, Ann. Biomed. Eng., 40, 1666– 1678, https://doi.org/10.1007/s10439-012-0542-3, 2012a.
Annaidh, A. N., Bruyère, K., Destrade, M., Gilchrist, M. D., and Ot-ténio, M.: Characterization of the anisotropic mechanical prop-erties of excised human skin, J. Mech. Behav. Biomed. Mater., 5, 139–148, https://doi.org/10.1016/j.jmbbm.2011.08.016, 2012b. Begonia, M., Dallas, M., Johnson, M. L., and Thiagarajan, G.:
Comparison of strain measurement in the mouse forearm using subject-specific finite element models, strain gaging, and digital image correlation, Biomech. Model. Mechan., 16, 1243–1253, https://doi.org/10.1007/s10237-017-0885-7, 2017.
Blenkinsopp, R., Harland, A., Price, D., Lucas, T., and Roberts, J.: A method to measure dynamic dorsal foot sur-face shape and deformation during linear running using digital image correlation, Procedia Engineer., 34, 266–271, https://doi.org/10.1016/j.proeng.2012.04.046, 2012.
Chu, T. C., Ranson, W. F., and Sutton, M. A.: Applications of digital-image-correlation techniques to experimental mechanics, Exp. Mech., 25, 232–244, https://doi.org/10.1007/BF02325092, 1985.
Domingues, A. R., Marreiros, S. P., Martins, J. M., Silva, M. T., and Newman, D. J.: Skin Strain Field Analysis of the Human Ankle Joint, in: 4◦Congresso Nacional de Biomecânica (CNB2011), Coimbra, Portugal, 2011.
Elguedj, T., Réthoré, J., and Buteri, A.: Isogeometric analysis for strain field measurements, Comput. Method. Appl. M., 200, 40– 56, https://doi.org/10.1016/j.cma.2010.07.012, 2011.
Evans, S. L. and Holt, C. A.: Measuring the mechanical proper-ties of human skin in vivo using digital image correlation and finite element modelling, J. Strain Anal. Eng., 44, 337–345, https://doi.org/10.1243/03093247JSA488, 2009.
Geerligs, M., Oomens, C., Ackermans, P., Baaijens, F., and Peters, G.: Linear shear response of the upper skin layers, J. Biorheol., 48, 229–245, https://doi.org/10.3233/BIR-2011-0590 2011a. Geerligs, M., Van Breemen, L., Peters, G., Ackermans, P., Baaijens,
F., and Oomens, C.:In vitroindentation to determine the me-chanical properties of epidermis, J. Biomech., 44, 1176–1181, https://doi.org/10.1016/j.jbiomech.2011.01.015, 2011b. Genovese, K., Lee, Y. U., and Humphrey, J. D.: Novel optical
sys-tem forin vitroquantification of full surface strain fields in small arteries: I. Theory and design, Comput. Method. Biomec., 14, 213–225, https://doi.org/10.1080/10255842.2010.545823, 2011. Gu, X., Liang, Y., and Fu, S.: Evaluation and optimiza-tion of digital image correlaoptimiza-tion processing variables us-ing genetic algorithm, J. Strain Anal. Eng., 51, 408–415, https://doi.org/10.1177/0309324716645704, 2016.
Hatze, H.: High-precision three-dimensional photogrammetric cal-ibration and object space reconstruction using a modified DLT-approach, J. Biomech., 21, 533–538, 1988.
Hendriks, F. M., Brokken, D., Van Eemeren, J. T. W. M., Oomens, C. W. J., Baaijens, F. P. T., and Horsten, J. B. A. M.: A numerical-experimental method to characterize the non-linear mechani-cal behaviour of human skin, Skin Res. Technol., 9, 274–283, https://doi.org/10.1016/j.medengphy.2005.07.001, 2003. Hendriks, F. M., Brokken, D., Oomens, C. W. J., Bader, D. L., and
Baaijens, F. P. T.: The relative contributions of different skin lay-ers to the mechanical behavior of human skin in vivo using suc-tion experiments, Med. Eng. Phys., 28, 259–266, 2006. Iberall, A. S.: The Use of Lines of Nonextension to Improve
Ito, K., Maeda, K., Fujiwara, I., Hosoda, K., Nagura, T., Lee, T., and Ogihara, N.: Dynamic measurement of surface strain distribution on the foot during walking, J. Mech. Behav. Biomed., 69, 249– 256, https://doi.org/10.1016/j.jmbbm.2016.12.009, 2016. Kimura, M., Mochimaru, M., and Kanade, T.: Measurement
of 3D foot shape deformation in motion, in: Proceedings of the 5th ACM/IEEE International Workshop on Projec-tor camera systems, ACM, New York, USA, 10:1–10:8, https://doi.org/10.1145/1394622.1394636, 2008.
Kwiatkowska, M., Franklin, S., Hendriks, C., and Kwiatkowski, K.: Friction and deformation behaviour of human skin, Wear, 267, 1264–1273, 2009.
Lin, B., Moerman, K. M., McMahan, C. G., Pasch, K. A., and Herr, H. M.: Low-Cost Methodology for Skin Strain Measurement of a Flexed Biological Limb, IEEE T. Bio-Med. Eng., PP, 3564–3567, https://doi.org/10.1109/TBME.2016.2626442, 2016.
Luo, P. F., Chao, Y. J., Sutton, M. A., and Peters, W.-H.: Accurate measurement of three-dimensional deformations in deformable and rigid bodies using computer vision, Exp. Mech., 33, 123– 132, https://doi.org/10.1007/BF02322488, 1993.
Mahmud, J., Holt, C. A., and Evans, S. L.: An innovative appli-cation of a small-scale motion analysis technique to quantify human skin deformation in vivo, J. Biomech., 43, 1002–1006, https://doi.org/10.1016/j.jbiomech.2009.11.009, 2010.
Marreiros, S. S. P.: Skin Strain Field Analysis of the Human Ankle Joint, Relation, 2, 2–7, 2010.
Miura, N., Arikawa, S., Yoneyama, S., Koike, M., Murakami, M., and Tanno, O.: Digital image correlation strain analy-sis for the study of wrinkle formation on facial skin, Jour-nal of Solid Mechanics and Materials Engineering, 6, 545–554, https://doi.org/10.1299/jmmp.6.545, 2012.
Moerman, K. M., Holt, C. A., Evans, S. L., and Simms, C. K.: Digital image correlation and finite element mod-elling as a method to determine mechanical properties of human soft tissue in vivo, J. Biomech., 42, 1150–1153, https://doi.org/10.1016/j.jbiomech.2009.02.016, 2009.
Newman, D., Hoffman, J., Bethke, K., Blaya, J., Carr, C., and Pitts, B.: Astronaut bio-suit system for exploration class mis-sions, NIAC Phase II Final Report, 2005.
Obropta, E. W. and Newman, D. J.: Skin strain fields at the shoul-der joint for mechanical counter pressure space suit development, in: 2016 IEEE Aerospace Conference, Big Sky, MT, USA, 1–9, https://doi.org/10.1109/AERO.2016.7500744, 2016.
Obropta Jr., E. W.: On the deformation of human skin for mechan-ical counter pressure space suit development, PhD thesis, Mas-sachusetts Institute of Technology, 2015.
Pan, B. and Li, K.: A fast digital image correlation method for deformation measurement, Opt. Laser. Eng., 49, 841–847, https://doi.org/10.1016/j.optlaseng.2011.02.023, 2011.
Pan, B., Xie, H., Guo, Z., and Hua, T.: Full-field strain mea-surement using a two-dimensional Savitzky-Golay digital dif-ferentiator in digital image correlation, Opt. Eng., 46, 033601, https://doi.org/10.1117/1.2714926, 2007.
Pan, B., Xie, H., and Wang, Z.: Equivalence of digital image corre-lation criteria for pattern matching, Appl. Opt., 49, 5501–5509, https://doi.org/10.1364/AO.49.005501, 2010.
Quan, C., Tay, C. J., Sun, W., and He, X.: Determination of three-dimensional displacement using two-dimensional
digital image correlation, Appl. Optics, 47, 583–593, https://doi.org/10.1364/AO.47.000583, 2008.
Réthoré, J., Hild, F., and Roux, S.: Shear-band capturing using a multiscale extended digital image correlation technique, Comput. Method. Appl. M., 196, 5016–5030, https://doi.org/10.1016/j.cma.2007.06.019, 2007.
Schmeltzpfenning, T., Plank, C., Fritz, B., Aswendt, P., and Grau, S.: 3D dynamic behaviour of foot structure may provide addi-tional information for last design, Footwear Science, 3, S147– S148, https://doi.org/10.1080/19424280.2011.575866, 2011. Seo, H., Kim, S.-j., Cordier, F., Choi, J., and Hong,
K.: Estimating dynamic skin tension lines in vivo us-ing 3D scans, Comput.-Aided Des., 45, 551–555, https://doi.org/10.1016/j.cad.2012.10.044, 2013.
Staloff, I. A., Guan, E., Katz, S., Rafailovitch, M., Sokolov, A., and Sokolov, S.: An in vivo study of the mechanical properties of facial skin and influence of aging using digital image speckle correlation, Skin Res. Technol., 14, 127–134, https://doi.org/10.1111/j.1600-0846.2007.00266.x, 2008. Tang, Z., Liang, J., Xiao, Z., and Guo, C.: Large
de-formation measurement scheme for 3D digital im-age correlation method, Opt. Laser Eng., 50, 122–130, https://doi.org/10.1016/j.optlaseng.2011.09.018, 2012.
Tang, Z.-Z., Liang, J., Xiao, Z.-Z., Guo, C., and Hu, H.: Three-dimensional digital image correlation system for deformation measurement in experimental mechanics, Opt. Eng., 49, 103601, https://doi.org/10.1117/1.3491204, 2010.
Thabet, A. K., Trucco, E., Salvi, J., Wang, W., and Abboud, R. J.: Dynamic 3D shape of the plantar surface of the foot using coded structured light: a technical report, J. Foot Ankle Res., 7, 1–12, https://doi.org/10.1186/1757-1146-7-5, 2014.
Tran, H. V., Charleux, F., Rachik, M., Ehrlacher, A., and Ho Ba Tho, M. C.: In vivo characterization of the mechan-ical properties of human skin derived from MRI and inden-tation techniques, Comput. Method. Biomec., 10, 401–407, https://doi.org/10.1080/10255840701550287, 2007.
Van den Herrewegen, I., Cuppens, K., Broeckx, M., Barisch-Fritz, B., Vander Sloten, J., Leardini, A., and Peeraer, L.: Dynamic 3D scanning as a markerless method to calculate multi-segment foot kinematics during stance phase: Method-ology and first application, J. Biomech., 47, 2531–2539, https://doi.org/10.1016/j.jbiomech.2014.06.010, 2014.
Vilhena, L. and Ramalho, A.: Friction of human skin against different fabrics for medical use, Lubricants, 4, 6, https://doi.org/10.3390/lubricants4010006, 2016.
Wehner, M., Quinlivan, B., Aubin, P. M., Martinez-Villalpando, E., Baumann, M., Stirling, L., Holt, K., Wood, R., and Walsh, C.: A lightweight soft exosuit for gait assistance, in: 2013 IEEE Inter-national Conference on Robotics and Automation (ICRA), IEEE, 3362–3369, https://doi.org/10.1109/ICRA.2013.6631046, 2013. Yoneyama, S.: Computing strain distributions from mea-sured displacements on a three-dimensional surface, The Japan Society of Mechanical Engineers, 10, s113–s118, https://doi.org/10.11395/jjsem.10.s113, 2010.