Attentional modulation of oscillatory activity in human visual cortex
Noriko Yamagishi,
a,* Daniel E. Callan,
bNaokazu Goda,
aStephen J. Anderson,
cYoshikazu Yoshida,
dand Mitsuo Kawato
aaATR Computational Neuroscience Laboratories, 2-2-2 Hikaridai, Seika-cho, Soraku-gun, Kyoto 619-0288, Japan bATR Human Information Science Laboratories, 2-2-2 Hikaridai, Seika-cho, Soraku-gun, Kyoto 619-0288, Japan cThe Wellcome Trust Laboratory for MEG Studies, Neurosciences Research Institute, School of Life & Health Sciences,
Aston University, Birmingham, B4 7ET, UK
dTechnology Research Laboratory, Shimadzu Corp., 3-9 Hikaridai, Seika-cho, Soraku-gun, Kyoto 619-0237, Japan
Received 18 February 2003; revised 20 May 2003; accepted 29 May 2003
Abstract
The effects of attentional modulation on activity within the human visual cortex were investigated using magnetoencephalography. Chromatic sinusoidal stimuli were used to evoke activity from the occipital cortex, with attention directed either toward or away from the stimulus using a bar-orientation judgment task. For five observers, global magnetic field power was plotted as a function of time from stimulus onset. The major peak of each function occurred at about 120 ms latency and was well modeled by a current dipole near the calcarine sulcus. Independent component analysis (ICA) on the non-averaged data for each observer also revealed one component of calcarine origin, the location of which matched that of the dipolar source determined from the averaged data. For two observers, ICA revealed a second component near the parieto-occipital sulcus. Although no effects of attention were evident using standard averaging procedures, time-varying spectral analyses of single trials revealed that the main effect of attention was to alter the level of oscillatory activity. Most notably, a sustained increase in alpha-band (7–12 Hz) activity of both calcarine and parieto-occipital origin was evident. In addition, calcarine activity in the range of 13–21 Hz was enhanced, while calcarine activity in the range of 5– 6 Hz was reduced. Our results are consistent with the hypothesis that attentional modulation affects neural processing within the calcarine and parieto-occipital cortex by altering the amplitude of alpha-band activity and other natural brain rhythms.
© 2003 Elsevier Inc. All rights reserved.
Keywords: Attention; MEG; Rhythmic activity; Alpha rhythm; Vision; Area V1
Introduction
Spatially directed attention is important for object rec-ognition and motor control and may aid information pro-cessing by enhancing neuronal responses to attended stimuli while at the same time suppressing responses to nonat-tended stimuli (Posner and Petersen, 1990). Although psy-chophysical studies have emphasized the role attention may play in high-level visual processing (Treisman and Gelade, 1980), physiological studies have shown that attentional
modulation of cell responses is possible within early visual cortex (Moran and Desimone, 1985; Luck et al., 1997), including the primary visual area (V1) (Motter, 1993; Roelfsema et al., 1998; Vidyasagar, 1998; Ito and Gilbert, 1999). The usual finding is that cell responses to a given visual pattern are increased when attention is directed to-ward it, suggesting that attention somehow acts to enhance the saliency of the pattern.
Neuroimaging studies have confirmed that selected and divided attention play an important role in human visual processing, although opinion varies as to whether area V1 is influenced by attention. A number of event-related potential (ERP) and magnetoencephalographic (MEG) studies report * Corresponding author. Fax:⫹81-774-95-1236.
E-mail address: [email protected] (N. Yamagishi).
that activity within V1 is not influenced by attention even though activity within extrastriate visual areas is (Heinze et al., 1994; Clark and Hillyard, 1996; Imada et al., 1996; Mangun et al., 1998; Martinez et al., 1999). In contrast, functional magnetic resonance imaging (fMRI) studies show that attention can enhance visual responses within human V1, as well as extrastriate cortex (Watanabe et al., 1998; Brefczynski and DeYoe, 1999; Gandhi et al., 1999; Martinez et al., 1999, 2001; Somers et al., 1999; Smith et al., 2000).
The discrepant neuroimaging results may reflect the fact that the physiological basis of electromagnetic response measures (ERP, MEG) differs from that of hemodynamic (fMRI) measures (Hamalainen et al., 1993; Logothetis et al., 2001). However, this explanation is weakened by evidence that fMRI (Tootell et al., 1995; Barnes et al., 2001; Singh et al., 2002) and MEG studies (Anderson et al., 1996, 1999; Singh et al., 2002) on early visual areas are in close
agree-ment. An alternative explanation is that the attentional mod-ulation of V1 activity observed with fMRI reflects delayed, reentrant feedback from higher visual areas (Vidyasagar, 1998; Martinez et al., 2001). This feedback hypothesis is supported by animal studies (Mehta et al., 2000) and poten-tially explains why the effects of attention are not reflected in averaged ERP responses (Martinez et al., 2001).
The nature of the attention-related activity in human V1 remains unclear. Attentional processes could lead to a mod-ulation of evoked activity that is phase-locked to the stim-ulus (ERP) and/or a change in induced oscillatory (rhyth-mic) activity that is not phase-locked to the stimulus. The latter may take the form of an event-related desynchroniza-tion or an event-related synchronizadesynchroniza-tion (Pfurtscheller and Lopes da Silva, 1999). Hemodynamic measures cannot dis-tinguish between phase-locked and non-phase-locked activ-ity, whereas electromagnetic response measures can. Both of these hypotheses were examined in this study using MEG. This technique has a spatial resolution approaching that of fMRI for shallow sources (Singh et al., 2002) and allows us to investigate both the locus of attentional mod-ulation and the effects of attention on various natural brain rhythms.
Red/green modulated gratings were chosen as our stimuli because they evoke strong responses from the occipital cortex (Engel et al., 1997; Fylan et al., 1997; Anderson et al., 1999; Anderson, 2002). Covert attention was directed either toward or away from the stimulus using a bar-orien-tation judgment task. Independent component analysis (ICA) and dipolar source modeling were used to identify the spatial origin of the recorded MEG signals. We were par-ticularly interested in the effects of attention on activity within the calcarine and parieto-occipital sulci, the former because of its disputed role in attentional processing and the latter because of its proposed role in modulating attentional demand (Vanni et al., 1997). Because oscillatory activity in humans might have a critical role in object representation and attention (Ray and Cole, 1985; Vanni et al., 1997; Tallon-Baudry and Bertrand, 1999; Fries et al., 2001), scalograms (time-varying spectral analysis) were computed to compare neural activity under both experimental condi-tions: attention directed toward the stimulus and attention directed away from the stimulus. We tested whether any observed differences of oscillatory activities were phase-locked to the stimulus onset by calculating intertrial phase coherence at a particular frequency, called “intertrial coher-ence” (Makeig et al., 2001, 2002) or “phase-locking factor” (Tallon-Baudry et al., 1996).
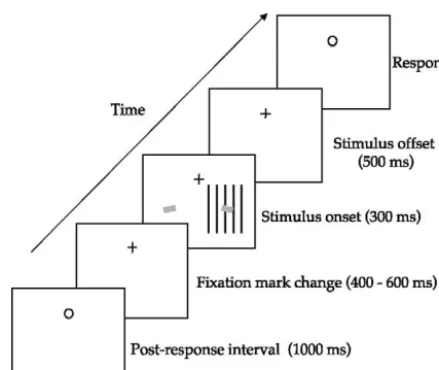
Fig. 1. Illustration of trial sequence. Observers covertly oriented their attention toward the right or left visual field as soon as the fixation mark changed from a circle to a cross. After a variable interval (400 – 600 ms), the grating stimulus was displayed (duration 300 ms) in the lower right visual field. Two small yellow bars were also presented bilaterally in the lower field, the bar on the right being centered on the grating patch. The bars were presented for 100 ms with a variable onset time of up to⫾50 ms relative to the onset of the grating. The fixation mark reverted back to the circle 500 ms after the offset of the grating, which was the signal for observers to record their judgment of the orientation of the bar on the side to which they had attended. Following this judgment, for which no re-sponse deadline was imposed, the fixation circle remained for a further 1000 ms before reverting to a cross. An on-screen instruction was pre-sented once at the beginning of each block of trials informing observers which direction to attend.
Methods
Subjects
Five subjects (ages 30 – 41, three males and two fe-males) with no history of neurological injury were em-ployed. All subjects gave written informed consent for the experimental procedures, approved by the ATR Hu-man Subject Review Committee. All observers had nor-mal or corrected-to-nornor-mal visual acuity and nornor-mal vi-sual fields and color vision.
Stimuli
Sinusoidal gratings were generated using a VSG2/3 graphics board (Cambridge Research Systems, UK) and projected (ELP-710 projector, Epson, Japan) from out-side a magnetically shielded room (Tokin Corp., Sendai, Japan) onto a semi-translucent screen inside the room. The gratings were modulated in color along the L-M
observer were ⬍⫾30 v and no systematic eye move-ment bias occurred for any observer. Viewing was bin-ocular, with the head stabilized using a chin rest.
Procedure
Evoked magnetic responses to the onset of grat-ing stimuli were recorded from each observer usgrat-ing a 201-channel, whole-head biomagnetic imaging system (Shimadzu Corp., Kyoto, Japan). There were two exper-imental conditions: attention was directed toward the stimulus under one condition and away from it under another (see below for details). The responses were sam-pled at 1 kHz for 1024 ms, beginning 200 ms before stimulus onset.
Observers maintained central fixation throughout each block of trials. Covert attention was directed toward the right or left visual field— depending on initial instruc-tions—as soon as the fixation mark changed from a circle to a cross (Fig. 1). After a variable interval (400 – 600 ms), the grating patch was presented for 300 ms in the lower right visual field. Two small yellow bars (CIE coordinates: x⫽0.33 y⫽0.36 size: 0.4° vertically by 1° horizontally) were also presented, symmetrically dis-placed about the vertical meridian with the bar on the right being positioned in the center of the stimulus. Dur-ing recordDur-ing, covert attention was directed toward the stimulus by asking each observer to judge the orientation of the right yellow bar. A total of 100 trials were recorded and the resultant signals were band pass filtered at 1–100 Hz. Under a separate condition attention was directed away from the stimulus by asking subjects to judge the orientation of the left yellow bar. Again, 100 trials were recorded and the signals were band pass filtered at 1–100 Hz. On each trial, the bars were rotated from horizontal by about 10° (clockwise or anti-clockwise with equal probability), an angle predetermined using two alternate forced-choice procedures to yield approximately 85% correct performance for judging their orientation. This level of performance ensures maximum spatial attention in visual tasks of this nature (Lee et al., 1997). To further ensure maximum attention, the yellow bars were pre-sented with a variable onset time of ⫾50 ms relative to the onset of the grating. The instruction to attend the right or left yellow bar was presented near the fixation point at the beginning of each condition. The order of conditions was randomized across subjects.
Data analysis
To determine the location of evoked neural activity, the data were first modeled using a single-equivalent current dipole (ECD) source model. Best-fit solutions were ob-tained using a least-squares error fit between the observed magnetic signals and those predicted by the model. The
solution yielding the best goodness of fit (GF) was deter-mined as
GF⫽1⫺
冑
冘
i⫽1
N
共Si⫺Di兲
2
/
冘
i⫽1
N
Si
2
,
where N is the number of channels, and Siand Di are the
observed and predicted magnetic signals in channel i, re-spectively.
ICA was conducted (Makeig et al., 2001) over the nor-malized single-sweep data (Callan et al., 2001) to separate sources in the magnetic signals that are spatially fixed and temporally independent (Makeig et al., 1997). In this anal-ysis, the data from each condition (attention directed toward or away from the stimulus) were combined. The raw data for each single sweep of 201 channels was down sampled from 1000 to 250 Hz and baseline normalized. Independent components (ICs) were determined by using an unsuper-vised neural network to train a weight matrix that maxi-mizes the joint entropy between the nonlinearly transformed channel data (Makeig et al., 1997). Multiplying the original input data by the rows of the trained weight matrix gives the activation waveform for each IC. The columns of the in-verse weight matrix show the relative sensor projection strengths of the respective components (Makeig et al., 1997). ICs were sorted in descending order of their mean projected variance.
In order to determine the IC of calcarine origin, all sensor projection maps (inverse weight matrix W⫺1) were examined. The activation waveforms of the ICs showing large weights in sensor projection maps over occipital regions were projected onto the sensors by mul-tiplication with the inverse weight matrix (W⫺1) and were then subjected to dipole analysis to determine the source location. Scalograms for each of the single-sweep activation waveforms of the calcarine components were computed using Morlet’s wavelet analysis (Auger et al., 1996) designed to represent frequencies from 2.5 to 50 Hz with 32 steps. The half length of the Morlet analyzing wavelet at the coarsest scale was 16 samples. The time dimension of the time frequency representation was eval-uated over the 32 points to produce a 32 ⫻ 32 point scalogram for each single sweep. In addition to the cal-carine components, this method of analysis was also used to examine components in the parieto-occipital cortex.
Results
Behavioral performance for bar-orientation judgement task
Averaged across observers, performance for the bar-orientation judgment task was 85.8% correct for the right visual field (grating patch and bar) and 86.2% correct for the left visual field (bar only). These results conform with reports by observers that the level of task difficulty appeared equal under both conditions.
Effect of attention on global magnetic field power
For five observers, the evoked magnetic responses to the onset of chromatic gratings were plotted as global magnetic field power (GFP) over time (Fig. 2, left). In these plots, the stimulus appeared at time zero. Responses are shown for two experimental conditions: one where the observer’s at-tention was directed toward the stimulus (red function) and the other away from it (blue function). In general, the maximum field power, noise level, and morphology of the response functions were similar for each condition and varied little between observers. In all cases, a major peak in field power was evident at about 120 ms. Neither the latency nor the maximum power of this initial peak was affected by the attentional status of the observer (latency: z⫽0.27, P⬎ 0.05, power: z ⫽ 1.75, P ⬎ 0.05, n ⫽ 5, two-tailed Wil-coxon signed-rank test).
For each observer, the peak in GFP near 120 ms was well modeled by a single equivalent current dipole located on the
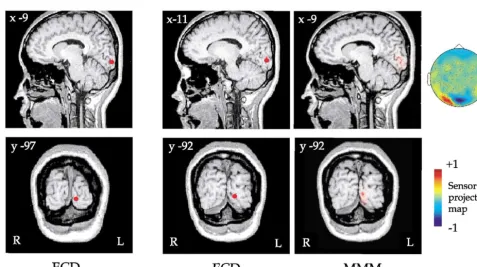
occipital pole, above the calcarine sulcus and to the left of the interhemispheric midline (contralateral to the stimulus). This can be seen in Fig. 3A (left), which shows the source solutions for one observer (TK) coregistered with sagittal and coronal MR images of this subject’s brain. The Ta-lairach coordinates (TaTa-lairach and Tournoux, 1988) for each dipole source are reported for each observer in Table 1. Although secondary peaks of lower power were evident for some observers, in general the signal-to-noise ratio at these later times was too small to allow any further analyses to be conducted.
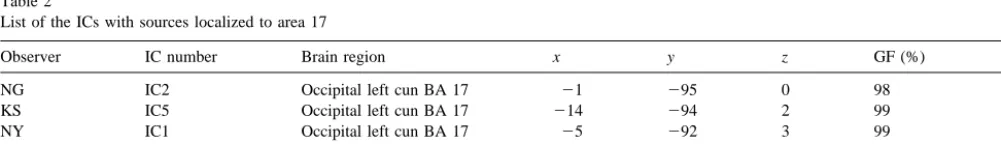
Extraction of calcarine components using ICA
ICA was conducted over the normalized single-sweep data to extract calcarine components from other cortical activity. For each observer, independent components show-ing large weights in sensor projection maps over the occip-ital region were found. These were subjected to dipole source analysis to determine the location of the underlying neural activity. ICs with sources localized to Brodmann’s area 17, as determined by Talairach coordinates, were as-sumed to reflect striate activity (Table 2). Note that for each observer, only one IC with the dipole source adjacent to the calcarine sulcus in the left (contralateral to the stimulus) hemisphere was found. The position of this source com-pared well with that of the sources determined from the magnetic field power plots (compare Fig. 3A with B). Using the moving mesh method (MMM) (Kajihara et al., 2000), the locations and volumes of multiple dipoles (n⫽32) were Table 1
Talairach coordinates for the equivalent current dipole (ECD) solution at the latency of the major peak in the observed MEG global field power functions for both experimental conditions for five observers
Observer Attention directed away from stimulus Attention directed toward stimulus
BA x y z GF (%) BA x y z GF (%)
NG 17 Left ⫺1 ⫺94 2 98 17 Left ⫺1 ⫺95 0 98
KS 17 Left ⫺15 ⫺90 5 99 17 Left ⫺15 ⫺93 1 98
NY 17 Left ⫺6 ⫺92 5 99 17 Left ⫺6 ⫺92 3 99
TK 17 Left ⫺13 ⫺95 5 98 17 Left ⫺9 ⫺97 2 97
HA 17 Left ⫺1 ⫺97 2 96 17 Left ⫺3 ⫺97 2 96
Note. BA, Brodmann area; GF, goodness of fit (see Methods for definition).
Table 2
List of the ICs with sources localized to area 17
Observer IC number Brain region x y z GF (%) pvaf
NG IC2 Occipital left cun BA 17 ⫺1 ⫺95 0 98 3.91
KS IC5 Occipital left cun BA 17 ⫺14 ⫺94 2 99 3.16
NY IC1 Occipital left cun BA 17 ⫺5 ⫺92 3 99 5.42
TK IC5 Occipital left cun BA 17 ⫺11 ⫺92 3 97 1.89
HA IC6 Occipital left cun BA 17 ⫺5 ⫺97 2 95 1.34
estimated. The MMM shows that multiple dipoles were located near the calcarine sulcus (Fig. 3B).
For both experimental conditions, the reconstructed power functions of the ICs representing calcarine activity contained a major peak at around 120 ms, mimicking the power functions derived from the averaged evoked MEG responses (compare left and right panels for each observer in Fig. 2). As with the averaged MEG responses, neither the latency nor the power of the major peak in the reconstructed functions was affected by the attentional status of the ob-server (latency: z⫽0.37, P⬎0.05, power: z⫽0.135, P⬎ 0.05, n⫽ 5, two-tailed Wilcoxon signed-rank test).
Effects of attentional modulation on oscillatory activity within the calcarine
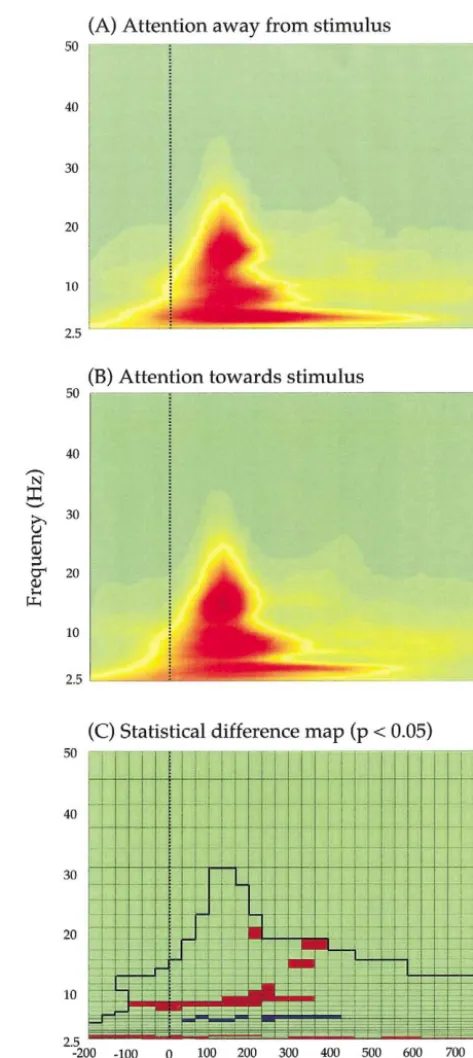
To determine the effects of attentional modulation on oscillatory activity, we computed time-frequency energy plots (scalograms) for each of the single-sweep activation waveforms of the ICs reflecting calcarine activity using Morlet’s wavelet analysis (Auger et al., 1996). For each observer, median scalograms representing frequencies from 2.5 to 50 Hz over the time scale ⫺200 to 824 ms were created. The stimulus onset time was zero. The pattern of oscillatory activity was similar for each observer. The group-median (n ⫽ 5) scalograms show that oscillatory activity within the frequency band 3–20 Hz was evident under both experimental conditions (Fig. 4). At higher fre-quencies (⬎15 Hz), activity was confined to latencies of between 50 and 250 ms. At lower frequencies (⬍10 Hz), however, oscillatory activity was evident both before and after the onset of the stimulus.
In order to determine the common neural processes un-derlying attentional modulation of calcarine activity, every pixel on the scalogram was submitted to statistical analysis (n⫽5, Wilcoxon signed-rank test). To constrain statistical differences between the two experimental conditions to time-frequency regions with a sufficient degree of energy for reliable statistical evaluation, each pixel was included in the analysis only if its value was greater than one-half standard deviation below the mean value of all pixels for the combined mean of the two conditions (the area below the dark line in Fig. 4C). Fig. 4C shows a significance map (P
⬍ 0.05) of the differences between the two experimental conditions: red indicates a relative increase in energy when attention was directed toward the stimulus, while blue in-dicates a relative increase in energy when attention was directed away from the stimulus. The results show that the magnitude of oscillatory activity of calcarine origin was dependent on the attentional status of the observer. When attention was directed toward the stimulus, three main ef-fects were observed: (a) an increase in energy was evident in the frequency range of 7–10 Hz (lower alpha-band oscil-latory activity), beginning some 100 ms prior to the onset of the stimulus and lasting for its entire duration; (b) enhanced activity within the frequency range of 13–20 Hz was evident
at poststimulus latencies between 200 and 400 ms; and (c) a decrease in energy soon after the onset of the stimulus was evident in the frequency range of 5– 6 Hz.
Extraction of parieto-occipital components using ICA
For two observers (NG and TK), ICs showing large weights in sensor projection maps over the parieto-occipital (PO) region were found. Dipole source analysis confirmed the location of the underlying neural activity to be adjacent to the parieto-occipital sulcus in the right hemisphere (ipsi-lateral to the stimulus) (see MR images in Fig. 5). Note that this is the opposite hemisphere to that of the identified calcarine components (compare Figs. 3 and 5). For both observers, median scalograms were created using the pro-cedure outlined above to determine the effects of attention on oscillatory activity (Fig. 5A, B). Every pixel on the scalograms of the single sweeps was submitted to statistical analysis (n ⫽ 100, Wilcoxon signed-rank test) for each observer. Inclusion criteria for the analysis were set as outlined above. The pattern of activity for the PO compo-nent was similar for both observers: when attention was directed toward the stimulus, an increase in energy was evident in the frequency range of 10 –12 Hz (upper alpha activity) in the right (ipsilateral) hemisphere (Fig. 5C, P⬍ 0.001). The enhanced alpha activity was evident some 200 ms prior to the onset of the stimulus and lasted for almost its entire duration.
Demonstration of early alpha-band activity in MEG responses
The spectral analyses reported above show attentional modulation of alpha activity both before and after the onset of the stimulus (Figs. 4C and 5C). However, there remains uncertainty as to whether any or all of the modulation prior to stimulus onset reflects the temporal resolution of the method used: the time resolution at the wavelet scale cor-responding to 10 Hz was 82.6 ms (half width at half height). Here, we investigate this. No effects of attention were evi-dent in the averaged MEG responses (Fig. 2) and this may be because they were not tightly phase-locked to the stim-ulus onset. However, attentional effects are evident in the averaged responses from selected sensors if the alpha ac-tivity is forced into synchrony (Fig. 6). For three sensors located over the occipital cortex (Fig. 6D), estimates of spectral power and phase were computed for 10 Hz activity
over the time scale ⫺200 to 100 ms (observer TK). This time scale was chosen because it preceded the major evoked MEG response to the stimulus. The single-sweep traces were phase aligned for the 10 Hz activity (Fig. 6C) and then averaged (Fig. 6B). Although this procedure negates the principal response at 120 ms in the MEG data (compare Fig. 6A and B), it does reveal prominent alpha-band activity under both experimental conditions from at least 150 ms prior to the stimulus onset to about 200 ms postonset (Fig. 6B). Little or no alpha was evident after this time, suggest-ing that the stimulus-evoked activity affected its amplitude and/or phase. For each sensor, the estimated power of the 10 Hz activity was affected by the attentional status of the observer (P ⬍ 0.0001, unpaired t-statistic, two-tailed). Three other observers (NG, KS, HA) showed similar results for sensors located over occipital regions (P ⬍ 0.02, un-paired t-statistic, two-tailed).
Consistency of alpha phase across trials for calcarine and parieto-occipital IC components
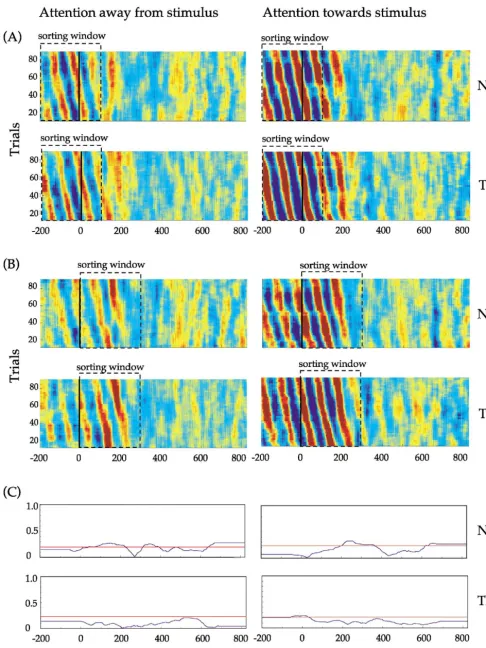
To investigate the consistency of alpha (10 Hz) phase across trials in relation to stimulus onset, the activation waveforms (n ⫽ 100) of the ICs representing calcarine activity were sorted for two observers (NG and TK) using the technique of Makeig et al. (2001) (Fig. 7). Single-trial waveforms were sorted according to their phase at 10 Hz using two sorting windows:⫺200 to 100 ms (Fig. 7A, prior to the latency of the major peak in GFP) and 0 to 300 ms (Fig. 7B, including the latency of the major peak in GFP). The results were displayed as color-coded horizontal lines in a rectangular panel for each experimental condition: red indicates positive values and blue indicates negative values. Fig. 7C shows for each observer and for each condition the time course of the intertrial phase coherence at 10 Hz (blue line): the horizontal red line indicates an ITC significance level of P⫽ 0.01. Fig. 8 shows the results of this analysis for PO activity.
For the calcarine components (contralateral hemisphere), and for both experimental conditions, ITC rose sharply immediately after stimulus onset (time⫽ 0) and was near perfect (ITC⫽1.0) at 125 ms (Fig. 7C), corresponding to the latency of the peak in GFP for observers NG and TK (Fig. 2). When the data were phase-sorted using a window of ⫺200 to 100 ms, a pattern of tilted colored bars with a periodicity of 10 Hz was evident in the display window during this time (Fig. 7A). This pattern indicates that alpha
phase was not aligned across trials in the prestimulus period or for 100 ms poststimulus onset. Note that this pattern of tilted bars was absent when a sorting window of 0 to 300 ms was used (Fig. 7B), indicating that alpha phase was reset (changed) during this time. For both sorting windows, a prominent vertical red bar (width 50 ms) was evident at about 125 ms, indicating a common (fixed latency) peak in the activation waveforms (Fig. 7A,B).
In contrast, the ITC for the parieto-occipital components (ipsilateral hemisphere) remained low for both experimental conditions at all times (Fig. 8C). When the data were phase sorted using a window of⫺200 to 100 ms, a pattern of tilted colored bars with a periodicity of 10 Hz was evident in the display panel for each condition from⫺200 to 200 ms. This pattern, which was most pronounced for the condition whereby attention was directed toward the stimulus, indi-cates that alpha phase was not aligned across trials. Note that this pattern remained unchanged at stimulus onset (time
⫽ 0) and was independent of the sorting window used (compare Fig. 8A with B).
Discussion
Effects of attentional modulation on calcarine activity
Our results provide evidence that directing attention to-ward or away from a visual stimulus differentially affects the level of oscillatory activity within the human calcarine cortex. In comparison with the condition whereby attention was directed away from the stimulus, statistically significant (P ⬍ 0.05) increases and decreases in oscillatory activity within the calcarine were evident when attention was di-rected toward the stimulus (Fig. 4C). Three main effects were observed, all of which occurred within the hemisphere contralateral to the stimulus (Fig. 3). First, a sustained increase in alpha-band (7–10 Hz) activity was evident, be-ginning some 100 ms prior to the onset of the stimulus. Second, activity in the frequency range of 13–20 Hz was enhanced between poststimulus latencies of 200 and 400 ms. Finally, attention caused a reduction in slow oscillatory activity (5– 6 Hz) shortly after the onset of the stimulus and persisting for 100 ms in its absence.
Localization of the ICA sources to the calcarine sulcus with Talairach coordinates corresponding to Brodmann’s area 17 (Fig. 3, Table 2) led us to hypothesize that the generator of the oscillations is in area V1, as opposed to immediately adjacent areas V2 and V3. In support of this
hypothesis, we note the following: (a) for each observer, only one IC with a dipole source adjacent to the calcarine sulcus was found (Table 2); (b) the position of this source matched that of the source determined from the first signif-icant peak of the stimulus-evoked magnetic responses (com-pare Fig. 3A with B); and (c) dipole fits to the activity evoked by chromatic sinusoids of the type used in this study vary in a way that is consistent with the cruciform model of V1—namely, dipole orientations show polarity inversions between upper and lower quadrant stimuli (Fylan et al., 1997; Anderson, 2002).
The effects of attention were not evident in either the GFP plots of the neuromagnetic data or the reconstructed power functions of the calcarine activity (Fig. 2), consistent with previous electromagnetic response measures (Clark and Hillyard, 1996). However, attentional affects were ev-ident using time-varying spectral analyses. Therefore, con-trary to previous ERP and MEG studies (see Introduction), we conclude that attentional modulation does affect activity within early visual areas, including V1, and may do so by altering the amplitude of various oscillatory rhythms. The attentional modulation effects observed in human V1 using fMRI (Watanabe et al., 1998; Brefczynski and DeYoe, 1999; Gandhi et al., 1999; Martinez et al., 1999, 2001; Somers et al., 1999) may reflect changes in the level of various natural brain rhythms and need not necessarily re-flect a feedback process (Martinez et al., 1999, 2001).
The time resolution at the wavelet scale corresponding to 10 Hz was 82.6 ms (half width of impulse response function at half height), and as such at least some of the increase in alpha-band activity in the calcarine during the prestimulus period (Fig. 4C) may be artifactual. However, forcing alpha (10 Hz) activity into synchrony by simply adjusting the phase of the raw data traces, we showed that attentional modulation of alpha was evident in the averaged responses from selected sensors over the occipital cortex (see Fig. 6). Although this procedure does not allow us to comment on the localization of the activity, it seems likely that some of the activity was near the calcarine (Fig. 7) and PO sulci (Fig. 8). The observed alpha increment in the calcarine before stimulus onset may be related to that observed in the PO area. This view is compatible with physiological studies showing enhanced interareal alpha synchronization in the cat between the primary visual cortex and higher visual areas during periods in which a behaviorally relevant stim-ulus was expected (Chatila et al., 1992; von Stein et al., 2000).
Enhancement of alpha during the prestimulus period
(Fig. 4C and Fig. 5C) may reflect self-induced preparatory activity. Enhanced baseline activity in the postcue–pre-stimulus period in response to attentional shifts has been observed in both single cell studies on monkey (Luck et al., 1997) and fMRI studies on humans (Chawla et al., 1999; Kastner et al., 1999; Ress et al., 2000). For example, it has been reported that hemodynamic responses in motion (V5) and color-sensitive (V4) areas were enhanced during the prestimulus period by selective attention to motion and color stimuli, respectively (Chawla et al., 1999). Changes in baseline activity might form the neurophysiological basis of attentional modulation. This is supported by the observation that increased hemodynamic responses in human extrastri-ate cortex (Kastner et al., 1999) are qualitatively similar to the increased baseline firing rates of V4 neurons in monkey cortex (Luck et al., 1997). In humans, enhanced hemody-namic responses within striate cortex are evident in some individuals, although they are of lower amplitude and more variable in nature (Kastner et al., 1999). Our neuromagnetic recordings provide evidence to suggest that baseline activity within the striate cortex does increase in response to a directed shift of attention.
Comparison of calcarine and parieto-occipital activity
When spatial attention was directed toward the stimulus in the right visual field, enhanced alpha-band activity was observed near the calcarine (Fig. 3B) and PO sulci (Fig. 5D). Although the changes in alpha within the calcarine and PO areas followed a similar time course, in most other respects the nature of the changes differed markedly be-tween the two areas. First, enhanced alpha within the cal-carine was observed in the left (contralateral) hemisphere, whereas that in the PO area was observed in the right (ipsilateral) hemisphere. Second, the attentional change in alpha was more marked in the PO area than in the calcarine (compare Figs. 4 and 5), although ICA only revealed a PO source in two of five observers. Third, the energy of the signal in the time-frequency plane was spread over a wide range of frequencies in the calcarine (Fig. 4A, B) whereas that in the PO area was confined to about 10 Hz (Fig. 5A, B). Fourth, in the calcarine, the attentional change in alpha-band activity was most pronounced in the frequency range of 7 to 10 Hz (lower alpha, Fig. 4C), while the change in the PO area was most evident at 10 to 12 Hz (higher alpha, Fig. 5C). Finally, analysis of the intertrial phase coherence (ITC) for 10 Hz activity differed markedly between the two areas. Within the calcarine, ITC rose sharply after stimulus onset
and reached a maximum value near 1.0 at a poststimulus latency of about 125 ms (Fig. 7C), which is indicative of evoked activity or phase resetting (Brandt, 1997; Makeig et al., 2002). In contrast, ITC remained low at all times for the PO area (Fig. 8C). Pictorial representation of the phase-sorted data for the PO components revealed a prominent pattern of tilted colored bars, beginning before stimulus onset and persisting for 200 ms after stimulus onset (Fig. 8), indicating that alpha was not phase-locked to the stimulus onset. Our results provide evidence that the alpha-band activity in the PO area was induced whereas that in the calcarine may reflect both induced and evoked activity.
The differences between calcarine and PO areas reported here lead us to conclude that attentional modulation of alpha within these areas subserves fundamentally different func-tions. The standard view is that large-amplitude alpha char-acterizes a deactivated cortical network (Pfurtscheller, 2001). Our results showing increases in alpha during atten-tion tasks appear inconsistent with this view, but they are in agreement with recent studies showing task- and load-de-pendent increases in alpha activity (Klimesch, 1999; Wor-den et al., 2000; Jensen et al., 2002). For example, WorWor-den et al. showed that alpha activity increased over the occipital cortex ipsilateral to the direction of attention, which is consistent with our results for two observers showing in-creased alpha in the right (ipsilateral) PO cortex (see Fig. 5). Increased alpha in the PO area may act to inhibit the pro-cessing of information relating to that part of the visual field that is to be ignored. A similar argument was advanced by Worden et al. (2000). However, it is difficult to reconcile an inhibitory role for alpha activity within the calcarine, given that its locus is coincident with that of heightened neural activity associated with visual processing. If we accept the argument that increasing synchrony between neurons may act to increase the synaptic efficiency of a cortical network (Steinmetz et al., 2000), one possibility may be that in-creased alpha in the calcarine serves to enhance the effi-ciency of processing information related to the visual stim-ulus.
The functional relationship between the calcarine and PO areas remains an open question. The various differences between these areas cited above are all consistent with the view that alpha activity within the PO region may modify that within the calcarine, in agreement with the hypothesis that oscillatory processes in the middle frequency range (4 –12 Hz) may involve top-down processes (von Stein et al., 2000).
Effects of attentional modulation on beta and theta activity
When visual attention was directed toward the stimulus, enhanced beta activity (13–20 Hz) adjacent to calcarine sulcus in the left (contralateral) hemisphere was evident between 200 and 400 ms poststimulus onset (Fig. 4C). Because the time course of the changes in alpha and beta activity within the calcarine cortex was markedly different, we assume that the two effects subserve different functions. While the sustained increase in alpha rhythm is probably related to the attentional status of the observer (Foxe et al., 1998; Worden et al., 2000), the delayed enhancement of beta activity may reflect changes in sensory processing (Martinez et al., 2001).
A reduction in theta activity (5– 6 Hz) within the calcar-ine, occurring shortly after the onset of the stimulus and lasting for 400 ms, was also evident in the contralateral hemipshere. This may relate to oscillatory activity within thalamo-cortical relay neurons (Lopes da Silva, 1991). If the thalamo-cortico-thalamic interaction plays an important role in attention (Crick, 1984; O’Connor et al., 2002; Raizada and Grossberg, 2003), enhanced alpha activity may mirror reduced theta activity.
Acknowledgments
We thank T. Tomita and S. Kajihara for their support with the MEG recordings. This study was supported by Special Coordination Funds for promoting Science and Technology from the Science and Technology Agency of the Japanese Government.
References
Anderson, S.J., 2002. Functional neuroimaging in amblyopia, in: Mosely, M., Fielder, A. (Eds.), Amblyopia: A Multidisciplinary Approach, Butterworth Heinmann, Oxford, pp. 43– 67.
Anderson, S.J., Holliday, I.E., Harding, G.F., 1999. Assessment of cortical dysfunction in human strabismic amblyopia using magnetoencephalog-raphy (MEG). Vision Res. 39, 1723–1738.
Anderson, S.J., Holliday, I.E., Singh, K.D., Harding, G.F., 1996. Local-ization and functional analysis of human cortical area V5 using mag-neto-encephalography. Proc. R. Soc. Lond. B Biol. Sci. 263, 423– 431. Auger, F., Flandrin, P., Goncalves, P., Lemoine, O., 1996. Time-Frequency Toolbox: for Use with Matlab. Centre National de la Recherche Sci-entifique, France.
Barnes, G.R., Hess, R.F., Dumoulin, S.O., Achtman, R.L., Pike, G.B., 2001. The cortical deficit in humans with strabismic amblyopia. J. Physiol. 533, 281–297.
Brandt, M.E., 1997. Visual and auditory evoked phase resetting of the alpha EEG. Int. J. Psychophysiol. 26, 285–298.
Brefczynski, J.A., DeYoe, E.A., 1999. A physiological correlate of the “spotlight” of visual attention. Nat. Neurosci. 2, 370 –374.
Callan, D.E., Callan, A.M., Kroos, C., Vatikiotis-Bateson, E., 2001. Mul-timodal contribution to speech perception revealed by independent component analysis: a single-sweep EEG case study. Brain Res. Cogn. Brain Res. 10, 349 –353.
Chatila, M., Milleret, C., Buser, P., Rougeul, A., 1992. A 10 Hz “alpha-like” rhythm in the visual cortex of the waking cat. Electroencephalogr. Clin. Neurophysiol. 83, 217–222.
Chawla, D., Rees, G., Friston, K.J., 1999. The physiological basis of attentional modulation in extrastriate visual areas. Nat. Neurosci. 2, 671– 676.
Clark, V.P., Hillyard, S.A., 1996. Spatial selective attention affects early extrastriate but not striate components of the visual evoked potential. J. Cogn. Neurosci. 8, 387– 402.
Crick, F., 1984. Function of the thalamic reticular complex: the searchlight hypothesis. Proc. Natl. Acad. Sci. USA 81, 4586 – 4590.
Engel, S., Zhang, X., Wandell, B., 1997. Colour tuning in human visual cortex measured with functional magnetic resonance imaging. Nature 388, 68 –71.
Foxe, J.J., Simpson, G.V., Ahlfors, S.P., 1998. Parieto-occipital approxi-mately 10 Hz activity reflects anticipatory state of visual attention mechanisms. NeuroReport 9, 3929 –3933.
Fries, P., Reynolds, J.H., Rorie, A.E., Desimone, R., 2001. Modulation of oscillatory neuronal synchronization by selective visual attention. Sci-ence 291, 1560 –1563.
Fylan, F., Holliday, I.E., Singh, K.D., Anderson, S.J., Harding, G.F., 1997. Magnetoencephalographic investigation of human cortical area V1 using color stimuli. NeuroImage 6, 47–57.
Gandhi, S.P., Heeger, D.J., Boynton, G.M., 1999. Spatial attention affects brain activity in human primary visual cortex. Proc. Natl. Acad. Sci. USA 96, 3314 –3319.
Hamalainen, M., Hari, R., Ilmoniemi, R.J.e.a., Knuutila, J., Lounasmaa, O.V., 1993. Magnetoencephalography—theory, instrumentation and applications to non-invasive studies of the working human brain. Rev. Mod. Phys. 65, 413– 497.
Heinze, H.J., Mangun, G.R., Burchert, W., Hinrichs, H., Scholz, M., Munte, T.F., Gos, A., Scherg, M., Johannes, S., Hundeshagen, H., et al., 1994. Combined spatial and temporal imaging of brain activity during visual selective attention in humans. Nature 372, 543–546. Imada, T., Kawakatsu, M., Kotani, M., 1996. Attention-related
enhance-ment of extrastriate neuromagnetic signals, in: Ogura, C., Koga, Y., Shimokochi, M. (Eds.), Recent Advances in Event-Related Brain Po-tential Research, Elsevier Science, New York, pp. 499 –503. Ito, M., Gilbert, C.D., 1999. Attention modulates contextual influences in
the primary visual cortex of alert monkeys. Neuron 22, 593– 604. Jeffreys, D.A., Axford, J.G., 1972. Source locations of pattern-specific
components of human visual evoked potentials. I. Component of striate cortical origin. Exp. Brain Res. 16, 1–21.
Jensen, O., Gelfand, J., Kounios, J., Lisman, J.E., 2002. Oscillations in the alpha band (9 –12 Hz) increase with memory load during retention in a short-term memory task. Cereb. Cortex 12, 877– 882.
Kajihara, S., Tomita, S., Kondo, Y., Arakawa, A., Okamura, S., Tomita, T., Yoshida, Y., Takanashi, Y., 2000. Moving mesh method for recon-structing some spread sources in the brain. Brain Topogr. 12, 283–292. Kastner, S., Pinsk, M.A., De Weerd, P., Desimone, R., Ungerleider, L.G., 1999. Increased activity in human visual cortex during directed atten-tion in the absence of visual stimulaatten-tion. Neuron 22, 751–761. Klimesch, W., 1999. EEG alpha and theta oscillations reflect cognitive and
memory performance: a review and analysis. Brain Res. Brain Res. Rev. 29, 169 –195.
Krauskopf, J., Williams, D.R., Heeley, D.W., 1982. Cardinal directions of color space. Vision Res. 22, 1123–1131.
Lee, D.K., Koch, C., Braun, J., 1997. Spatial vision thresholds in the near absence of attention. Vision Res. 37, 2409 –2418.
Logothetis, N.K., Pauls, J., Augath, M., Trinath, T., Oeltermann, A., 2001. Neurophysiological investigation of the basis of the fMRI signal. Na-ture 412, 150 –157.
Luck, S.J., Chelazzi, L., Hillyard, S.A., Desimone, R., 1997. Neural mech-anisms of spatial selective attention in areas V1, V2, and V4 of macaque visual cortex. J. Neurophysiol. 77, 24 – 42.
Makeig, S., Humphries, C., Jung, T.P., Bell, T., McKeown, M., Dimitrov, A., Lee, T.W., Cardoso, J.F., 2001. MATLAB functions for Psycho-physiological Data Analysis. CNL/Salk Institute.
Makeig, S., Jung, T.P., Bell, A.J., Ghahremani, D., Sejnowski, T.J., 1997. Blind separation of auditory event-related brain responses into inde-pendent components. Proc. Natl. Acad. Sci. USA 94, 10979 –10984. Makeig, S., Westerfield, M., Jung, T.P., Enghoff, S., Townsend, J.,
Courchesne, E., Sejnowski, T.J., 2002. Dynamic brain sources of visual evoked responses. Science 295, 690 – 694.
Mangun, G.R., Buonocore, M.H., Girelli, M., Jha, A.P., 1998. ERP and fMRI measures of visual spatial selective attention. Hum. Brain Mapp. 6, 383–389.
Martinez, A., Anllo-Vento, L., Sereno, M.I., Frank, L.R., Buxton, R.B., Dubowitz, D.J., Wong, E.C., Hinrichs, H., Heinze, H.J., Hillyard, S.A., 1999. Involvement of striate and extrastriate visual cortical areas in spatial attention. Nat. Neurosci. 2, 364 –369.
Martinez, A., DiRusso, F., Anllo-Vento, L., Sereno, M.I., Buxton, R.B., Hillyard, S.A., 2001. Putting spatial attention on the map: timing and localization of stimulus selection processes in striate and extrastriate visual areas. Vision Res. 41, 1437–1457.
Mehta, A.D., Ulbert, I., Schroeder, C.E., 2000. Intermodal selective atten-tion in monkeys. I: distribuatten-tion and timing of effects across visual areas. Cereb. Cortex 10, 343–358.
Moran, J., Desimone, R., 1985. Selective attention gates visual processing in the extrastriate cortex. Science 229, 782–784.
Motter, B.C., 1993. Focal attention produces spatially selective processing in visual cortical areas V1, V2, and V4 in the presence of competing stimuli. J. Neurophysiol. 70, 909 –919.
O’Connor, D.H., Fukui, M.M., Pinsk, M.A., Kastner, S., 2002. Attention modulates responses in the human lateral geniculate nucleus. Nat. Neurosci. 5, 1203–1209.
Pfurtscheller, G., 2001. Functional brain imaging based on ERD/ERS. Vision Res. 41, 1257–1260.
Pfurtscheller, G., Lopes da Silva, F.H., 1999. Event-related EEG/MEG synchronization and desynchronization: basic principles. Clin. Neuro-physiol. 110, 1842–1857.
Posner, M.I., Petersen, S.E., 1990. The attention system of the human brain. Annu. Rev. Neurosci. 13, 25– 42.
Raizada, R.D., Grossberg, S., 2003. Towards a theory of the laminar architecture of cerebral cortex: computational clues from the visual system. Cereb. Cortex 13, 100 –113.
Ray, W.J., Cole, H.W., 1985. EEG alpha activity reflects attentional de-mands, and beta activity reflects emotional and cognitive processes. Science 228, 750 –752.
Ress, D., Backus, B.T., Heeger, D.J., 2000. Activity in primary visual cortex predicts performance in a visual detection task. Nat. Neurosci. 3, 940 –945.
Roelfsema, P.R., Lamme, V.A., Spekreijse, H., 1998. Object-based atten-tion in the primary visual cortex of the macaque monkey. Nature 395, 376 –381.
Singh, K.D., Barnes, G.R., Hillebrand, A., Forde, E.M., Williams, A.L., 2002. Task-related changes in cortical synchronization are spatially coincident with the hemodynamic response. NeuroImage 16, 103–114. Smith, A.T., Singh, K.D., Greenlee, M.W., 2000. Attentional suppression
of activity in the human visual cortex. NeuroReport 11, 271–277. Somers, D.C., Dale, A.M., Seiffert, A.E., Tootell, R.B., 1999. Functional
MRI reveals spatially specific attentional modulation in human primary visual cortex. Proc. Natl. Acad. Sci. USA 96, 1663–1668.
Steinmetz, P.N., Roy, A., Fitzgerald, P.J., Hsiao, S.S., Johnson, K.O., Niebur, E., 2000. Attention modulates synchronized neuronal firing in primate somatosensory cortex. Nature 404, 187–190.
Talairach, J., Tournoux, P., 1988. Co-planar Stereotaxic Atlas of the Human Brain: 3-Dimensional Proportional System: An Approach to Cerebral Imaging. Thieme, New York.
Tallon-Baudry, C., Bertrand, O., 1999. Oscillatory gamma activity in humans and its role in object representation. Trends Cogn. Sci. 3, 151–162.
Tallon-Baudry, C., Bertrand, O., Delpuech, C., Pernier, J., 1996. Stimulus specificity of phase-locked and non-phase-locked 40 Hz visual re-sponses in human. J. Neurosci. 16, 4240 – 4249.
Tootell, R.B., Reppas, J.B., Kwong, K.K., Malach, R., Born, R.T., Brady, T.J., Rosen, B.R., Belliveau, J.W., 1995. Functional analysis of human MT and related visual cortical areas using magnetic resonance imaging. J. Neurosci. 15, 3215–3230.
Treisman, A.M., Gelade, G., 1980. A feature-integration theory of atten-tion. Cog. Psychol. 12, 97–136.
Vanni, S., Revonsuo, A., Hari, R., 1997. Modulation of the parieto-occipital alpha rhythm during object detection. J. Neurosci. 17, 7141– 7147.
Vidyasagar, T.R., 1998. Gating of neuronal responses in macaque primary visual cortex by an attentional spotlight. NeuroReport 9, 1947–1952. von Stein, A., Chiang, C., Konig, P., 2000. Top-down processing mediated
by interareal synchronization. Proc. Natl. Acad. Sci. USA 97, 14748 – 14753.
Watanabe, T., Harner, A.M., Miyauchi, S., Sasaki, Y., Nielsen, M., Palomo, D., Mukai, I., 1998. Task-dependent influences of attention on the activation of human primary visual cortex. Proc. Natl. Acad. Sci. USA 95, 11489 –11492.