http://www.sciencepublishinggroup.com/j/ajcbm doi: 10.11648/j.ajcbm.20190301.13
ISSN: 2640-0022 (Print); ISSN: 2640-0057 (Online)
A Statistical Analysis of the Distribution of the Chloride
Threshold with Relation to Steel-concrete Interface
Amit Kenny
1, *, Amnon Katz
21
Department of Civil Engineering, Shamoon College of Engineering, Ashdod, Israel
2Faculty of Civil and Environmental Engineering, Technion, Israel Institute of Technology, Haifa, Israel
Email address:
*
Corresponding author
To cite this article:
Amit Kenny, Amnon Katz. A Statistical Analysis of the Distribution of the Chloride Threshold with Relation to Steel-concrete Interface.
American Journal of Construction and Building Materials. Vol. 3, No. 1, 2019, pp. 16-22. doi: 10.11648/j.ajcbm.20190301.13 Received: August 13, 2019; Accepted: August 30, 2019; Published: September 18, 2019
Abstract:
A wide variation of chloride thresholds can be found in the literature. Possible causes for this variation, which were mentioned are: method of threshold determination, cement chemistry, and concrete microstructure. Regardless of the reasons for these variations, a probabilistic method can be used to ensure the durability of reinforced concrete structures for a specific period. A probabilistic method gives a threshold for design for given required confidence. A former research analyzed the micro-structure of concrete around steel rebar, by means of BSE automated image analysis, and the chloride threshold. The research found a statistical significant correlation between the maximal distance of steel from the closest concrete solid on the rebar perimeter and the chloride threshold. Theory of statistics of extreme values state, that the distribution of maxima data is bonded to be general extreme value distribution (GEVD). Re-analysis of the data from the abovementioned research found that as expected from the theory of statistics, the maximum steel-concrete distance distributed according to GEVD. Therefore, since the chloride threshold depends on the steel-concrete distance, its distribution is bonded to the GEVD. The analysis in this paper show that the received chloride threshold is GEVD as the theory predicted. From the theoretical point of view, GEVD may be the distribution of many other corrosion processes. The recognition of GEVD as the correct distribution for describing corrosion initiation in reinforced concrete (RC) structures, can enable more accurate planning for corrosion protection.Keywords:
Reinforced Concrete, Probabilistic Design, Chloride Threshold, Statistical Analysis, Corrosion1. Introduction
When the chloride content near the rebar surface exceeds a certain limit, referred to as the chloride corrosion concentration limit (CCCL, also denoted as "threshold" in the followings), depassivation of the steel occurs and the steel is susceptible to corrosion; indeed, the corrosion hazard to the embedded reinforcement increases drastically above this level [1].
The chloride threshold for depassivation of steel embedded in concrete is an important parameter for the calculation of the time expected to pass before the initiation of corrosion of reinforced concrete. A change in the chloride threshold can have a significant effect on the lifetime of RC, as much as the transport properties of the concrete or the covercrete thickness. Thus, for example, according to LIFE-365 model [2], for a
specific case [3], a 20% increase in CCCL increases the time to initiation of corrosion by 28%, whereas a 20% reduction in the diffusion coefficient increases the time to initiation of corrosion by only 10%.
The chloride thresholds that can be found in the literature vary to an order of magnitude [3-4]. A revision of the range of the chloride threshold found to be in the range of 0.2% of total chloride to cement [5] to 8.34% of total chloride to cement in mortar [6]. When only the free chloride was measured, the range of the threshold is from 0.03% of cement [7] to 4% of cement [6]. Where Cl-/OH-is used for presenting the chloride threshold a range of 0.12 to 20 can be found in the literature [6]. These variations were attributed to several causes, including (a) the method of threshold determination [4], (b) cement chemistry [8], and (c) concrete microstructure [3, 9-10].
determination or the specific cement chemistry, chloride threshold variability remains high [4-3, 8-9]. It has been demonstrated that the chloride threshold is microstructure-dependent, and this dependence was reinforced by the localized corrosion mechanism of concentration polarization [3, 11-12]. Even though the microstructure is known to be a factor influencing the chloride threshold, it is currently an uncontrollable factor [13].
Nevertheless, a probabilistic approach may be applied to ensure the projected time to corrosion with pre-defined confidence. In other words, even if the exact time to corrosion cannot be calculated, because the values of variables controlling it are widely spread, the time for corrosion with exact confidence interval can be calculated [14]. For example, 1% probability of not having corrosion for 50 years, or having corrosion in less than 1% of the structure for 50 years. The variation of the covercrete, concrete effective diffusion coefficient, and chloride threshold have to be known, in order to build a complete probabilistic model for the duration to chloride induced corrosion initiation. The distribution of the covercrete was published in several papers [15]. Nevertheless, even though many papers report chloride threshold findings, there is shortness of data regarding chloride threshold distribution.
For using the probabilistic approach, information regarding the probability of having a chloride threshold which is equal to or greater than a specific value (cumulative distribution function - CDF) is needed. Creating this information by the use of parametric distribution, demands a large database of chloride thresholds, especially for the tail of lower probabilities, i.e. for having probability of 1% at least 100 specimens for chloride threshold determination are needed. Estimating the chloride threshold by using a known distribution, which is fitted to the data, allows finding the tail probabilities using less data.
Normal, log normal, and Weibull distributions have been used to estimate the distribution of the chloride threshold [4, 16-17]. The Weibull distribution was developed by Weibull for describing the distribution of processes outcome which are depended on the extreme of random parameter in the process. Later, the mathematic was improved by Weibull, Gumbel, Frechet, Leadbetter, Lindgren, Rootzen, and other mathematicians to create the generalized extreme value distribution (GEVD) and to establish its theory [18]. GEVD is a distribution that represents the extremes from groups of results, i.e. represents the extreme values taken from different sets of measurements that have the same distribution [19-18] and has been used to describe a variety of phenomenon, including pitting corrosion [20], concrete permeability [21], and reliability analysis of reinforced concrete. 1
The assumption that the chloride threshold is determined by the largest defect in the steel-concrete interface, which is being represented by the maximum steel-concrete distance [3], lead to that both maximum steel-concrete distance and
1 Nevertheless, the Weibull distribution is included in the GEVD [18], so this do not reduce from validity of former works where Weibull distribution was used.
chloride threshold distributions are well represented by GEVD. The results reinforces the assumption that the variability of the interface is a major contribution to the chloride threshold. This implies that the GEVD should be used in order to determine the chloride threshold for design and surveillance.
This paper proposes using GEVD for the representation of the distribution of the chloride threshold. The GEVD is a consequence of the corrosion initiation, which is not all over the steel at once, but at the most vulnerable spot, as commonly observed, which where an extreme value is.
2. Methods
2.1. Mix Preparation
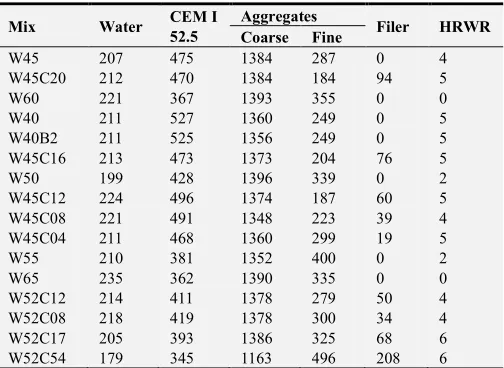
Sixteen different concrete mixes were produced with the following variables: (1) w/c ratios between 0.40 and 0.65; (2) water/powder ratios ranging from 0.91 to 1.36 at constant w/c ratios of either 0.45 or 0.52 where the powders includes all the particles smaller than 0.15 mm in the aggregates, cement, and limestone filler. The amount of powders was adjusted by adding fine limestone powder. The mixes were designed to yield different ITZ properties. The composition of the concrete mixes is given in Table 1. The concrete was mixed according to the following procedure: coarse aggregates were premixed with 70% of total water for 1 min. and allowed to absorb water for an additional 5min in rest. Fine aggregates, cement, powder, the rest of the water, and admixture were then added and mixed for an additional 3min. All mixes slumps were 80mm or higher. Other mix properties, which are irrelevant for the subject, are described in detail elsewhere [13].
Table 1. Concrete mix compositions per 1 m3.
Mix Water CEM I
52.5
Aggregates
Filer HRWR Coarse Fine
W45 207 475 1384 287 0 4
W45C20 212 470 1384 184 94 5
W60 221 367 1393 355 0 0
W40 211 527 1360 249 0 5
W40B2 211 525 1356 249 0 5
W45C16 213 473 1373 204 76 5
W50 199 428 1396 339 0 2
W45C12 224 496 1374 187 60 5
W45C08 221 491 1348 223 39 4
W45C04 211 468 1360 299 19 5
W55 210 381 1352 400 0 2
W65 235 362 1390 335 0 0
W52C12 214 411 1378 279 50 4
W52C08 218 419 1378 300 34 4
W52C17 205 393 1386 325 68 6
W52C54 179 345 1163 496 208 6
2.2. Specimen Preparation
In order to reduce variability, which not arise from the steel-concrete microstructure, special attention was taken to assure uniform rebar preparation. All rebars were treated similarly prior to casting, as follows: immersion in H3PO4 10%
drying, immersion in saturated Ca(OH)2 solution for 24 hours,
drying, and positioning and fixing in molds.
To allow different types of ITZs to form, two types of molds were prepared for each concrete mix, with rebars in either horizontal or vertical orientation, with respect to cast direction. Specimen dimensions were 150 mm x 150 mm x 230 mm and net distance between rebars was 65 mm (Figure 1). Two duplicates were prepared for each rebar orientation. All specimens were cured in water at 20°C for one week and for an additional 21 days at 20°C, 100% RH.
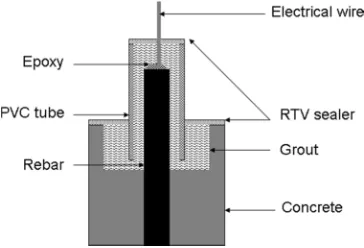
After casting and curing, the exposed rebar tips were protected against corrosion to a depth of 20 mm into the concrete and wired for corrosion measurements. Scheme of rebar tip protection is shown in Figure 2.
Uniform concrete cover was achieved by sectioning the concrete at a distance of 10±2 mm from the surface of one of the rebars. This rebar was exposed to penetration of salt whereas the other rebar was used as reference. The side surface of the concrete close to the sectioned face was coated with room temperature vulcanization (RTV) silicone to ensure unidirectional penetration of the solution (Figure 1c).
Figure 1. Dimensions of specimens for corrosion measurement. (a) Vertical rebar orientation. (b) Horizontal rebar orientation. (c) Specimen after sectioning of one edge to allow 10 mm between exposed face and tested rebar.
Figure 2. Rebar tip protection scheme.
2.3. Corrosion and Chloride Threshold Measurement
The sectioned face of the specimens was subjected to cycles consisting of two weeks immersion to a depth of 5 mm in a 6% (w/w) NaCl solution (Figure 3) followed by two weeks air-drying at 30°C, 30% RH. Corrosion initiation was monitored by measuring the potential difference between the upper and lower rebars of each concrete specimen. The lower rebar was closer to the chloride source and so corrosion was expected to initiate there. The upper rebar was used as an internal reference. Potential was measured against an Ag|AgCl half-cell for validation. A shift in potential of more than 100mV in one day was taken to indicate the breakdown of the passivation layer protecting the steel.
The potential shift indicating corrosion initiation was validated by analyzing several specimens using electrochemical impedance spectroscopy (EIS), which Ann and Song [23] considered to be the method that gives the most accurate information on corrosion. Good correlation was obtained between the two measuring methods, validating the potential shift results. It is important to mention that 100mV potential drop was found to be more accurate than ASTM G109 [17].
Upon detection of active corrosion, sixteen 4 mm diameter bores were drilled in each specimen, along a line parallel to the corroding rebar, 10 mm from the exposed surface. Powder from the bores was collected and dried. After drying, 2 g concrete powder was mixed with 40 ml distilled water, shaken for 2 hours, and allowed to settle for an additional 24 hours. Twenty ml of the supernatant fluid was acidified by adding 1 ml 1M HNO3 and the chloride concentration of the solution
was measured using an ion-selective electrode device. Chloride content was determined first as ‰ (1/1000) of concrete weight.
The moisture content in air dry and saturated were measured to calculate the chloride threshold as [Cl-]. The moisture content was measured by weighing about 300 gr piece of the concrete, not including rebar, at the end of dry cycle, saturating the piece in water for two weeks, weighing again, oven drying in 105⁰C for 24 hours, and weighing again. Moisture content was calculated relative to the oven dry weight.
2.4. Microstructure Measurement
Back-scattered electron (BSE) images were taken from the areas all around the rebar of every mix and every rebar orientation. BSE images were analyzed automatically, as described by Kenny and Katz [24]. In short, two slices of 30mm×30mm×5mm each were prepared for each mix/orientation. The slice prepared perpendicular to the rebar longitudinal axis to show its cross-section and the surrounding concrete. After epoxy impregnation and polishing, the entire perimeter was scanned at x100 magnification to yield high-resolution image in which each pixel corresponds to ~0.65 µm. A total of ~1300 BSE images from 16 mixes and 2 rebar orientations were scanned and analyzed using the modified mean shift algorithm to properly cluster the pixels into the right phase (concrete, steel or void).
The steel-concrete distance, which is the distance from the rebar surface to the nearest concrete particle was calculated for each steel perimeter pixel, by using Euclidian distance on MATLAB image analysis toolbox. Note that steel-concrete distance represents the distance from the steel surface to the nearest concrete solid, including solid deposits on the steel surface.
2.5. Distribution Analysis
The distribution of chloride thresholds found in separated specimens, together with maximum steel-concrete distances, were fitted to different known distributions. Distribution fitting was done using MATLAB R2009b.
3. Results and Discussion
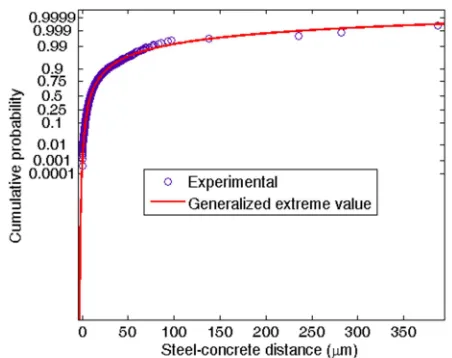
The distribution of the steel-concrete distance differs from commonly used distributions, and is most similar to exponential distribution, excluding its extremes (Figure 4). Ignoring the distribution of the steel-concrete distance, the distribution of the maximum steel-concrete distance in an image, or the maximum steel concrete distance that can be found around a rebar, have a generalized extreme value distribution (Figure 5 and Figure 6 respectively). A variable that is linearly related to another variable that is distributed according to GEVD, has a GEVD as well [19]. Hence, because the maximum steel-concrete distance around a rebar is expected to determine the chloride threshold [2], the chloride threshold itself is expected to have a generalized extreme value distribution.
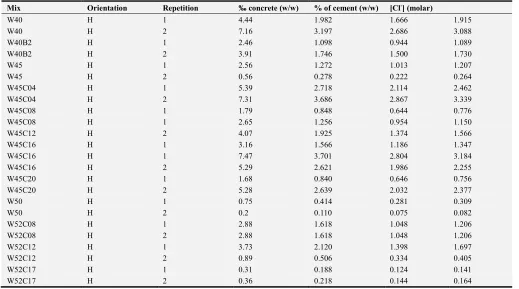
The distribution of chloride thresholds that were found are shown in Table 2. The chloride threshold is best represented by the extreme value distribution (Figure 7 and Figure 8). This is most pronounced in the low cumulative probabilities range (Figure 9). The low cumulative probabilities are most important if the desired goal is to ensure the upper limit for corrosion risk.
For example, if the risk level is set to 5%, the chloride threshold that will be found by using normal distribution will be about 0.9 gr Cl-/kg concrete, while the thresholds found by generalized extreme value distribution and parametric
distribution are about 1.35 and 1.45 gr Cl-/kg concrete, respectively (Figure 9).
Because climate and different cementitious compositions may influence the chloride threshold, the threshold presented here should not be applied directly, because it was obtained for specific cement and environmental conditions.
The same statistics for analysis and to determine risk for corrosion initiation should be applied for other influencing factors, such as: covercrete thickness and concrete permeability. Since, in any real structure, covercrete thickness is varied, due to corrugation of the steel, flexure of the casting frames, and some time bad practice, the risk for corrosion is depended on the places where covercrete is minimal. The probability of such minimal thickness occurrence in specific building is described by GEVD. The permeability of the concrete is also variable, highly depended on local defects, like cracks and insufficient vibration. The critical, i.e. worst, permeability is the maximum one; hence, its occurrence is described by GEVD. The overall process for corrosion initiation depends on the maxima and minima of several properties, yielding GEVD for every corrosion initiation measurement.
Figure 4. Probability plot for the distribution of the steel-concrete distance of one image, fit with an exponential distribution.
Figure 6. Probability plot for maximum steel-concrete distance around a rebar with GEVD fit.
Figure 7. The experimental Clth distribution with some distributions fit to it.
Figure 8. Probability plot for experimental value with some distributions fit to it.
Figure 9. Cumulative probability of the chloride threshold and distributions fitting at low probabilities.
Table 2. Chloride threshold measured (free chloride as ‰ of concrete weight) and calculated to other common threshold representations.
Mix Orientation Repetition ‰ concrete (w/w) % of cement (w/w) [Cl-] (molar)
W40 H 1 4.44 1.982 1.666 1.915
W40 H 2 7.16 3.197 2.686 3.088
W40B2 H 1 2.46 1.098 0.944 1.089
W40B2 H 2 3.91 1.746 1.500 1.730
W45 H 1 2.56 1.272 1.013 1.207
W45 H 2 0.56 0.278 0.222 0.264
W45C04 H 1 5.39 2.718 2.114 2.462
W45C04 H 2 7.31 3.686 2.867 3.339
W45C08 H 1 1.79 0.848 0.644 0.776
W45C08 H 1 2.65 1.256 0.954 1.150
W45C12 H 2 4.07 1.925 1.374 1.566
W45C16 H 1 3.16 1.566 1.186 1.347
W45C16 H 1 7.47 3.701 2.804 3.184
W45C16 H 2 5.29 2.621 1.986 2.255
W45C20 H 1 1.68 0.840 0.646 0.756
W45C20 H 2 5.28 2.639 2.032 2.377
W50 H 1 0.75 0.414 0.281 0.309
W50 H 2 0.2 0.110 0.075 0.082
W52C08 H 1 2.88 1.618 1.048 1.206
W52C08 H 2 2.88 1.618 1.048 1.206
W52C12 H 1 3.73 2.120 1.398 1.697
W52C12 H 2 0.89 0.506 0.334 0.405
W52C17 H 1 0.31 0.188 0.124 0.141
Mix Orientation Repetition ‰ concrete (w/w) % of cement (w/w) [Cl-] (molar)
W52C54 H 2 3.64 2.533 2.084 2.256
W55 H 1 1.45 0.892 0.558 0.645
W55 H 2 2.76 1.699 1.063 1.227
W60 H 1 3.03 1.928 1.077 1.230
W60 H 2 4.62 2.939 1.643 1.875
W65 H 1 7.8 5.003 2.646 2.885
W40 V 1 3.56 1.590 1.336 1.535
W40 V 2 2.56 1.143 0.960 1.104
W40B2 V 1 2.89 1.290 1.108 1.279
W40B2 V 2 3.15 1.406 1.208 1.394
W45 V 1 6.86 3.408 2.716 3.236
W45 V 2 0.31 0.154 0.123 0.146
W45C04 V 2 3.64 1.836 1.428 1.663
W45C04 V 2 3.97 2.002 1.557 1.813
W45C04 V 2 4.84 2.441 1.898 2.211
W45C08 V 1 4.07 1.929 1.465 1.765
W45C12 V 1 5.06 2.393 1.708 1.947
W45C12 V 2 3.44 1.627 1.161 1.323
W45C16 V 1 6.29 3.117 2.361 2.681
W45C16 V 2 3.59 1.779 1.348 1.530
W45C20 V 1 4.44 2.219 1.708 1.999
W45C20 V 2 4.25 2.124 1.635 1.913
W50 V 1 3.44 1.900 1.290 1.417
W50 V 2 3.75 2.071 1.406 1.545
W52C08 V 1 1.86 1.045 0.677 0.779
W52C08 V 2 7 3.932 2.547 2.932
W52C12 V 1 5.16 2.933 1.934 2.348
W52C12 V 2 5.16 2.933 1.934 2.348
W52C17 V 1 3.14 1.902 1.253 1.431
W52C17 V 2 6.14 3.719 2.450 2.799
W52C54 V 2 2.16 1.503 1.237 1.339
W55 V 1 8.33 5.127 3.207 3.703
W55 V 2 7 4.308 2.695 3.112
W60 V 2 1.42 0.903 0.505 0.576
W60 V 2 2.91 1.851 1.035 1.181
W65 V 1 7.98 5.118 2.707 2.952
W65 V 2 8.15 5.228 2.765 3.014
4. Conclusions
The results presented in this paper may have a wider application than durability of reinforced concrete only. Many corrosion initiation processes may behave similarly, therefore the below conclusions may be adopted.
i. The distribution of chloride thresholds in concrete, which can be found in field or laboratory, should be interpreted as generalized extreme values.
ii.Adapting GEVD distribution allows more accurate assessment of the risk of corrosion. This can be used in a. building surveys
b. assessing corrosion risk in the design stage c. establishment of standards
Acknowledgements
This work was supported by GIF I –786-94.10/2003
References
[1] Schiessl, P.; Raupach, M., "Influence of concrete composition and microclimate on the critical chloride content in concrete," in Corrosion of Reinforcement in Concrete, London, Elsevier Applied Science, 1990, pp. 49-58.
[2] M. Ehlen, "Life-365 Service Life Prediction Model and Computer Program for Predicting the Service Life and Life-Cycle Cost of Reinforced Concrete Exposed to Chlorides," Concrete Corrosion Inhibitors Association, the National Ready Mix Concrete Association, the Slag Cement Association, and the Silica Fume Association, 2009.
[3] Kenny, The micro structure of concrete around embedded steel influence on the chloride threshold for chloride induced corrosion, Haifa: Technion - Israel Institute of Technology, 2012.
[5] L. Bertolini, F. Bolzoni, T. Pastore and P. Pedeferri, in
Corrosion of Reinforcement in, Cambridge, SCI, 1996, p. 389. [6] C. Alonso, M. Castellote and C. Andrade, "Chloride threshold
dependence of pitting potential of reinforcements,"
Electrochimica Acta, vol. 47, no. 21, 2002.
[7] S. S. Y. O. B. Jang, "Experimental investigation of the threshold chloride concentration for corrosion initiation in reinforced concrete structures," Magazine of Concrete Research, vol. 55, no. 2, 2003.
[8] Andrade, C.; Keddam, M.; Novoa, X. R.; Perez, M. C.; Rangel, C. M.; Takenouti, H., "Electrochemical behavior of steel rebars in concrete: influence of environmental factors and cement chemistry," Electrochemica Acta, vol. 46, no. 24-25, pp. 3905-3912, 2001.
[9] Glass, G. K.; Reddy; B., "The Influence of the Steel Concrete Interface on the Risk of Chloride Induced Corrosion Initiation,"
Corrosion of Steel in Reinforced Concrete Structures, COST 521, Final Workshop, pp. 227-232, 18-19 February 2002. [10] T. Vidal, A. Castel and R. Francois, "Corrosion process and
structural performance of a 17 year old reinforced concrete beam stored in chloride environment," Cement and Concrete Research, vol. 37, no. 11, pp. 1551-1561, 2007.
[11] J. Galvele, "Transport processes and the mechanism of pitting of metals," Journal of the Electrochemical Society, vol. 123, no. 4, pp. 464-474, 1976.
[12] Alonso, C.; Andrade, C.; Rodriguez, J.; Diez, J. M., "Factors controlling cracking of concrete affected by reinforcement corrosion," Materials and Structures/Materiaux et Constructions, vol. 31, no. 211, pp. 435-441, 1996.
[13] Kenny, Amit; Katz, Amnon, "Statistical relationship between mix properties and the interfacial transition zone around embedded rebar, " Cement & Concrete Composites, vol. 60, pp. 82-91, 2015.
[14] C.-h. LU, W.-l. JIN and R.-g. LIU, "Probabilistic Lifetime Assessment of Marine Reinforced Concrete with Steel,"
Chinese Ocean Engineering, vol. 25, no. 2, pp. 305-318, 2011. [15] F. Lollini, E. Redaelli and L. Bertolini, "Analysis of the parameters affecting probabilistic predictions of initiation time for carbonation‐induced corrosion of reinforced concrete
structures, " Materials and Corrosion, vol. 63, no. 12, pp. 1059-1068, 2012.
[16] R. Polder, "Critical chloride content for reinforced concrete and its relationship to concrete resistivity, " Materials and Corrosion, vol. 60, no. 8, p. 623—630.
[17] X. S. W. H. H. B. L. Hu Yu, "Laboratory investigation of reinforcement corrosion initiation and chloride threshold content for self-compacting concrete," Cement and Concrete Research, vol. 40, no. 10, pp. 1507-1516, 2010.
[18] S. Coles, An Introduction to Statistical Modeling of Extreme Values, Verlag London Berlin Heidelberg: Springer, 2001.
[19] S. N. Kotz, Extreme Value Distributions: theory and applications, London: Imperial College Press, 2000.
[20] Darmawan, M. S; Stewart, M. G., "Effect of pitting corrosion on capacity of prestressing wires," Magazine of Concrete Research, vol. 59, no. 2, pp. 131-139, 2007.
[21] Alarcon-Ruiz, L. A.; Brocato, M. B., "Size effect in intrinsic permeability measurements," in Conference of American Nuclear Society - International Congress on Advances in Nuclear Power Plants, 2005.
[22] Liang, M.-T.; Lan, J.-J., "Reliability analysis of an existing reinforced concrete wharf laden in a chloride environment,"
Journal of the Chinese Institute of Engineers, Transactions of the Chinese Institute of Engineers, Series A/Chung-kuo Kung Ch'eng Hsuch K'an, vol. 26, no. 5, pp. 647-658, 2003. [23] Ann, K. Y.; Song, H.-W., "Chloride threshold level for
corrosion of steel in concrete," Corrosion Science, vol. 49, pp. 4113-4133, 2007.
[24] Kenny and A. Katz, "Characterization of the interfacial transition zone around steel rebar by means of the mean shift method," Materials and Structures/Materiaux Et Constructions,
vol. 45, no. 5, pp. 639-652, 2012.