A Tripartite-Graph Based Recommendation Framework
for Price-Comparison Services
?Sang-Chul Lee1, Sang-Wook Kim1, Sunju Park2, and Dong-Kyu Chae1
1 Department of Computer and Software
Hanyang University, Republic of Korea {korly, wook, kyu899}@hanyang.ac.kr
2
School of Business Yonsei University, Republic of Korea
Abstract. The recommender systems help users who are going through numerous items (e.g., movies or music) presented in online shops by capturing each user’s preferences on items and suggesting a set of personalized items that s/he is likely to prefer [8]. They have been extensively studied in the academic society and widely utilized in many online shops [33]. However, to the best of our knowledge, recom-mending items to users inprice-comparison serviceshas not been studied extensively yet, which could attract a great deal of attention from shoppers these days due to its capability to save users’ time who want to purchase items with the lowest price [31]. In this paper, we examine why existing recommendation methods cannot be directly applied to price-comparison services, and propose three recommendation strategies that are tailored to price-comparison services: (1) using click-log data to identify users’ preferences, (2) grouping similar items together as a user’s area of interest, and (3) exploiting the category hierarchy and keyword information of items. We implement these strategies into a unified recommendation framework based on a tripartite graph. Through our extensive experiments using real-world data obtained from Naver shopping, one of the largest price-comparison services in Korea, the proposed framework improved recommendation accuracy up to 87% in terms of precision and 129% in terms of recall, compared to the most competitive baseline.
Keywords:recommendation systems, price-comparison services, random walk with restart.
1.
Introduction
Most online shoppers are price sensitive. Since the price of an item may differ from one site to another, the shopper who is looking for a bargain has to visit many shopping sites to compare prices. To save the users’ efforts, major portals, such as Google3, Yahoo!4, Bing5,
and Naver6, provide aprice-comparison service.The price-comparison service is useful to the users who know exactly what they are looking for. The user who only has a vague
?Corresponding author: Sang-Wook Kim ([email protected]) 3Google shopping, http://shopping.google.com
idea about the item of his interest, on the other hand, still needs to go through numerous items presented by the price-comparison service to narrow their search. Arecommendation system[1, 21, 34, 38, 46], if provided in conjunction with the price-comparison service, can aid the user in the process of finding preferable item(s).
When a price-comparison site adopts the traditional recommendation systems, it may face several difficulties. If the price-comparison site does not keep record of users’explicit feedbacks[28, 30] such as item ratings and purchasing history, it cannot directly utilize the recommendation systems with them. The price-comparison site often suffers from gathering users’ explicit feedbacks because it does not sell items but provide link to each shopping mall selling the items. Therefore, we can consider using implicit feedbacks such as click log and search log [19].
The recommendation systems based on implicit feedback, however, cannot produce high-quality recommendation because of the following two distinct characteristics of the price-comparison service. First, the same item may be regarded as different in online shopping, since online shopping sites often use different titles for the same item. This makes it difficult to differentiate whether two users have clicked or searched the same item or different items. Thus, the recommendation system with implicit feedbacks may not be able to correctly compute the similarity [17, 24, 56] between users’ preferences. Second, most users utilize the price-comparison service without log-in, and thus the price-comparison service provider cannot collect enough data about the user’s history on clicked or searched items. In this situation, the existing recommendation systems suffer from thecold-start problem [1, 26, 43, 46], one of the well-known problems of recommendation systems. Because two cold-start users have few items in common, their preferences cannot be compared. If most users are regarded as cold-start users, as in price-comparison services, the recommendation system with implicit feedbacks would produce low-quality recommendation.
In this paper, we propose the strategies for improving the quality of recommendation at price-comparison service sites. First, we use log data for recommendation. Click log is used to identify user’s preference and search log is used to filter out previously searched items from recommendation. Second, we group similar items together, and the grouped items are used as a unit of user’s preference. Using this strategy, we not only avoid the problem of the same item being regarded as different, but also effectively alleviate the data-sparsity problem. Third, we use similarities between groups to reinforce a user’ preference represented by the groups. Since the user tends to prefer the items in the groups similar to the groups that have the items preferred in the past, this strategy can mitigate the cold-start problem.
To adopt the proposed strategies, we need to capture the relationships (1) between users and similar-item groups and (2) between groups. In this paper, we propose a rec-ommendation framework based on a tripartite graph. The proposed framework constructs a graph with nodes corresponding to users, similar-item groups, and groups’ features, and links corresponding to the relationships between users and similar-item groups and those between groups and groups’ features. Random walk with restart (RWR) [41] on the tripartite graph finds the groups a user is likely to prefer. Then, our framework recommends a set of items to the user from the selected groups.
methods. We note the following. First, the quality of recommendation of the proposed framework is improved when each additional recommendation strategy is adopted. Second, the recall and the precision of the proposed framework are superior to the existing methods for randomly selected users. Third, the recall and the precision of the proposed framework are also superior to the existing methods for cold-start users. Finally, the user study validates that the proposed framework provides more meaningful recommendations than the existing methods.
The rest of this the paper is organized as follows. Section 2 reviews existing recom-mendation methods. Section 3 discusses the motivation for a new recomrecom-mendation system for price-comparison services and proposes three recommendation strategies and the rec-ommendation framework. Section 4 examines the performance of the proposed framework through extensive experiments. Section 5 summarizes and concludes the paper.
2.
Related Work
This section briefly reviews several categories of existing recommender systems, including (1) traditional collaborative filtering, (2) group recommendation, (3) implicit feedback based recommendation, and (4) graph-based recommendation using Random Walk with Restart.
The collaborative-filtering approach recommends the items that the users with the tastes and interests similar to the target user liked in the past. The collaborative-filtering approach can be further classified into user-based [6, 9, 23, 27, 29, 44, 47], item-based [22, 37, 45], and graph-based [11, 13, 35, 40, 52, 55] methods. The collaborative-filtering method suffers the cold-start problem, because the taste and interest of a new user can rarely be identified. It also cannot recommend new items which have not yet accrued a sufficient number of ratings.
Recently, several group-recommendation approaches have been proposed [2, 3, 5]. The main goal of these approaches is to maximize the total satisfaction of a target group rather than a single user. Since most of them are based on collaborative filtering while employing some aggregation methods, they also suffer from the inherent shortcomings of collaborative filtering, such as data sparsity and cold-start problems.
Since the above approaches rely on explicit user feedbacks, recommendation is not possible when user-ratings are unavailable. In comparison, some recommendation methods, in particular for web personalization, use ‘implicit’ click log data or search history data instead of ‘explicit’ user-ratings [4, 7, 12, 14, 19, 32, 36, 42, 49, 50, 54, 57]. These methods infer the user’s preference from the items clicked by the user. They regard the clicks on items as an indirect indication of the user’s preference on these items. These approaches could make users free from the burden of providing explicit ratings on items. Also, we do not care whether the ratings are trustable or not [39]. In many cases, however, the quality of recommendation could be unsatisfactory because clicks on items do not always indicate users’ preferences [42].
Another research line that are relevant to our work is theRandom Walk with Restart
provide high accuracy and also known to be useful in the case of analyzing heterogeneous relationships [27, 40]. Like collaborative filtering, we assume that the user would prefer the items clicked by the other users who have clicked on many items clicked by him. Also, the user would prefer the items whose features are similar to those of the items clicked by him. If users, items, item-features, and the relationships among them are modeled as a graph, the RWR can be used to find out the proximity of a user to another users, items, and item-features by reaching each node starting from him. The user would like a user, item or item-feature close to him on the graph even he has never seen before. Thus, we use the proximity to recommend items.
Until now, we have summarized various technologies on recommender systems. How-ever, to the best of our knowledge, there have not been any recommender systems that target the users in price-comparison services. We notice that the following two papers are the most relevant to our research: Lee et al. [31] detected fraudulent users in price-comparison services by analyzing their click logs from the viewpoint of several aspects such as the number of clicks on a single item, a click interval, and a diurnal activity pattern; Gupta et al. [16] performed comprehensive study of analyzing user behaviors and uncovering meaningful characteristics, e.g., “a user’s purchase is highly correlated with the time spent on the site and the search queries s/he wrote before coming on the website”. However, these studies do not provide a working algorithm for recommendation; to the extent of our knowledge, our work is the first one to study a recommender system that works in price-comparison services.
3.
Proposed Approach
In this section, we first point out, via preliminary experiments, the problems of using existing implicit-feedback based recommendation methods that infer a user’s preference from every single item evaluated or clicked by the user [4, 14, 19]. Then, we present our proposed recommendation framework that successfully remedies the problems and recommends plausible items to users in price-comparison services.
3.1. Motivation
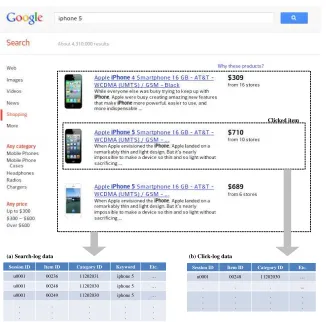
Figure 1 represents the price-comparison process atGoogle Product Search. The user searches items with keyword ‘iPhone5,’ receives a list of items whose description contains the keyword, and clicks on some of the items on the list to obtain more detailed information or to purchase them. Search and click reveal the user’s preference indirectly, and click, in particular, provides a stronger evidence of his preference between the two. Figures 1 (a) and (b) show search log and click log, respectively. From Figure 1 (b), we infer that the user prefers black iPhone 5 to white iPhone5 or iPhone4.
Clicked item
Session ID Item ID Category ID Keyword Etc.
u0001 00236 11202031 iphone 5 …
u0001 00248 11202030 iphone 5 …
u0001 00249 11202030 iphone 5 …
Session ID Item ID Category ID Etc.
u0001 00248 11202030 …
đ
(a) Search-log data (b) Click-log data
Fig. 1.An example of the price-comparison process.
Table 1.An example of the recommendations of the items identical to the previous history
user-CF item-CF rwr-CF
1 safari-style jacket safari-style jacket safari-style jacket 2 other jacket other jacket safari-style jacket 3 safari-style jacket safari-style jacket safari-style jacket 4 safari-style jacket padding jacket safari-style jacket 5 padding jacket safari-style jacket safari-style jacket Categories clicked by the target user in the past: safari-style jack-ets, alpaca wool overcoats, shoulder strap bags, kettles, digital cam-eras
respectively. Note that we used the number of clicks on each item as a surrogate for an item rating.
Table 2.An example of irrelevant recommendation or no recommendation
user-CF item-CF rwr-CF
1 2GB USB memory stick -
-2 off shoulder knit -
-3 character printed T-shirt -
-4 backpack -
-5 backpack -
-Categories clicked by the target user in the past: sofas, tables, sheet papers
that all three methods recommend the items almost identical to the ones the target user has searched or clicked in the past. Further investigation reveals that the target user in Table 1 has a history of clicking items related to fashion and electronics. Table 2 shows that user-based collaborative filtering recommends the items completely irrelevant to the target user’s interest, while the other two methods cannot recommend any items. This phenomenon frequently occurs to cold-start users.
The experiments reveal three potential problems in the existing recommendation methods when applied to price-comparison services: (1) almost identical items are rec-ommended, (2) irrelevant items are recrec-ommended, or (3) no item is recommended. These problems happen because of two reasons. First, online shopping malls often describe the same items with slightly different titles, which are regarded as different items by the comparison service. As a result, instead of recommending diverse items, the price-comparison service would recommend nearly identical items. Second, because the user is not required to login to use the price-comparison service, the user log keeps the record of the activities during his short session time only. If the record of the target user is limited, the existing methods cannot find users similar to the target user and thus recommend irrelevant items or no item. Note that these problems are unavoidable in recommendation for the price-comparison service. In the following, we propose the strategies to alleviate these two problems.
3.2. Strategies for Recommendation
To provide high-quality recommendation to the user, we propose three strategies for the recommendation systems in price-comparison services. The first strategy is to use log data not only for identifying users’ preferences but also for filtering out some items from a recommendation. Generally, the log data is only used for identifying users’ preferences. Similarly, we identify the user’s preference using clicked items and the number of clicks on them. In addition, we use search log for filtering out the items that are already searched when recommending items to the user.
the same. If an individual item is used as the unit of user’s preference, the same item is frequently regarded as different in online shopping, and as a result, the similarity between users’ preferences may be inaccurately computed. For instance, suppose that itemiis listed asiAandiBin a price-comparison service, and two users have clicked oniAandiB,
respectively. Although they practically have similar preference, they would be considered to have different preferences. The second strategy groups similar items using clustering methods7and uses the similar-item group as the unit of user’s preference. We call the group aninterest-field.
To solve the cold-start problem, we propose the third strategy of securing additional interest-fields by utilizing similarities between interest-fields. As most users utilize the price-comparison service without log-in, their preferences contain only a small number of interest-fields, which would produce low-quality recommendation, as shown in Table 2. We collect additional interest-fields by including interest-fields similar to those preferred by the user in the past. The similarity of two interest-fields can be measured by the similarity of the descriptions of items in them and/or the closeness of the items in the category hierarchy. Here, the descriptions of items and the categories to which items belong are called the features of interest-fields. If we utilize the similarities between interest-fields to secure more interest-fields, the recommendation system would produce higher-quality recommendation even to the cold-start users. We use the three strategies to find the interest-fields that the target user may prefer. After finding the interest-fields, we should recommend individual items from the interest-fields. In the next section, we explain how to practically adopt the three strategies and how to select the individual items in detail.
3.3. The Recommendation Framework
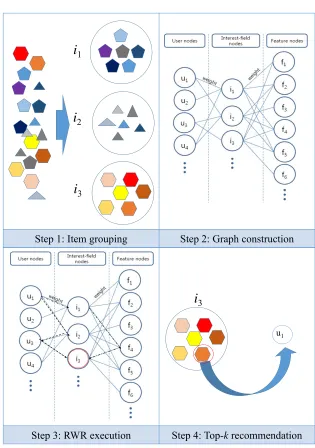
Our recommendation framework consists of four steps, as shown in Figure 2. The first three steps are performed offline, and the last is done online at the time of item search. At Step 1, the framework groups a set of similar items together. At Step 2, it constructs a tripartite graph using the relationships among users, items, and item-features. At Step 3, it identifies the user’s preference on items by performing the RWR on the tripartite graph. Note that these three steps can be performed beforehand. At Step 4, the framework recommends a set of items based on the preferences identified in Step 3 in response to the user search.
For Step 1, we use the lowest level in the category hierarchy as the item group, and call it an ‘interest-field.’ We believe it is more practical and economical to use the category hierarchy which has been already well-organized by portals than employing some clustering methods, such ask-means.
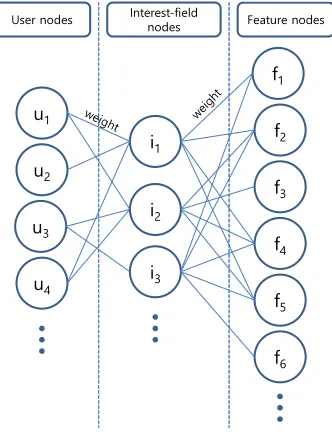
For Step 2, we have developed a tripartite-graph based recommendation framework. The graph consists of three types of nodes: users, interest-fields, and features. The user node is the user who has clicked at least one item. The interest-field node is a group of identical or similar items. The feature node is either the keyword in the item descriptions or the name of a higher-level category.
There exist two types of links. The link between the user node and the interest-field node indicates that the user has clicked some items in the interest-field. The link between
Step 1: Item grouping Step 2: Graph construction
i
1i
3i
2Step 3: RWR execution Step 4: Top-krecommendation
i
3u1
Fig. 2.The detail steps in the proposed framework.
8VHUQRGHV
X
X
X
X
L
I
I
I
I
I
I ,QWHUHVWILHOG
QRGHV )HDWXUHQRGHV
L
L
Fig. 3.The tripartite graph used in the proposed framework.
For Step 3, our framework employs Random Walk with Restart (RWR). Equation 1 describes the RWR process. In Equation 1, matrixAis the adjacency matrix representing the tripartite graph. The size of the matrix is the number of all nodes by the number of all nodes, and each cell represents the weight of each link. There exists no link between two nodes of the same type and its value is 0. The vectorRiis the proximity vector of the user
where each element is the proximity value of the node on the graph at thei-th step. The initial proximity vectorR0is set 1 for the node corresponding to the target user, otherwise set 0. The vectorEis the restart vector and set as the same as the initial proximity vector R0. The restart vector is needed to recursively restart from the target user node. The first part of Equation 1 is the random walk to each node in a graph from the target user node, and the second part represents the restart from the target user node. The probabilityα between two parts of RWR is normally set as 0.85 /citeKon09, Onu09. RWR is recursively computed until the vectorRiconverges.
Ri+1=αARi+ (1−α)E (1)
Because of the large size of adjacency matrixA, it is infeasible to directly compute RWR at runtime. For instant online recommendation, the framework pre-computes the proximity vectorsRrepresented users’ preferences for all users using the fast RWR [48]. Equation 1 represents the ‘converged’ proximity vectorR. In order to computeR, Equation 1 is transformed into Equation 2. In Fast RWR, the proximity vectors of all users are computed without recursion if the inverse matrix of(I−αA)is known in advance. Since the inversion of a large matrix is difficult to compute, we use the technique of partitioning the original graph with Metis and combining the inversions of small matrices [25]
Using the proximity vectorR, the framework selects the interest-fields with high proximity values. Even though the proximity value of an interest-field is high, if the user has already clicked on several items in that interest-field, he would not want to see more items from it. The framework filters out the interest-fields that have received more than a pre-set number of clicks before recommending individual items.
For Step 4, we suggest the following criteria. First, the item that has been clicked or searched is filtered out from recommendation. Exclusion of these items is justified because either the target user has already seen the detailed information of clicked items or he has ignored the items searched but not clicked on purpose. Second, the popularity and/or recentness of items should be considered. The popularity of an item is captured in the total number of clicks it has received, and its recentness is found by the release date. Different price-comparison service providers may use different policies in using the popularity and recentness criteria. For instance, if the provider considers popularity more important, it may recommend an item with a higher number of clicks. On the other hand, if the provider considers recentness more important, it may recommend an item with more recent release date, which can alleviate the latency problem.
Next, we examine the time complexity of each step in order to understand our frame-work in the performance perspective. In step (1), for having a set of similar items grouped together, we just employ the category hierarchy, which has already been organized by domain experts. So, the time complexity of this step is O(1). In step (2), the time complexity of constructing a tripartite graph is O(e), whereeindicates the number of edges in a graph. In step (3), the time complexity of performing RWR on a tripartite graph is again O(e). In step (4), for top-krecommendation, we need to sort all the interest fields according to their RWR scores. Thus, its time complexity is O(IlogI), whereIindicates the number of interest fields.
3.4. Link Weights
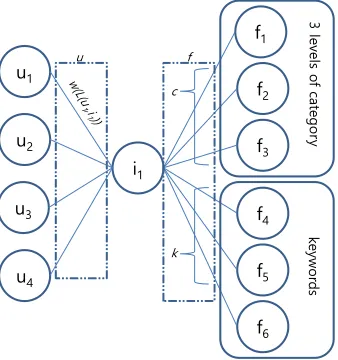
The weight of a link captures the degree of either how much a user prefers an interest-field or how closely related an interest-field and a feature are. Figure 4 shows an example of two types of links connected to a single interest-field node. Here, the feature node is classified into two types: category feature node and keyword feature node.
The number of clicks from user a to interest-fieldxis used as the weight of link L(ua, ix). The link is weighted according to the number of clicks. Unlike the relationship
between a user and an interest node, there is little evidence how important a link between an interest-field and a feature node is. In the case of thecategoryfeature node, the framework assigns different weights for different levels in category hierarchy. For example, Naver Shopping categorizes an item into four levels. Each interest field (i.e., the lowest-level category) is connected to three upper-level category feature nodes, and the weights of those links are set by parameterss,m, andl, wheres,m, andlare small, medium, and large levels of product category hierarchy, respectively. On the other hand, since it is difficult to determine which keywords are more important to an interest-field, the same weights are assigned for the links between an interest-field and thekeywordfeature nodes.
Even with the weights assigned, we still face the problem of determining which type of link is more important. Suppose that useru1clicks 10 times on interest-fieldsi1and
X X X X L I I I I I I OH YH OV R IF D WH J R U\ NH \Z R UG V X I F N
Fig. 4.An example of the weight of links centering an interest-field.
The framework is designed to control the relative importance of two types of links, L(u, i)andL(i, f), using parametersuandf. Equation 5 represents the ratio between two links. In Equation 5,Uxis the set of users who have clicked items in interest-fieldx, and Fxis the set of the features of interest-fieldx. Whenu:f equals to 1:0, the framework
is the same as the graph-based collaborative filtering method. When u:f is close to 0:1, the framework is similar to the content-based recommendation method. In this regard, the framework is one of the hybrid methods.
X
ua∈Ux
w(L(ua, ix)) :
X
fb∈Fx
w(L(ix, fb)) =u:f (3)
The relative ratio between category feature nodes and keyword feature nodes is deter-mined in a similar way, using parameterscandk. Equation 6 represents the ratio between the link from an field node to a category feature node and the link from an interest-field node to a keyword feature node. In Equation 6,F Cxis a set of the category feature
nodes of interest-field nodex, andF Kxis a set of the keyword feature nodes ofx.
X
fa∈F Cx
w(L(ix, fa)) :
X
fb∈F Kx
w(L(ix, fb)) =c:k (4)
4.
Evaluation
data (i.e., the hierarchy of product categories and the keywords in the item descriptions), and their extension to fit our data is non-trivial and extremely difficult; we leave this task for our future work.
4.1. Experimental Setup
For experiments, we used the search and click log data of Naver Shopping. Each data point in the search log is composed of the user, the search keywords, and the list of searched items. Each data point in the click log is composed of the user and the list of clicked items. The search log consists of 10,000 users and 9,099,698 items, and the click log consists of 9,997 users and 310,841 items. Since we do not have any login information about users, we regard each session, created when a user visits the shopping mall site, as an identical user. As shown in Figure 5, Naver shopping classifies items into four-level category hierarchy: large, medium, small, and detail category levels. Each level consists of 19, 231, 1461, and 4282 categories, respectively.
Fig. 5.The Product Category Hierarchy of Naver Shopping.
Before comparing the performance of our framework against other existing methods, we performed two sets of experiments. The first set of experiments was to determine the parameters for the proposed framework (experiment 1). The second set of experiments was self-evaluation, analyzing the performance of the proposed framework by successively adding the second and the third strategies (experiment 2). The performance-comparison experiments with other methods were performed with general users (experiment 3) and cold-start users (experiment 4). We also conducted a user study (experiment 5).
That is, we also evaluated whether the recommendation methods can recommend the detail categories that are the siblings of the ones in the test set.
For experiment 4, we could not evaluate recommendations for real cold-start users because most of them were anonymous users without log-in. Even if some of them were not anonymous users, we still could not find out profiles of them because of privacy issues. So, we generated cold-start users from 706 users who had originally clicked 30 to 80 categories. For each user, five randomly-selected categories were used as a training set and the rest were used as a test set. In addition to the two evaluations mentioned above, we also investigated whether the increase in the number of categories the users had clicked had an impact on the quality of recommendation.
We used three metrics: recall, precision, and coverage, as defined below [18]. The correct-answer items are defined as the items in the test set. Recall is the ratio of recom-mended correct-answer items to all correct-answer items. Precision is the percentage of recommended correct-answer items to all recommended items. Finally, the coverage is the percentage of users who received recommendation. The coverage metric is used in experiment 4 only, where many cases with no recommendation are reported.
recall= |{correct−answer items} ∩ {recommended items}|
|{correct−answer items}| (5)
precision= |{correct−answer items} ∩ {recommended items}|
|{recommended items}| (6)
coverage= #of target users received the recommendation
the number of target users (7)
For experiment 5, we conducted a user study with seven volunteers. Ideally, real users should be judging the quality of the items recommended by each method. It is difficult, however, to identify real users because of the privacy issue for gathering user profiles. Instead, each volunteer manually selected top five users or a single user similar to himself, and evaluated whether the recommendations were useful or not.
4.2. Experimental Results
Experiment 1: Parameter settings for Naver Shopping In this section, we conducted a set of experiments to determine the optimal parameter values for Naver Shopping. The proposed framework should set the weight-ratio parameters:u: f for two types of relationships between users and interest-fields and between interest-fields and features,c:kto handle the importance of links to two types of features, ands:m:lto reflect the levels of the category hierarchy. Table 3 shows the parameter values tried in the experiments. In Table 3, the boldfaced and underlined numbers are the default values for the respective parameters. For example, when we tried out different settings foru:f, we fixed the values ofc:k ands:m:lto 2:1 and 1:1:1, respectively.
Table 3.Parameter settings
Parameters Values
u:f 1:4, 1:3, 1:2,1:1, 2:1, 3:1, 4:1 c:k 1:0, 3:1,2:1, 1:1, 1:2, 1:3, 0:1 s:m:l 1:1:1, 3:2:1, 5:3:1, 4:2:1, 9:3:1
recommended for the user who has three categories as his answer set. The maximum precision can be lower than 0.3 since most users have clicked less than 20 categories. As shown, the best parameter setting for Naver Shopping is found to beu:f = 1 : 1, c:k= 2 : 1, ands:m:l= 1 : 1 : 1. The only exceptions are the cases where 20 detail-level interest-fields are recommended. In practice, most providers want to recommend far less than 10 items, and thus this exception should not pose any real problem. Also, the best accuracy is obtained when the ratio ofcandkis 2:1 in Table 5. The relative importance of the category compared to keywords is because the category is organized well by domain experts, while the keyword is formulated by normal users, not experts. In the following experiments, the best parameter values,u:f = 1 : 1,c: k= 2 : 1, and s:m:l= 1 : 1 : 1, are used.
Table 4.The accuracy of recommendation while changingu:f
(10 interest-fields, 20 interest-fields) level Accuracy (detail level) Accuracy (small level) u:f Precision Recall Precision Recall
1:4 0.018,0.0140.107,0.1720.035, 0.021 0.207, 0.247 1:3 0.014, 0.010 0.088, 0.132 0.025, 0.018 0.165, 0.227 1:2 0.013, 0.011 0.093, 0.158 0.031, 0.020 0.205, 0.253 1:1 0.022, 0.0120.142, 0.1570.037,0.022 0.238,0.277 2:1 0.017, 0.011 0.098, 0.127 0.029, 0.019 0.183, 0.230 3:1 0.012, 0.007 0.085, 0.090 0.022, 0.017 0.145, 0.208 4:1 0.010, 0.008 0.072, 0.103 0.023, 0.018 0.160, 0.237
Experiment 2: Self-evaluation In this section, we demonstrate the improvement in accuracy by applying the second and the third recommendation strategies successively to the first strategy of using log data (i.e., implicit-feedback based recommendation)8.
In the first set of experiments, we compared the recommendation method using user & item bipartite graph, and the one using user & interest-field bipartite graph. The former is the default method, while the latter utilizes the second strategy that adopts the concept of interest-fields to the existing graph-based method. Since the former recommends items
8Since Naver shopping does not collect the user’s explicit feedback such as the item ratings, the first strategy of
Table 5.The accuracy of recommendation while changingc:k
(10 interest-fields, 20 interest-fields) level Accuracy (detail level) Accuracy (small level) c:k Precision Recall Precision Recall
1:0 0.018, 0.012 0.125, 0.150 0.032, 0.020 0.202, 0.247 3:1 0.015, 0.009 0.093, 0.100 0.031, 0.021 0.183, 0.258 2:1 0.022,0.012 0.142,0.157 0.037,0.022 0.238,0.277 1:1 0.019, 0.012 0.113, 0.133 0.029, 0.018 0.180, 0.218 1:2 0.015, 0.010 0.103, 0.132 0.023, 0.018 0.147, 0.213 1:3 0.016, 0.010 0.105, 0.127 0.028, 0.020 0.172, 0.228 0:1 0.015, 0.009 0.100, 0.113 0.023, 0.019 0.143, 0.223
Table 6.The accuracy of recommendation while changings:m:l
(10 interest-fields, 20 interest-fields) level Accuracy (detail level) Accuracy (small level) s:m:l Precision Recall Precision Recall
1:1:1 0.022, 0.0120.142, 0.1570.037,0.022 0.238,0.277 3:2:1 0.015, 0.011 0.093, 0.130 0.028, 0.019 0.170, 0.237 5:3:1 0.012, 0.010 0.080, 0.120 0.022, 0.016 0.135, 0.177 4:2:1 0.021,0.0130.135,0.1700.033, 0.022 0.208, 0.257 9:3:1 0.013, 0.009 0.083, 0.112 0.026, 0.017 0.157, 0.157
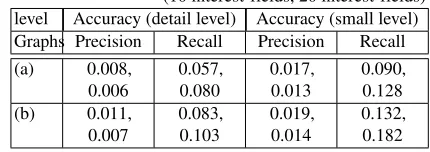
while the latter recommends interest-fields, we used the lowest-level categories that con-taining the items recommended by the former for comparison. Table 7 shows the recall and precision with 10 or 20 recommendations by two methods. The results show that the second strategy performed better and confirm our claim that using interest-fields is more advantageous to identify user’s preference than using items.
Table 7.The accuracy comparison when applying the second strategy: (a) user & item
bipartite and (b) user & interest-field bipartite
(10 interest-fields, 20 interest-fields) level Accuracy (detail level) Accuracy (small level) Graphs Precision Recall Precision Recall (a) 0.008,
0.006
0.057, 0.080
0.017, 0.013
0.090, 0.128 (b) 0.011,
0.007
0.083, 0.103
0.019, 0.014
0.132, 0.182
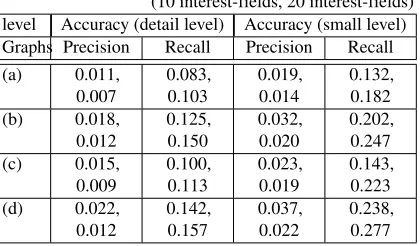
is based on the second strategy, while the latter utilizes the third recommendation strategy in addition. Three cases with different features were analyzed: using category-hierarchy only, using keyword only, and using both category hierarchy and keyword. As shown in Table 8, the method with both category hierarchy and keyword information exhibited the highest accuracy. Compared to the methods using a single feature, the method using both category hierarchy and keyword information can secure more interest-fields that are not clicked but are likely to be preferred by a user. In the following experiments, we use the graph-based method with a tripartite graph using both features.
Table 8.The accuracy comparison when applying the third recommendation strategy: (a)
User & interest-field bipartite, (b) tripartite (category hierarchy), (c) tripartite (search keyword) and (d) tripartite (both)
(10 interest-fields, 20 interest-fields) level Accuracy (detail level) Accuracy (small level) Graphs Precision Recall Precision Recall (a) 0.011, 0.007 0.083, 0.103 0.019, 0.014 0.132, 0.182 (b) 0.018, 0.012 0.125, 0.150 0.032, 0.020 0.202, 0.247 (c) 0.015, 0.009 0.100, 0.113 0.023, 0.019 0.143, 0.223 (d) 0.022, 0.012 0.142, 0.157 0.037, 0.022 0.238, 0.277
Experiment 3: Cases with general users In this set of experiments, we compared the performance of the proposed framework with three existing methods (rwr-CF, user-CF, item-CF, user-OCCF, item-OCCF) for general warm-start users. Since the existing methods recommend items, for fair comparison, we let the existing methods recommend items until the number of distinct interest-fields reaches 10 or 20.
Table 9 shows the results of the recall and precision of each method with different category-levels for evaluation. It is observed that the proposed framework performed better than the existing methods in terms of accuracy. Since the accuracy of user-OCCF at the detail category level is too low, the results of user-OCCF at the detail level are not reported in Table 9. At the detail category level, the proposed framework improved precision by 77% to 150%, recall by 54% to 119%, and F-measure by 134% to 223% over the existing methods when 10 interest-fields were recommended, and improved precision by 19% to 90%, recall by 5% to 68%, and F-measure by 74% to 89% when 20 interest-fields were recommended. At the small category level, the proposed framework improved 18% to 87% of precision, 48% to 129% of recall, and 69% to 92% of F-measure when 10 interest-fields were recommended, and improved 0% to 48% of precision, 27% to 87% of recall, and 29% to 51% when 20 interest-fields were recommended.
do not classify two users as similar if they have never clicked identical items but have clicked similar items, they are regarded similar when interest-fields are used as the unit of recommendation. Second, the use of the features of interest-fields makes it possible to recommend interest-fields, even if a target user has clicked a very small number of items. While the existing methods provide the user with irrelevant recommendation or no recommendation, using the features of interest-fields, the proposed framework can secure more interest-fields that have not been clicked by the user but have the features similar to the interest-fields that he is already interested in.
Table 9.The accuracy comparisons between our approach and the existing methods
(10 interest-fields, 20 interest-fields) level Accuracy (detail level) Accuracy (small level)
Methods Precision Recall F-measure Precision Recall F-measure Our approach 0.022, 0.012 0.142, 0.157 0.038, 0.022 0.037, 0.022 0.238, 0.277 0.064, 0.0340 rwr-CF 0.009, 0.006 0.066, 0.093 0.016, 0.0120 0.020, 0.015 0.104, 0.148 0.033, 0.026 user-CF 0.012, 0.010 0.092, 0.150 0.012, 0.012 0.032, 0.022 0.162, 0.219 0.038, 0.026 item-CF 0.009, 0.007 0.065, 0.108 0.012, 0.013 0.023, 0.017 0.120, 0.191 0.038, 0.031 user-OCCF - , - - , - - , - 0.002, 0.001 0.002, 0.003 0.003, 0.003 item-OCCF 0.000, 0.000 0.004, 0.007 0.001, 0.001 0.002, 0.001 0.017, 0.028 0.003, 0.003
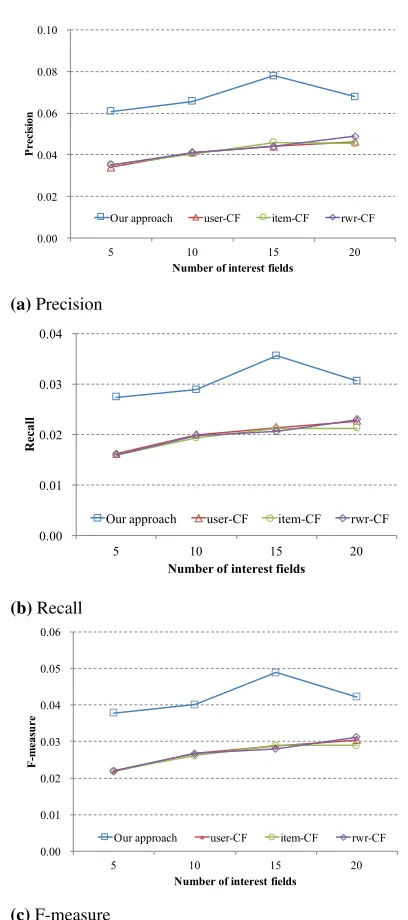
Experiment 4: Cases with cold-start users In this set of experiments, we compared the performance of the proposed framework with rwr-CF, user-CF, item-CF methods for cold-start users. Note that all OCCF based method perform too low accuracy to show in the figures. So, we decide to exclude them in this section. Figure 6 shows the change in accuracy with the increase in the number of interest-fields clicked by each target user. In Figures 6 (a), (b), and (c), thexaxis represents the number of the detail categories clicked by each target user, and they axis represents the precision and recall with 10 recommendations. The proposed framework improved precision by 46% to 79%, recall by 30% to 70%, and F-measure by 35% to 74% over user-CF that showed the best performance among the existing methods. Note that the accuracy of the proposed framework dropped slightly when the number of clicked interest-fields increased from 15 to 20. We conjecture that the cold-start user turns into a general user by that time, so there is little improvement in accuracy even if he clicks more interest-fields.
At the detail category level, the proposed framework improved precision by 77% to 150%, recall by 54% to 119%, and F-measure by 134% to 223% over the existing methods when 10 interest-fields were recommended, and improved precision by 19% to 90%, recall by 5% to 68%, and F-measure by 74% to 89% when 20 interest-fields were recommended. At the small category level, the proposed framework improved 18% to 87% of precision, 48% to 129% of recall, and 69% to 92% of F-measure when 10 interest-fields were recommended, and improved 0% to 48% of precision, 27% to 87% of recall, and 29% to 51% when 20 interest-fields were recommended.
0.00 0.02 0.04 0.06 0.08 0.10
5 10 15 20
P
re
ci
si
on
Number of interest fields
Our approach user-CF item-CF rwr-CF
(a)Precision
0.00 0.01 0.02 0.03 0.04
5 10 15 20
R
ec
al
l
Number of interest fields
Our approach user-CF item-CF rwr-CF
(b)Recall
0.00 0.01 0.02 0.03 0.04 0.05 0.06
5 10 15 20
F
-m
eas
u
re
Number of interest fields
Our approach user-CF item-CF rwr-CF
(c)F-measure
Fig. 6.The accuracy comparison of the recommendations for cold-start users.
recommendation for cold-start users, and thus the proposed method is more suitable for price-comparison services.
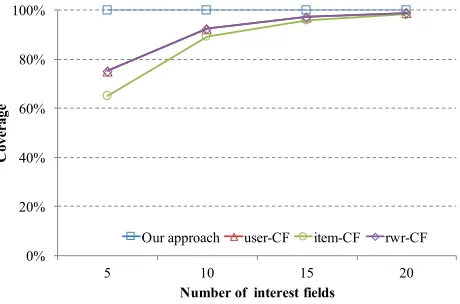
0% 20% 40% 60% 80% 100%
5 10 15 20
C
ove
rage
Number of interest fields
Our approach user-CF item-CF rwr-CF
Fig. 7.The coverage comparison of the recommendations for cold-start user.
Experiment 5: The user study In this final set of experiments, we conducted user studies by asking seven volunteers to evaluate the effectiveness of recommendations obtained from six methods (our approach, user-CF, item-CF, rwr-CF, popularity-based recommendation, and random recommendation). Each volunteer went through 100 users who were randomly selected in experiment 3 examined their clicked detail categories, and selected five users who were most similar to himself. Then, he evaluated the recommendations by six different methods for these five users. He gave binary scores to the interest fields recommended by six methods, indicating whether each recommendation was useful for him or not.
Table 10 presents the result of the effectiveness with top five similar users. The boldfaced number in a gray cell represents the method each volunteer selected as the best. Four out of seven volunteers evaluated that the quality of the recommendation by the proposed framework was the best. The average and the trimmed average scores of the proposed framework are higher than the others. Here, the trimmed average means the average while excluding the highest and the lowest scores. Table 11 summarizes the result of the effectiveness of the recommendation methods with the user most similar to each volunteer. The result is similar to that of Table 10.
Note that in real world the price-comparison service provider tends to recommend popular interest-fields which have been clicked many times by many users and these rec-ommendations is evaluated as satisfactory. We expect an improvement in user satisfaction when applying the proposed strategies to price-comparison services.
5.
Conclusions and Further Study
Table 10.The effectiveness with top five similar users
Ours user-CF item-CF rwr-CF Popular Random
1 0.50 0.35 0.43 0.29 0.40 0.10 2 0.76 0.65 0.55 0.49 0.50 0.40 3 0.14 0.16 0.09 0.09 0.00 0.10 4 0.50 0.64 0.71 0.37 1.00 0.90 5 0.50 0.36 0.21 0.24 0.30 0.20 6 0.66 0.50 0.43 0.30 0.30 0.10 7 0.78 0.81 0.67 0.38 1.00 0.30 Avg.0.55 0.50 0.44 0.31 0.50 0.30
Table 11.The effectiveness with the most similar user
Ours user-CF item-CF rwr-CF Popular Random
1 0.60 0.00 0.43 0.00 0.40 0.10 2 0.60 0.60 0.50 0.20 0.50 0.40 3 0.20 0.00 0.00 0.14 0.00 0.10 4 0.60 0.60 0.75 0.20 1.00 0.90 5 0.90 0.57 0.17 0.00 0.30 0.20 6 0.50 0.60 0.75 0.40 0.30 0.10 7 0.90 1.00 1.00 0.40 1.00 0.30 Avg0.61 0.48 0.51 0.19 0.50 0.30
to figure out the exact item he is interested in. A personalized recommendation would aid the user to find out what he really wants, which would in turn promote the sales. It is, however, difficult to apply the existing recommendation methods to price-comparison services, because most methods require rating information and suffer from the cold-start and latency problems.
This paper has proposed three recommendation strategies to alleviate the problems with existing methods in price-comparison services. The main contributions of our paper can be summarized as follows:
1. Through our preliminary experiments, we have shown that existing recommendation methods provide quite low accuracy when they applied to click log data.
2. We have identified the characteristics of price-comparison services that cause low recommendation accuracy.
3. In order to increase the recommendation accuracy in price-comparison service sites, we have proposed three recommendation strategies as follows. First, we use click-log data to identify users’ preferences. Second, we have similar items grouped together as user’s area of interest when capturing users’ preferences. Third, by exploiting category hierarchy and keyword information of items, we identify the relationships among user’s areas of interest.
5. We have verified the effectiveness of our framework throughout extensive experiments.
The proposed framework improved maximum of 87% in precision and 129% in recall for regular users, and 184% in precision and 173% in for cold-start users over the existing methods. We have also verified the effectiveness of the recommendation via user studies. Our proposed framework can be applied to a variety of applications in addition to price-comparison services. They include personalized web page ranking, click-through-based item recommendation, and recommendation in online shopping environment where the problem of one class collaborative filtering may occur. There are several interesting direc-tions for further study. We are currently in the process of incorporating keyword synonyms with feature nodes. By exploiting the notion of synonyms, we expect to increase the data density, thereby achieving higher recommendation accuracy. Also, we are considering to employ the notion of uninteresting items, which are those items unrated but identified as uninteresting to a user, in the one class collaborative filtering problem [20]. We expect it would improve the recommendation accuracy more significantly.
Acknowledgments.This work was supported by (1) the National Research Foundation of Ko-rea(NRF) grant funded by the Korea government(MSIP; Ministry of Science and ICT) (No. NRF-2017R1A2B3004581) and (2) Next-Generation Information Computing Development Program through the National Research Foundation of Korea(NRF) funded by the Ministry of Science, ICT (NRF-2017M3C4A7069440).
References
1. Adomavicius, G., Tuzhilin, A.: Toward the next generation of recommender systems: A survey of the state-of-the-art and possible extensions. IEEE Transactions on Knowledge and Data Engineering 17(6), 734–749 (2005)
2. Amer-Yahia, S., Roy, S.B., Chawlat, A., Das, G., Yu, C.: Group recommendation: Semantics and efficiency. Proceedings of the VLDB Endowment 2(1), 754–765 (2009)
3. Baltrunas, L., Makcinskas, T., Ricci, F.: Group recommendations with rank aggregation and collaborative filtering. In: Proceedings of the fourth ACM conference on Recommender systems. pp. 119–126. ACM (2010)
4. Bauer, J., Nanopoulos, A.: Recommender systems based on quantitative implicit customer feedback. Decision Support Systems 68, 77–88 (2014)
5. Berkovsky, S., Freyne, J.: Group-based recipe recommendations: analysis of data aggregation strategies. In: Proceedings of the fourth ACM conference on Recommender systems. pp. 111– 118. ACM (2010)
6. Breese, J.S., Heckerman, D., Kadie, C.: Empirical analysis of predictive algorithms for collabo-rative filtering. In: Proceedings of the 14th Conference on Uncertainty in Artificial Intelligence. pp. 43–52. Morgan Kaufmann (1998)
7. Chae, D.K., Kang, J.S., Kim, S.W., Lee, J.T.: Cfgan: A generic collaborative filtering framework based on generative adversarial networks. In: Proceedings of the 27th ACM International Conference on Information and Knowledge Management. pp. 137–146. ACM (2018) 8. Chae, D.K., Lee, S.C., Lee, S.Y., Kim, S.W.: On identifying k-nearest neighbors in neighborhood
10. Chen, T., Zhang, W., Lu, Q., Chen, K., Zheng, Z., Yu, Y.: Svdfeature: a toolkit for feature-based collaborative filtering. Journal of Machine Learning Research 13(Dec), 3619–3622 (2012) 11. Cheng, H., Tan, P.N., Sticklen, J., Punch, W.F.: Recommendation via query centered random
walk on k-partite graph. In: Proceedings of 7th IEEE International Conference on Data Mining. pp. 457–462. IEEE (2007)
12. Dai, C., Qian, F., Jiang, W., Wang, Z., Wu, Z.: A personalized recommendation system for netease dating site. Proceedings of the VLDB Endowment 7(13) (2014)
13. Fang, X., Pan, R., Cao, G., He, X., Dai, W.: Personalized tag recommendation through nonlinear tensor factorization using gaussian kernel. In: Twenty-Ninth AAAI Conference on Artificial Intelligence (2015)
14. Fu, X., Budzik, J., Hammond, K.J.: Mining navigation history for recommendation. In: Pro-ceedings of the 5th International Conference on Intelligent User Interfaces. pp. 106–112. ACM (2000)
15. Gori, M., Pucci, A.: A random-walk based scoring algorithm with application to recommender systems for large-scale e-commerce. In: Proceedings of the 12th ACM SIGKDD International Conference on Knowledge Discovery and Data Mining (2006)
16. Gupta, M., Mittal, H., Singla, P., Bagchi, A.: Characterizing comparison shopping behavior: A case study. In: 2014 IEEE 30th International Conference on Data Engineering Workshops. pp. 115–122. IEEE (2014)
17. Hamedani, M.R., Kim, S.W., Kim, D.J.: Simcc: A novel method to consider both content and citations for computing similarity of scientific papers. Information Sciences 334, 273–292 (2016)
18. Han, J., Kamber, M., Pei, J.: Data mining: Concepts and techniques. Morgan Kaufmann (2006) 19. Hu, Y., Koren, Y., Volinsky, C.: Collaborative filtering for implicit feedback datasets. In: Pro-ceedings of the 8th IEEE International Conference on Data Mining. pp. 263–272. IEEE (2008) 20. Hwang, W.S., Parc, J., Kim, S.W., Lee, J., Lee, D.: “told you i didn’t like it”: Exploiting uninteresting items for effective collaborative filtering. In: 2016 IEEE 32nd International Conference on Data Engineering. pp. 349–360. IEEE (2016)
21. Hwang, W.S., Lee, H.J., Kim, S.W., Won, Y., Lee, M.s.: Efficient recommendation methods using category experts for a large dataset. Information Fusion 28, 75–82 (2016)
22. Jamali, M., Ester, M.: Trustwalker: a random walk model for combining trust-based and item-based recommendation. In: Proceedings of the 15th ACM SIGKDD International Conference on Knowledge Discovery and Data Mining. pp. 397–406. ACM (2009)
23. Jamali, M., Ester, M.: Using a trust network to improve top-n recommendation. In: Proceedings of the 3rd ACM Conference on Recommender Systems. pp. 181–188. ACM (2009)
24. Jo, Y.Y., Kim, S.W., Bae, D.H.: Efficient sparse matrix multiplication on gpu for large social network analysis. In: Proceedings of the 24th ACM International on Conference on Information and Knowledge Management. pp. 1261–1270. ACM (2015)
25. Karypis, G., Kumar, V.: A fast and high quality multilevel scheme for partitioning irregular graphs. SIAM Journal on Scientific Computing 20(1), 359–392 (1998)
26. Kim, H.N., El-Saddik, A., Jo, G.S.: Collaborative error-reflected models for cold-start recom-mender systems. Decision Support Systems 51(3), 519–531 (2011)
27. Konstas, I., Stathopoulos, V., Jose, J.M.: On social networks and collaborative recommendation. In: Proceedings of the 32nd International ACM SIGIR Conference on Research and Development in Information Retrieval. pp. 195–202. ACM (2009)
28. Kumar, V., Pujari, A.K., Sahu, S.K., Kagita, V.R., Padmanabhan, V.: Collaborative filtering using multiple binary maximum margin matrix factorizations. Information Sciences 380, 1–11 (2017)
29. Lee, H.J., Kim, J.W., Park, S.J.: Understanding collaborative filtering parameters for personalized recommendations in e-commerce. Electronic Commerce Research 7(3-4), 293–314 (2007) 30. Lee, J., Lee, D., Lee, Y.C., Hwang, W.S., Kim, S.W.: Improving the accuracy of top-n
31. Lee, S.C., Faloutsos, C., Chae, D.K., Kim, S.W.: Fraud detection in comparison-shopping ser-vices: patterns and anomalies in user click behaviors. IEICE TRANSACTIONS on Information and Systems E100-D(10), 2659–2663 (2017)
32. Lee, Y.C., Kim, S.W., Lee, D.: goccf: Graph-theoretic one-class collaborative filtering based on uninteresting items. In: Thirty-Second AAAI Conference on Artificial Intelligence (2018) 33. Lee, Y., Kim, S.W., Park, S., Xie, X.: How to impute missing ratings?: Claims, solution, and its
application to collaborative filtering. In: Proceedings of the 2018 World Wide Web Conference. pp. 783–792 (2018)
34. Leskovec, J.: New directions in recommender systems. In: Proceedings of the Eighth ACM International Conference on Web Search and Data Mining. pp. 3–4. ACM (2015)
35. Li, M., Dias, B.M., Jarman, I., El-Deredy, W., Lisboa, P.J.: Grocery shopping recommendations based on basket-sensitive random walk. In: Proceedings of the 15th ACM SIGKDD International Conference on Knowledge Discovery and Data Mining. pp. 1215–1224. ACM (2009) 36. Li, Y., Hu, J., Zhai, C., Chen, Y.: Improving one-class collaborative filtering by incorporating
rich user information. In: Proceedings of the 19th ACM international conference on Information and knowledge management. pp. 959–968. ACM (2010)
37. Linden, G., Smith, B., York, J.: Amazon.com recommendations: Item-to-item collaborative filtering. IEEE Internet Computing 7(1), 76–80 (2003)
38. Lu, J., Wu, D., Mao, M., Wang, W., Zhang, G.: Recommender system application developments: A survey. Decision Support Systems 74, 12–32 (2015)
39. Oh, H.K., Kim, S.W., Park, S., Zhou, M.: Can you trust online ratings? a mutual reinforcement model for trustworthy online rating systems. Systems, Man, and Cybernetics: Systems, IEEE Transactions on 45(12), 1564–1576 (2015)
40. Onuma, K., Tong, H., Faloutsos, C.: Tangent: a novel,’surprise me’, recommendation algorithm. In: Proceedings of the 15th ACM SIGKDD International Conference on Knowledge Discovery and Data Mining. pp. 657–666. ACM (2009)
41. Page, L., Brin, S., Motwani, R., Winograd, T.: The pagerank citation ranking: bringing order to the web. Stanford InfoLab (1999)
42. Pan, R., Zhou, Y., Cao, B., Liu, N.N., Lukose, R., Scholz, M., Yang, Q.: One-class collaborative filtering. In: 2008 Eighth IEEE International Conference on Data Mining. pp. 502–511. IEEE (2008)
43. Rafailidis, D., Daras, P.: The tfc model: Tensor factorization and tag clustering for item recom-mendation in social tagging systems. Systems, Man, and Cybernetics: Systems, IEEE Transac-tions on 43(3), 673–688 (2013)
44. Sandvig, J.J., Mobasher, B., Burke, R.: Robustness of collaborative recommendation based on association rule mining. In: Proceedings of the 1st ACM conference on Recommender Systems. pp. 105–112. ACM (2007)
45. Sarwar, B., Karypis, G., Konstan, J., Riedl, J.: Item-based collaborative filtering recommendation algorithms. In: Proceedings of the 10th International Conference on World Wide Web. pp. 285– 295. ACM (2001)
46. Shapira, B., Ricci, F., Kantor, P.B., Rokach, L.: Recommender systems handbook. (2011) 47. Shi, Y., Larson, M., Hanjalic, A.: Exploiting user similarity based on rated-item pools for
improved user-based collaborative filtering. In: Proceedings of the 3rd ACM Conference on Recommender Systems. pp. 125–132. ACM (2009)
48. Tong, H., et al.: Fast random walk with restart and its applications. In: Proceedings on 6th International Conference on Data Mining. pp. 613–622 (2006)
49. Tran, T., Lee, K., Liao, Y., Lee, D.: Regularizing matrix factorization with user and item embeddings for recommendation. In: Proceedings of the 27th ACM International Conference on Information and Knowledge Management. pp. 687–696. ACM (2018)
51. Wang, C., Blei, D.M.: Collaborative topic modeling for recommending scientific articles. In: Proceedings of the 17th ACM SIGKDD international conference on Knowledge discovery and data mining. pp. 448–456. ACM (2011)
52. Wang, F., Ma, S., Yang, L., Li, T.: Recommendation on item graphs. In: Proceedings on 6th International Conference on Data Mining. pp. 1119–1123. IEEE (2006)
53. Wang, H., Wang, N., Yeung, D.Y.: Collaborative deep learning for recommender systems. In: Proceedings of the 21th ACM SIGKDD international conference on knowledge discovery and data mining. pp. 1235–1244. ACM (2015)
54. Yang, L., Cui, Y., Xuan, Y., Wang, C., Belongie, S., Estrin, D.: Unbiased offline recommender evaluation for missing-not-at-random implicit feedback. In: Proceedings of the 12th ACM Conference on Recommender Systems. pp. 279–287. ACM (2018)
55. Yildirim, H., Krishnamoorthy, M.S.: A random walk method for alleviating the sparsity problem in collaborative filtering. In: Proceedings of the 2nd ACM Conference on Recommender Systems. pp. 131–138. ACM (2008)
56. Yoon, S.H., Kim, S.W., Park, S.: C-rank: A link-based similarity measure for scientific literature databases. Information Sciences 326, 25–40 (2016)
57. Yu, X., Ma, H., Hsu, B.J.P., Han, J.: On building entity recommender systems using user click log and freebase knowledge. In: Proceedings of the 7th ACM international conference on Web search and data mining. pp. 263–272. ACM (2014)
Sang-Chul Leereceived the B.S., M.S., and Ph.D. degrees in Electronics and Computer
Engineering from Hanyang University, Seoul, Korea, in 2005, 2007, and 2012, respec tively. He worked as a postdoctoral researcher at Carnegie Mellon University from 2013 to 2015. Currently, he is a senior engineer at Hyundai Heavy Industries. His research interests include data mining, information retrieval, and recommender systems.
Sang-Wook Kimreceived the B.S. degree in computer engineering from Seoul National
University, in 1989, and the M.S. and Ph.D. degrees in computer science from the Korea Advanced Institute of Science and Technology (KAIST), in 1991 and 1994, respectively. From 1995 to 2003, he served as an associate professor at Kangwon National University. In 2003, he joined Hanyang University, Seoul, Korea, where he currently is a professor at the Department of Computer Science and Engineering and the director of the Brain-Korea-21-Plus research program. He is also leading a National Research Lab (NRL) Project funded by the National Research Foundation since 2015. From 2009 to 2010, he visited the Computer Science Department, Carnegie Mellon University, as a visiting professor. From 1999 to 2000, he worked with the IBM T. J. Watson Research Center, USA, as a postdoc. He also visited the Computer Science Department at Stanford University as a visiting researcher in 1991. He is an author of more than 200 papers in refereed international journals and international conference proceedings. His research interests include databases, data mining, multimedia information retrieval, social network analysis, recommendation, and web data analysis. He is a member of the ACM and the IEEE.
Sunju Park is a professor of operations, decisions and information at the School of
University. Her research interests include analysis of online social networks, multiagent systems for online businesses, and pricing of network resources. Her publications have appeared in Computers and Industrial Engineering, Electronic Commerce Research, Trans-portation Research, IIE Transactions, European Journal of Operational Research, Journal of Artificial Intelligence Research, Interfaces, Autonomous Agents and MultiAgent Systems, and other leading journals.
Dong-Kyu Chaereceived the B.S. and Ph.D. degrees in computer science from Hanyang
University, Seoul, Korea, in 2012 and 2019, respectively. From June 2019, he will visit the School of Computational Science & Engineering at Georgia Institute of Technology as a visiting researcher. His current research interests include data mining, social network analysis, recommender systems and deep learning.