Randomized Phase II Designs
Larry Rubinstein
1, John Crowley
2, Percy Ivy
1, Michael LeBlanc
2,
and Dan Sargent
31. National Cancer Institute, Bethesda, Maryland
2. Fred Hutchinson Cancer Research Center, Cancer Research and Biostatistics, Seattle, Washington 3. Mayo Clinic, Division of Biomedical Statistics and Informatics, Rochester, Minnesota
Abstract
As the use of molecularly targeted agents, which are anticipated to increase overall and progression-free survival (OS and PFS), but not necessarily tumor response, has
increased in oncology, there has been a corresponding increase in the recommendation and use of randomized phase II designs. Such designs reduce the potential for bias, existent in comparisons with historical controls, but also substantially increase the sample size requirements. We review the principal statistical designs for historically controlled and randomized phase II trials, along with their advantages, disadvantages, and statistical design considerations. We review the arguments for and against the use of randomization in phase II studies, the situations in which use of historical controls are preferred, and the situations in which use of randomized designs are preferred. We review methods used to calculate predicted OS or PFS values from historical controls, adjusted so as to be
appropriate for an experimental sample with particular prognostic characteristics. We demonstrate how adjustment of the type I and type II error bounds for randomized studies can facilitate detection of appropriate target increases in median PFS or OS with sample sizes appropriate for phase II studies. While there continues to be differences among investigators concerning the use of randomization vs. historical controls in phase II trials, there is agreement that each approach will continue to be appropriate, and the optimal approach will depend upon the circumstances of the individual trial.
1. Introduction and statement of the problem
The recent rapid evolution in oncology drug development has challenged these previously accepted paradigms. Many phase II trials are now designed to assess the promise of a molecularly targeted agent, given either alone or in combination with another regimen. In particular, it is not always anticipated that such agents are likely to produce or improve tumor response rates; rather that such agents will improve PFS or OS through means other than direct cell killing as evidenced by tumor shrinkage [4]. In addition, for many diseases, such as lung, colon, breast, and renal cancers [5,6,7], tumor response has failed to predict for a survival benefit, and for other diseases, such as glioblastoma and prostate cancer, tumor response has proven difficult to measure. Finally, recent papers have demonstrated that even with the use of standard cytotoxic therapy, patients without a tumor response benefit from superior therapy [8]. In general, PFS is the preferred endpoint for such phase II trials, since it is more statistically efficient than OS (because it is significantly shorter and the treatment effect is not diluted by salvage treatment). For diseases with very short median OS and lack of effective salvage treatment, or where PFS cannot be reliably measured, OS may be a preferred endpoint, even in the phase II setting [9]. Such trials can be single-arm studies, with an endpoint of median PFS or OS, or PFS or OS may be measured at a particular time point, and then compared to that of historical controls. Alternatively, such trials can be randomized.
As the use of molecularly targeted agents, which are anticipated to increase OS and PFS, but not necessarily tumor response, has increased in oncology, there has been a
corresponding increase in the recommendation and use of randomized phase II designs. Such designs reduce the potential for bias, existent in comparisons with historical controls, but also substantially increase the sample size requirements.
In this paper, we will discuss the statistical issues concerning the use of randomized versus non-randomized phase II designs in the context of these various current challenges. We review the principal statistical designs for historically controlled and randomized phase II trials, along with their advantages, disadvantages, and statistical design considerations. We review the arguments for and against the use of randomization in phase II studies, the situations in which use of historical controls are preferred, and the situations in which use of randomized designs are preferred. We review methods used to calculate predicted OS or PFS values from historical controls, adjusted to be appropriate for an experimental sample with particular prognostic characteristics. We demonstrate how adjustment of the type I and type II error bounds for randomized studies can
facilitate detection of appropriate target increases in median PFS or OS with sample sizes appropriate for phase II studies. While there continues to be differences among
investigators concerning the use of randomization vs. historical controls in phase II trials, there is agreement that each approach will continue to be appropriate, and the optimal approach will depend upon the circumstances of the individual trial.
2. Historically controlled studies
marker or target, or where prognostic factors may vary between experimental and control patient samples. For this reason, phase II trials with time-to-event endpoints (PFS or OS) are often randomized. However, there are also strong reasons why statisticians and clinicians sometimes resist the use of randomized control groups in phase II trials. Perhaps the strongest reason is statistical efficiency. If there is high confidence that the historical data concerning PFS or OS fairly represent what would be expected of the experimental group treated in the standard manner, then evaluating the results with an experimental agent or regimen can be done with half the patients or less, by using historical controls rather than randomizing against a control group. This is true even if there is not access to individual patient historical data, but only the median survival, or if the number of patients in the historic series is limited. Brookmeyer and Crowley [10] give methodology for comparing against historic data, and calculating the required sample size, when only the median survival is available. Rubinstein et al [11] give methodology for calculating the required sample size for randomized studies using the logrank statistic. Korn and Freidlin [12] show how this approach can be extended to one-armed studies compared against historical controls, if the patient data are available.
The most significant concern with using historical controls to assess PFS or OS in a single-arm phase II trial of an experimental treatment is that the historical controls may not fairly represent the expected outcome of the experimental patients, if given standard treatment. In other words, the historical control patients may be inherently inferior or superior in terms of expected PFS or OS, due to differences with respect to at least three factors. First, the expected outcomes for standard of care may change over time, due to improvements in supportive care, earlier detection, differences in radiological assessment techniques, greater availability of second line therapy (if the endpoint is OS), or other reasons. Second, the inter-institution variability in outcomes has been shown to be large in many settings, thus if the new trial enrolls patients from different institutions, or in a different ratio from the same institutions, the historical data may be inaccurate. Finally, the patients on the new trial may differ from the patients in the historical studies due to differences in prognostic factors [13]. If the important prognostic factors associated with clinical outcome in the patient population can be identified, this problem may be partially addressed, as demonstrated by Korn et al [14]. Using a large meta-analysis of melanoma patients treated on phase II studies, they identify the important prognostic variables and their contributions to one-year OS and six-month PFS rates, as well as to the survival distributions for either time-to-event endpoint. This allows them to construct tests of the observed one-year OS and six-month PFS rates, or of the respective observed survival distributions, associated with a one-armed test of an experimental regimen, adjusting for the particular mix of prognostic factors in the experimental population. This effort is currently being extended to advanced non-small cell lung cancer, and metastatic
3. Randomized studies
For several decades, there has been increased interest in randomized designs for phase II studies in oncology. An increasing number of new agents are biologic or molecularly targeted, and thus are anticipated to yield increased PFS or OS but not necessarily increased tumor shrinkage [4], alone or, more likely, in combination with standard
regimens. PFS or OS is affected by patient characteristics (not always identifiable) which may vary between a new experimental sample and historical control patients. In addition, there is a strong argument for randomization for studies in which the endpoint has been collected differently or inconsistently in the past or is absent from historical data sets. For instance, this could be an endpoint which includes biochemical measures, such as PSA progression in prostate cancer [13]. On the other hand, for some diseases it may be more difficult to accrue patients to a randomized study compared to a non-randomized study at the phase II stage of drug development due to patient and/or physician preferences. Also, in rare disease settings accrual is a problem. Randomized designs generally require as much as four times as many patients as single-arm studies, compared to historical
controls, with similar theoretical statistical operating characteristics. Therefore, there has been a series of attempts to develop randomized designs that offer some protection against the uncertainties and potential biases of one-armed studies, while retaining some of the statistical efficiency.
One early attempt by Herson and Carter [15] involved randomizing a portion of the patients to a small reference arm. The experimental arm would not be compared to the reference arm; it would be analyzed against historical controls as if it were a one-armed study. The reference arm in this design was intended to only act as a check on the
similarity of the current patients to the historical controls with respect to clinical outcome when given the standard treatment. The disadvantages of this sort of approach are that the reference arm is too small for its outcome to truly assure comparability for the experimental group, since there is little power to reliably detect a moderate but clinically meaningful lack of comparability. If, in this design, the reference arm has outcome substantially different from that expected based on historical controls, it is often difficult to interpret the outcome of the experimental arm. If the reference arm does very poorly compared to controls, an apparently negative outcome for the experimental arm may be due to inferior prognosis for the patients. Conversely, if the reference arm does very well compared to controls, an apparently positive outcome for the experimental arm may be due to superior prognosis for the patients. This is a generic problem with attempting to incorporate a randomized control arm into a phase II trial that is not large enough to allow for direct comparison, to reduce the associated cost in increased sample size.
endpoint). The disadvantage of this approach is that if the experimental treatment offers no true increase in tumor response rate, the phase III trial will still proceed beyond the initial phase II stage with .50 probability. In other words, the initial phase II stage is operating at the .50 significance level. This is a generic problem with randomized phase II/III designs; it is very difficult to operate at an appropriate type I and type II error rate without having a large sample size for the phase II portion. This sort of design is appropriate if the investigators are already reasonably certain that the experimental treatment is sufficiently promising to justify a phase III trial, but wish to build into the trial a check on that assumption. Thall [17] provides a good review of randomized phase II/III designs; see also Goldman, LeBlanc and Crowley [18].
3.1. Selection designs
There is one context in which the use of a randomized phase II design can achieve its statistical objectives while maintaining a relatively small sample size, which is the case of directly comparing two experimental regimens, primarily for the purpose of prioritizing between the two. Simon et al [19] formalized such pick-the-winner selection designs, where the regimen with a superior observed response rate (by any amount) is chosen, among the two, for further testing. The original designs were constructed to yield 90% power to detect the superior regimen if the true difference between the response rates was 15% (in absolute terms). The weakness in the original design is that it does not assure that the (sometimes nominally) superior experimental regimen is superior to standard therapy. It was occasionally argued that an ineffective experimental regimen could act as a control arm for the other regimen, but the design was not constructed to be used in this way, since, as designed, one of the two experimental regimens would always be chosen to go forward, even if neither was superior to standard treatment. To address this, in practice, each arm of the selection design is generally constructed as a two-stage design, to be compared separately against a historically defined response rate (Liu, Moon and LeBlanc [20]). However, that approach requires that it be possible to compare the
experimental regimens to historical controls; this, as we have argued above, is not always the case.
Where the randomized phase II selection design is appropriate, it can be conducted with modest sample size. For example, Simon et al demonstrate that only 29-37 patients per arm will yield 90% power to detect a regimen that has response rate superior by 15%, in a two armed study. This approach can be adapted to randomized phase II trials with time-to-event (PFS or OS) endpoints, where the logrank test is used to choose between the two regimens, with dramatic results (Liu, Dahlberg and Crowley [21]). Rubinstein et al [11] show that the required sample size for such trials is proportional to (z∀ + z∃)2 where z∀ and z∃ are the standard normal values associated with the type I and type II error bounds, respectively. This means that if the type I error is set to .5 (z∀= 0), as it is for the
size (approximately 65 patients total) to the original selection designs constructed to detect a response rate difference of 15% with 90% power.
3.2. Screening design of Rubinstein et al [22]
None of the randomized phase II designs described above fully address the problem outlined in the beginning of section 3 – the increasing need in oncology to evaluate agents that are anticipated to increase PFS or OS, but not objective tumor response, primarily in combination with standard regimens, where comparison to historical controls may be problematic [4]. The reference arm and phase II/III designs have serious
disadvantages, as outlined, and the selection design is meant for the limited situation where experimental regimens are to be compared for prioritization purposes, but, in general, each must also prove itself against historical controls. For this reason,
Rubinstein et al [22], building on previous work by Simon et al [23] and Korn et al [24], (and similarly to Fleming [25]) formalized the randomized phase II screening design. The intention was to define randomized phase II designs that yielded statistical properties and sample sizes appropriate to phase II studies. They were meant to enable preliminary comparisons of an experimental treatment regimen, generally composed of a standard regimen with an experimental agent added, to an appropriate control, generally the standard regimen.
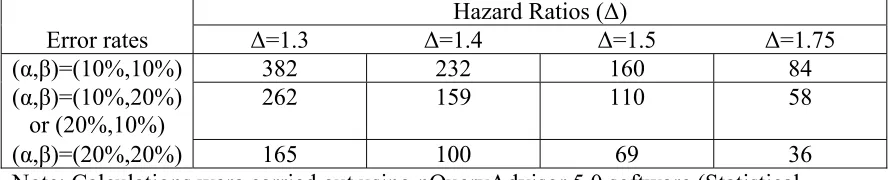
Table 1 illustrates the statistical properties of such designs when the endpoint is PFS (or OS), and the logrank test is used. The table provides the required numbers of failures for various type I and type II error rates appropriate to phase II trials, and for various targeted hazard ratios (control hazard/experimental hazard). In general, it is expected that phase II studies will be conducted in patients with advanced disease, where most patients will progress within the trial period, so the required number of failures closely approximates the required number of patients. (For example, if (α,β)=(10%,10%) and Δ=1.75 (median PFS is 5.25 vs. 3 months), and if accrual is over 1.5 year, with follow-up of 6 months, only 96 patients are required to observe 84 events, and similarly for the other items in the table.) In the setting of the randomized trial, the usual limits for type I and type II errors may be stretched; in fact, usage of type I error of .20 may be cautiously considered. It can also be noted that restricting the trial to a total sample size no greater than
approximately 100 patients requires the targeted hazard ratio to be at least 1.5.
Table 1.
Approximate required numbers of observed (total) treatment failures for screening trials with PFS endpoints, using the logrank testHazard Ratios (Δ)
Error rates Δ=1.3 Δ=1.4 Δ=1.5 Δ=1.75
(α,β)=(10%,10%) 382 232 160 84
(α,β)=(10%,20%) or (20%,10%)
262 159 110 58
(α,β)=(20%,20%) 165 100 69 36
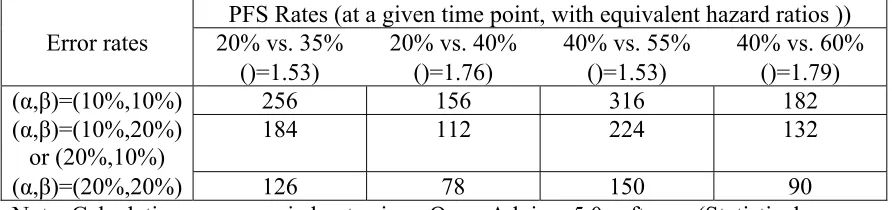
Table 2 illustrates the statistical properties of such designs when the endpoint is PFS rate, measured at a prespecified time point, and the binomial proportion test is used. The table provides the required numbers of patients for various type I and type II error rates and for various targeted PFS rate differences (with the equivalent hazard ratios, calculated under the assumption of exponentiality). The table reflects that the binomial proportion test, in general, is quite statistically inefficient in comparison to the logrank test. In fact, for the same targeted hazard ratio, the comparison of PFS rates at a particular time point requires approximately twice as many patients. Comparing PFS at a particular time point rather than across the entire survival curve means that restricting to a total sample size no greater than approximately 100 requires the targeted hazard ratio (control
hazard/experimental hazard) to be at least 1.75. Nevertheless, comparing PFS at a pre-specified time is often done since PFS is often considered to be an endpoint that is difficult to measure, potentially subject to investigator bias, or influenced by differential follow-up between the treatment arms.
Table 2.
Approximate required numbers of total patients for screening trials with PFS rate (at a specified time) endpoints, using the binomial proportion testPFS Rates (at a given time point, with equivalent hazard ratios )) Error rates 20% vs. 35%
()=1.53)
20% vs. 40% ()=1.76)
40% vs. 55% ()=1.53)
40% vs. 60% ()=1.79)
(α,β)=(10%,10%) 256 156 316 182
(α,β)=(10%,20%)
or (20%,10%) 184 112 224 132
(α,β)=(20%,20%) 126 78 150 90
Note: Calculations were carried out using nQueryAdvisor 5.0 software (Statistical Solutions, Saugus, MA) based on methods given in Fleiss et al [27] with 1-sided α
3.3 Randomized discontinuation design
Rosner et al [28] propose a randomized discontinuation design that initially treats all patients with the study agent for a defined time period, and then randomizes patients with stable disease to continuation or discontinuation for a defined period to assess the effect of the drug in a population of presumably responsive and more homogeneous patients (Figure 3). This design is probably most appropriate in situations where the treatment is such that significant continued benefit after initial benefit, in general, implies significant benefit overall, and vice versa. Freidlin and Simon [29] argue that in many settings this design is less efficient than a standard randomized study, due to the large number of patients who must be treated initially, and thus a large number of patients may be
3.4. PFS vs. OS in randomized phase II studies
There are significant advantages to using PFS as the primary endpoint rather than OS in randomized phase II studies. Time-to-progression is shorter than time-to-death,
sometimes substantially, so that the PFS endpoint yields more failures and thus greater power for the logrank test. Hazard ratios for PFS are generally greater than for OS, again yielding greater power for the logrank test. Finally, a positive phase II result based on PFS is less likely to complicate randomization to the definitive phase III study than a positive phase II result based on OS. There are, however, also significant disadvantages to using PFS as the primary endpoint [4]. Sometimes PFS is difficult to measure reliably. There may also be concern that evaluation of the endpoint is influenced by investigator treatment bias or differential follow-up by treatment (if the control patients are followed more or less vigilantly, this may bias the observed time of progression). In some cases, the issues of bias can be addressed effectively by blinding the study. If this is not
possible, at least the bias associated with differential follow-up can be addressed by using a comparison based on PFS rate at a pre-specified time, rather than using the logrank test. However, as we have demonstrated in section 3.2, this results in substantial loss of
statistical efficiency. Freidlin et al [30] address this problem by proposing a statistic based on comparing the two treatment arms at two pre-specified time points. They demonstrate that this approach, which also promises to minimize bias due to differential treatment follow-up, recovers most of the efficiency lost in comparison to the logrank test.
4. Discussion
It must be emphasized that a randomized phase II study should almost never be taken as definitive evidence for the superior efficacy of an experimental agent or regimen. Rubinstein et al [22] and Fleming et al [25] suggest that the p-value must be less than .005 or smaller (a standard cut-off for phase III interim monitoring) for the phase II trial to preclude the necessity for conducting a definitive phase III successor study. Liu et al [31] demonstrate that small randomized phase II studies can yield substantial false
positive rates as well as substantially exaggerated estimated treatment effects. Moreover, as argued by Redman and Crowley [32], in settings where adequate historical controls exist, historically controlled phase II studies are more efficient than randomized studies. Taylor et al [33] explore the performance of one-arm vs. two-arm phase II trials, using a tumor response endpoint, and conclude that two-arm trials may be superior if the sample size is larger (80 vs. 30 patients) and the uncertainty in the historical response rate is relatively high; in other cases, a single arm trial is generally preferred.
standard agent controls. An international task force [38] recommended that in “select circumstances”, randomized phase II studies of targeted anticancer therapy are “helpful to define the best dose or schedule, or to test combinations”, but single arm phase II studies continue to be appropriate “when the likely outcomes in the population studied are well described”. In an accompanying editorial, Ratain et al [39] took a stronger position, strongly recommending that randomized phase II trials “become a standard approach in oncology, especially for the development of drug combinations.” Our own
recommendations concerning the various phase II designs discussed are briefly
summarized in Figure 2, but this summary should not be used in lieu of the more nuanced recommendations given above. While there continues to be differences among
Figure 1: Statistical terms used with respect to phase II clinical trials
Historical controls
Patients treated previously (or not, if no standard treatment is available) who are used as a standard for comparison with patients currently treated on an experimental regimen. Such patients should be otherwise similar to the experimental patients.
Type I error (∀)
The probability of mistakenly calling an experimental treatment superior when, in fact, it is no better than the standard treatment (or no treatment, if there is no standard). The “significance level” associated with a particular outcome is the type I error probability associated with that outcome.
Type II error (∃)
The probability of mistakenly calling an experimental treatment non-superior when, in fact, it is non-superior to the standard by a pre-defined target difference. The “power” of a trial to detect the target difference is 1 minus the type II error.
Z∀ and Z∃ The standard normal distribution values for which the probability of falling above the value is ∀ or ∃, respectively. For example, Z.05 = 1.645.
Binomial proportion test
In randomized studies, the statistical test used to determine whether the proportion (rate) of tumor responses associated with an experimental treatment is greater than that associated with the standard treatment (or no treatment, if there is no standard).
Hazard ratio Often used when constant instantaneous failure rates (“hazards”) are assumed for the two treatments – the ratio between the standard and experimental treatment hazards. (Failure is usually defined as disease progression.) When the hazards are constant, the hazard ratio is also the ratio between the median times to failure for the experimental vs. standard treatments. The hazard ratio may be generalized to the situation where the ratio, but not the individual hazard rates, is constant over time. Logrank test In randomized studies, the statistical test used to determine whether the
Figure 2: Summary of phase II trial designs
Trial design Pros, cons and appropriate usage
Historical controls Appropriate for most trials with a tumor response endpoint. Minimizes required sample size but may be misleading, for a PFS endpoint, if experimental patients differ from the historical controls in important prognostic factors, quality of care, or extent of follow-up. It may be possible to statistically adjust for important covariates if such information is available for both experimental and historical control patients.
Reference arm Randomization to a small reference control arm may afford a modest degree of re-assurance that the historical controls are appropriate, but the ability to detect differences between the reference arm and historical controls is limited, and any such detected differences can not be easily adjusted for. In general, this design is not recommended.
Phase II/III trial Makes efficient use of the patients by incorporating a phase II early look in a phase III trial, in cases where an additional check is desired for an otherwise very promising experimental regimen. In general, this design is not recommended for phase II screening. Selection
(pick-the-winner) design
An efficient and effective way of comparing two experimental regimens, usually incorporating comparisons of each with historical controls, and usually involving a tumor response endpoint. This design is generally not appropriate for evaluating the addition of an experimental agent to a standard regimen.
Screening design Limits the sample size required for a randomized phase II
comparison by appropriately adjusting the type I and II error rates and the target difference. Particularly appropriate for evaluating the addition of an experimental agent to a standard regimen, and when using a PFS endpoint.
Randomized discontinuation design
Figure 3: Randomized Discontinuation Design
Treat all patients initially on the experimental regimen for a defined period of time
Randomize only those that remain stable
(patients who progress are taken off study and patients who respond continue to receive the experimental regimen)
Placebo Experimental
5. References
1. Simon, R. Optimal two-stage designs for phase II clinical trials. Control Clin Trials 1989;10:1-10.
2. Green, SJ, Dahlberg, S. Planned versus attained design in Phase II clinical trials. Stat Med 1992;11:853-62.
3. Therasse, P, Arbuck, SG, Eisenhauer, EA, et al. New guidelines to evaluate the
response to treatment in solid tumors (RECIST guidelines). J Natl Cancer Inst 2000;92:205-16.
4. Dhani, N, Tu, D, Sargent, DJ, et al. Alternate endpoints for screening phase II studies. Clin Cancer Res 2009;15:in press.
5. Burzykowski, T, Buyse, M, Piccart-Gebhart, MJ, et al. Evaluation of tumor response,
disease control, progression-free survival, and time to progression as potential surrogate end points in metastatic breast cancer. J Clin Oncol 2008;26:1987-92. 6. Buyse, M, Thirion, P, Carlson, RW, et al. Relation between tumour response to
first-line chemotherapy and survival in advanced colorectal cancer: a meta-analysis. Meta-Analysis Group in Cancer. Lancet 2000;356:373-8.
7. Goffin, J, Baral, S, Tu, D, et al. Objective responses in patients with malignant
melanoma or renal cell cancer in early clinical studies do not predict regulatory approval. Clin Cancer Res 2005;11:5928-34.
8. Grothey, A, Hedrick, EE, Mass, RD, et al. Response-independent survival benefit in
metastatic colorectal cancer: A comparative analysis of N9741 and AVF2107. J of Clin Oncol 2008;26:183-9.
9. Ballman, KV, Buckner, JC, Brown, PD, et al. The relationship between six-month progression-free survival and 12-month overall survival end points for phase II trials in patients with glioblastoma multiforme. Neuro Oncol 2007;9:29-38.
10.Brookmeyer, R, Crowley, JJ. A confidence interval for the median survival time. Biometrics 1982;38:29-41.
11.Rubinstein, LV, Gail, MH, Santner, TJ. Planning the duration of a clinical trial with loss to follow-up and a period of continued observation. J Chron Dis 1981;34:469-79. 12.Korn, EL, Freidlin, B. Conditional power calculations for clinical trials with historical
controls. Stat Med 2006;25:2922-31.
13.McShane, LM, Hunsberger, S, Adjei, AA. Biomarkers in phase II trials. Clin Cancer Res 2009;15:in press.
14.Korn, EL, Liu, PY, Lee, SJ, et al. Meta-analysis of phase II cooperative group trials
in metastatic stage IV melanoma to determine progression-free and overall survival benchmarks for future phase II trials. J Clin Oncol 2008;26:527-34.
15.Herson, J, Carter, SK. Calibrated phase II clinical trials in oncology. Stat Med 1986;5:441-7.
16.Ellenberg, SS, Eisenberger, MA. An efficient design for phase III studies of combination chemotherapies. Cancer Treatment Reports 1985;69:1147-54. 17.Thall, PF. A review of phase 2-3 clinical trial designs. Lifetime Data Anal
2008;14:37-53.
19.Simon, R, Wittes, RE, Ellenberg, SS. Randomized phase II clinical trials. Cancer Treatment Reports 1985;69:1375-81.
20.Liu, PY, Moon, J, LeBlanc, M. Phase II selection designs. In Handbook of Statistics
in Clinical Oncology, second edition, Crowley, J, Ankerst, DP, Eds, Chapman and Hall/CRC. 2006:155-64.
21.Liu, PY, Dahlberg, S, Crowley, J. Selections designs for pilot studies based on survival. Biometrics 1993;49:391-8.
22.Rubinstein, LV, Korn, EL, Freidlin, B, et al. Design issues of randomized phase II
trials and a proposal for phase II screening trials. J Clin Oncol 2005;23:7199-206. 23.Simon, RM, Steinberg, SM, Hamilton, M, et al. Clinical trial designs for the early
clinical development of therapeutic cancer vaccines. J Clin Oncol 2001;19:1848-54. 24.Korn, EL, Arbuck, SG, Pluda, JM, et al. Clinical trial designs for cytostatic agents:
are new designs needed? J Clin Oncol 2001;19:265-72.
25.Fleming, TR, Richardson, BA. Some design issues in trials of microbicides for the prevention of HIV infection. J Infect Dis 2004;190:666-74.
26.Collett, D. Modeling Survival Data in Medical Research. Chapman and Hall 1994. 27.Fleiss, JL, Tytun, A, Ury, HK. A simple approximation for calculating sample sizes
for comparing independent proportions. Biometrics 1980;36:343-6.
28.Rosner, GL, Stadler, W, Ratain, MJ. Randomized discontinuation design: Application to cytostatic antineoplastic agents. J Clin Oncol 2002;20:4478-84.
29.Freidlin, B, Simon, R. Evaluation of randomized discontinuation design. J Clin Oncol 2005;23:5094-8.
30.Freidlin, B, Korn, EL, Hunsberger, S, et al. Proposal for the use of progression-free
survival in unblinded randomized trials. J Clin Oncol 2007;25:2122-6.
31.Liu, PY, LeBlanc, M, Desai, M. False positive rates of phase II designs. Control Clin Trials 1999;20:343-52.
32.Redman, M, Crowley, J. Small randomized trials. J Thor Oncol 2007;2:1-2. 33.Taylor, JMG, Braun, TM, Li, Z. Comparing an experimental agent to a standard
agent: relative merits of a one-arm or randomized two-arm phase II design. Clin Trials 2006;3:335-48.
34.Protocol review committee. Phase II trials in the EORTC. Eur J Cancer 1997;33:1361-3.
35.Van Glabbeke, M, Steward, W, Armand, JP. Non-randomised phase II trials of drug combinations: often meaningless, sometimes misleading. Are there alternative strategies? Eur J Cancer 2002;38:635-8.
36.Wieand, HS. Randomized phase II trials: What does randomization gain? J Clin Oncol 2005;23:1794-5.
37. El-Maraghi, RH, Eisenhauer, EA. Review of phase II trial designs used in studies of molecular targeted agents: Outcomes and predictors of success in phase III. J Clin Oncol 2008;26:1346-54.
38.Booth, CM, Calvert, HA, Giaccone, G, et al. Design and conduct of phase II studies
of targeted anticancer therapy: Recommendations from the task force on methodology for the development of innovative cancer therapies (MDICT). Eur J of Cancer
2008;44:25-9.
39.Ratain, MJ, Humphrey, RW, Gordon, GB, et al. Recommended changes to oncology